. 2023 Oct 20;12(10):1884.
doi: 10.3390/antiox12101884.

Physiological and RNA-Seq Analyses on Exogenous Strigolactones Alleviating Drought by Improving Antioxidation and Photosynthesis in Wheat (Triticum aestivum L.)

Affiliations

Physiological and RNA-Seq Analyses on Exogenous Strigolactones Alleviating Drought by Improving Antioxidation and Photosynthesis in Wheat (Triticum aestivum L.)

Miao Song et al. Antioxidants (Basel). .

Abstract

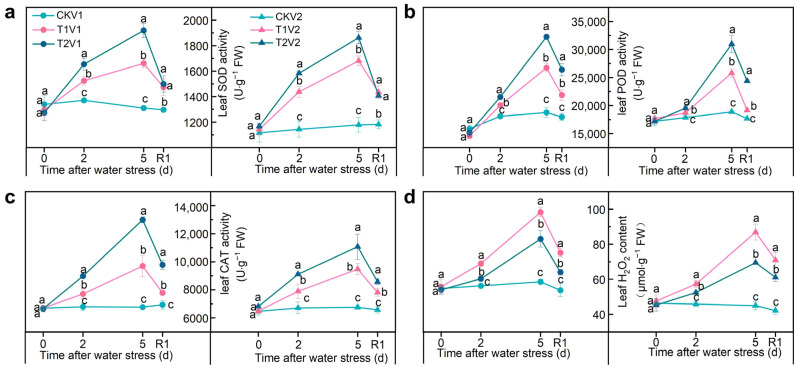
Drought poses a significant challenge to global wheat production, and the application of exogenous phytohormones offers a convenient approach to enhancing drought tolerance of wheat. However, little is known about the molecular mechanism by which strigolactones (SLs), newly discovered phytohormones, alleviate drought stress in wheat. Therefore, this study is aimed at elucidating the physiological and molecular mechanisms operating in wheat and gaining insights into the specific role of SLs in ameliorating responses to the stress. The results showed that SLs application upregulated the expression of genes associated with the antioxidant defense system (Fe/Mn-SOD, PER1, PER22, SPC4, CAT2, APX1, APX7, GSTU6, GST4, GOR, GRXC1, and GRXC15), chlorophyll biogenesis (CHLH, and CPX), light-harvesting chlorophyll A-B binding proteins (WHAB1.6, and LHC Ib-21), electron transfer (PNSL2), E3 ubiquitin-protein ligase (BB, CHIP, and RHY1A), heat stress transcription factor (HSFA1, HSFA4D, and HSFC2B), heat shock proteins (HSP23.2, HSP16.9A, HSP17.9A, HSP21, HSP70, HSP70-16, HSP70-17, HSP70-8, HSP90-5, and HSP90-6), DnaJ family members (ATJ1, ATJ3, and DJA6), as well as other chaperones (BAG1, CIP73, CIPB1, and CPN60I). but the expression level of genes involved in chlorophyll degradation (SGR, NOL, PPH, PAO, TIC55, and PTC52) as well as photorespiration (AGT2) was found to be downregulated by SLs priming. As a result, the activities of superoxide dismutase (SOD), peroxidase (POD), and catalase (CAT) were enhanced, and chlorophyll content and photosynthetic rate were increased, which indicated the alleviation of drought stress in wheat. These findings demonstrated that SLs alleviate drought stress by promoting photosynthesis through enhancing chlorophyll levels, and by facilitating ROS scavenging through modulation of the antioxidant system. The study advances understandings of the molecular mechanism underlying SLs-mediated drought alleviation and provides valuable insights for implementing sustainable farming practice under water restriction.

Keywords: RNA-seq; ROS; antioxidation; drought; photosynthesis; strigolactones; wheat.


Conflict of interest statement

The authors declare no conflict of interest.

Figures

Figure 1
Figure 1
Phenotype, leaf relative water content and leaf relative saturation deficit in different treatments plants. (a) the photos showed the water deficit phenotype of Zhoumai 28 and Luohan 22 under normal conditions (CK), drought stress in soil (T1), and drought stress in soil with SLs priming (T2) after 5 d of drought stress; the scale bar indicates 10 cm; (b) leaf relative water content in different treatments; (c) leaf relative saturation deficit in different treatments. V1 represents Zhoumai 28, and V2 represents Luohan 22. R1 indicates 1 d after rehydration treatment. Different letters indicate significant difference at p < 0.05 according to one-way ANOVA followed by Duncan’s test. Data indicate mean ± SD (n = 3).
Figure 2
Figure 2
Photosynthetic performance in different treatments plants. (a) net photosynthetic rate; (b) transpiration rate; (c) stomatal conductance; (d) intercellular CO2 concentration. V1 represents Zhoumai 28, and V2 represents Luohan 22. R1 indicates 1 d after rehydration treatment. Different letters indicate significant difference at p < 0.05 according to one-way ANOVA followed by Duncan’s test. Data indicate mean ± SD (n = 3).
Figure 3
Figure 3
Antioxidant enzyme activity and H2O2 content in leaves under different treatments. (a) SOD activity; (b) POD activity; (c) CAT activity; (d) H2O2 content. V1 represents Zhoumai 28, and V2 represents Luohan 22. R1 indicates 1 d after rehydration treatment. Different letters indicate significant difference at p < 0.05 according to one-way ANOVA followed by Duncan’s test. Data indicate mean ± SD (n = 3).
Figure 4
Figure 4
GO and KEGG enrichment of 62 DEGs. (a) sankey dot plot of GO analysis based on biological process; (b) sankey dot plot of KEGG analysis. The dot size was based on the gene count enriched in the pathway, and the color of the dot showed the pathway enrichment significance. All enrichment results were selected with the significance threshold “p < 0.05”.
Figure 5
Figure 5
KEGG and GO enrichment of blue module by WGCNA. (a) KEGG enrichment analysis of blue module; (b) GO enrichment based on biological process of blue module; (c) GO enrichment based on molecular function of blue module; (d) GO enrichment based on cellular component of blue module. The dot size was based on the gene count enriched in the pathway, and the color of the dot showed the pathway enrichment significance. All enrichment results were selected with the significance threshold “p < 0.05”.
Figure 6
Figure 6
Expression differences of DEGs related to antioxidants in blue module based on WGCNA. (a) heatmap of the expression patterns of DEGs. FPKM values were normalized by Z-score. (b) qRT-PCR validation of key antioxidants genes. A, B, C, and D in coordinate maenad different sampling times, A = after water stress 0 d, B = after water stress 2 d, C = after water stress 5 d, D = rehydration for 1 d. R1 indicates 1 d after rehydration treatment. Different letters indicate significant difference at p < 0.05 according to one-way ANOVA followed by Duncan’s test.
Figure 7
Figure 7
Expression differences of DEGs related to chlorophyll metabolism and photosynthesis in blue module based on WGCNA. (a) heatmap of the expression patterns of DEGs. FPKM values were normalized by Z-score. (b) qRT-PCR validation of key chlorophyll metabolism and photosynthesis genes. A, B, C, and D in coordinate maenad different sampling times, A = after water stress 0 d, B = after water stress 2 d, C = after water stress 5 d, D = rehydration for 1 d. R1 indicates 1 d after rehydration treatment. Different letters indicate significant difference at p < 0.05 according to one-way ANOVA followed by Duncan’s test.
Figure 8
Figure 8
Expression differences of DEGs related to repair protein misfolding in blue module based on WGCNA. (a) heatmap of the expression patterns of DEGs. FPKM values were normalized by Z-score. (b) qRT-PCR validation of key repair protein misfolding genes. A, B, C, and D in coordinate maenad different sampling times, A = after water stress 0 d, B = after water stress 2 d, C = after water stress 5 d, D = rehydration for 1 d. R1 indicates 1 d after rehydration treatment. Different letters indicate significant difference at p < 0.05 according to one-way ANOVA followed by Duncan’s test.
Figure 9
Figure 9
Schematic illustration of a hypothetical mechanism for SLs-mediated drought alleviation in wheat. Note: the bold orange arrows indicate upregulated genes; the bold gray arrows indicate downregulated genes; thin orange arrows indicate increase; thin gray arrows indicate decrease.

References

    1. Farooq M., Wahid A., Kobayashi N., Fujita D., Basra S.M.A. Plant drought stress: Effects, mechanisms and management. Sustain. Agric. 2009;29:153–188.
    1. Lesk C., Rowhani P., Ramankutty N. Influence of extreme weather disasters on global crop production. Nature. 2016;529:84–87. doi: 10.1038/nature16467. - DOI - PubMed
    1. Trnka M., Feng S., Semenov M.A., Olesen J.E., Kersebaum K.C., Rötter R.P., Semerádová D., Klem K., Huang W., Ruiz-Ramos M., et al. Mitigation efforts will not fully alleviate the increase in water scarcity occurrence probability in wheat-producing areas. Sci. Adv. 2019;5:eaau2406. doi: 10.1126/sciadv.aau2406. - DOI - PMC - PubMed
    1. Fahad S., Bajwa A.A., Nazir U., Anjum S.A., Farooq A., Zohaib A., Sadia S., Nasim W., Adkins S., Saud S., et al. Crop production under drought and heat stress: Plant responses and management options. Front. Plant Sci. 2017;8:01147. doi: 10.3389/fpls.2017.01147. - DOI - PMC - PubMed
    1. Ru C., Hu X., Chen D., Wang W., Zhen J. Photosynthetic, antioxidant activities, and osmoregulatory responses in winter wheat differ during the stress and recovery periods under heat, drought, and combined stress. Plant Sci. 2023;327:111557. doi: 10.1016/j.plantsci.2022.111557. - DOI - PubMed