

Super-Resolution Ultrasound Imaging of Renal Vascular Alterations in Zucker Diabetic Fatty Rats during the Development of Diabetic Kidney Disease
- PMID: 37892017
- PMCID: PMC10605617
- DOI: 10.3390/diagnostics13203197
Super-Resolution Ultrasound Imaging of Renal Vascular Alterations in Zucker Diabetic Fatty Rats during the Development of Diabetic Kidney Disease
Abstract
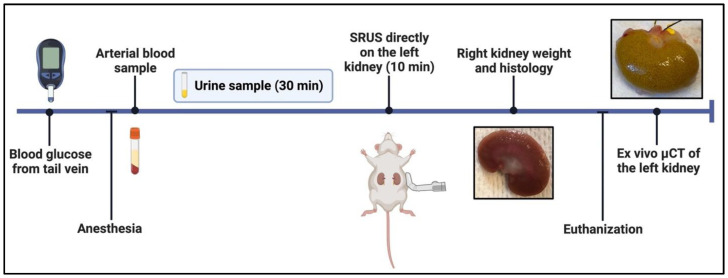
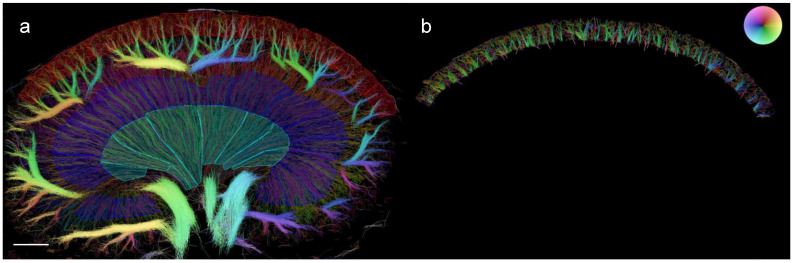
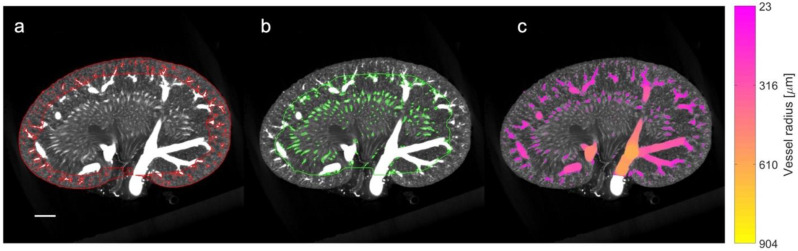
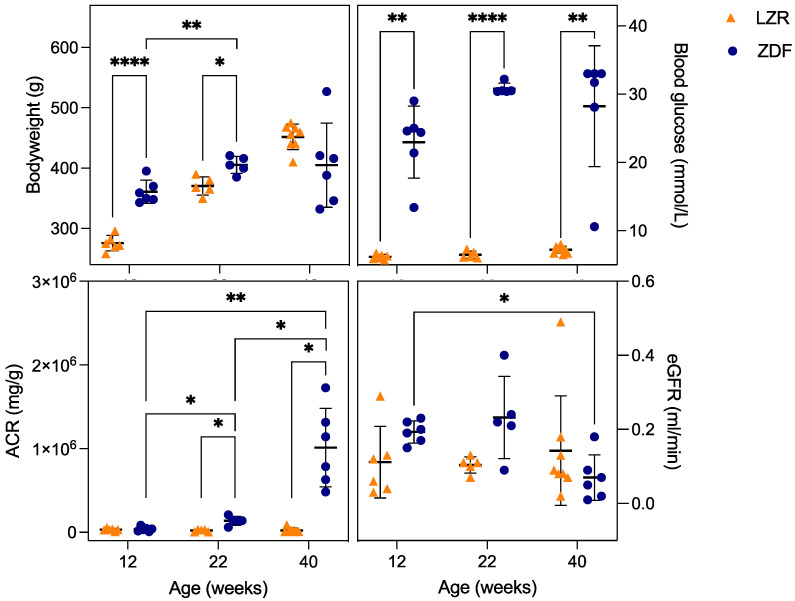
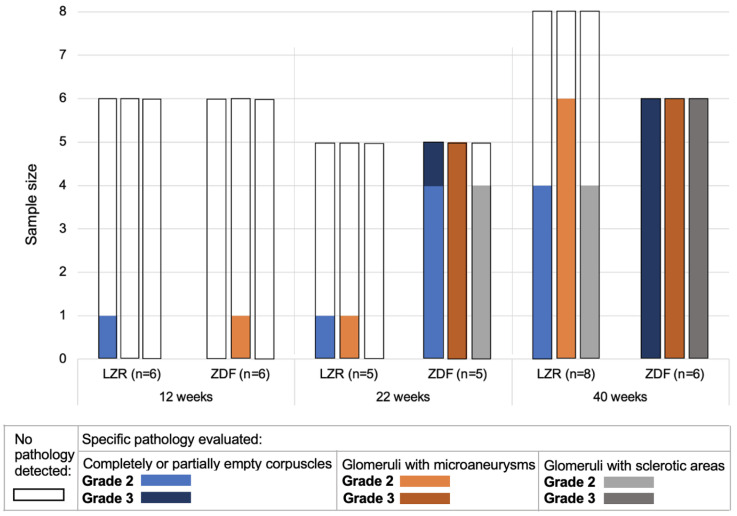
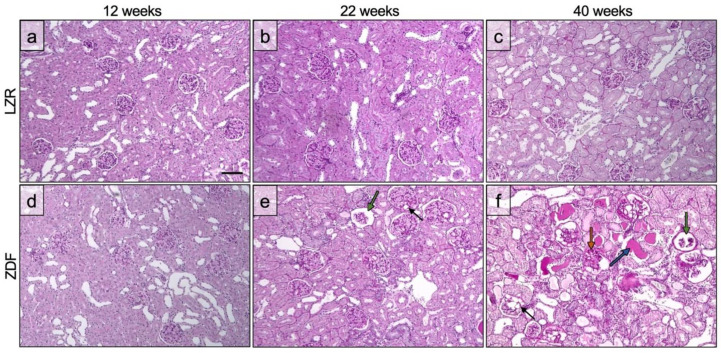
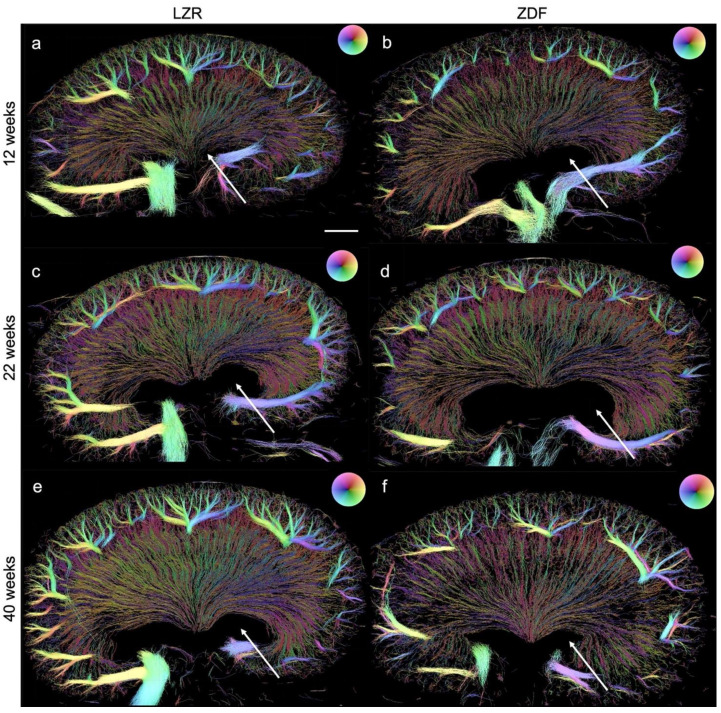
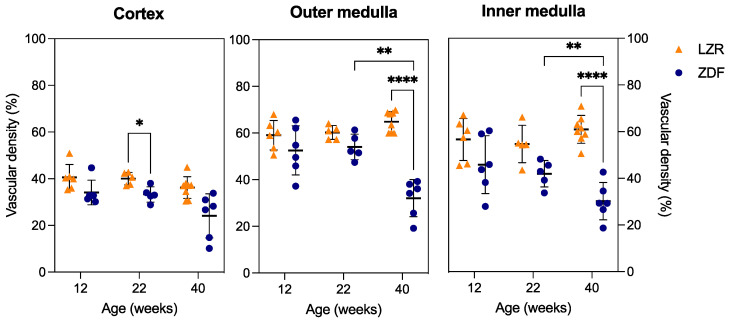
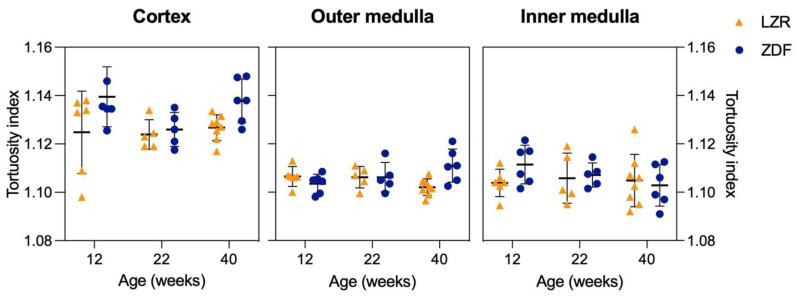
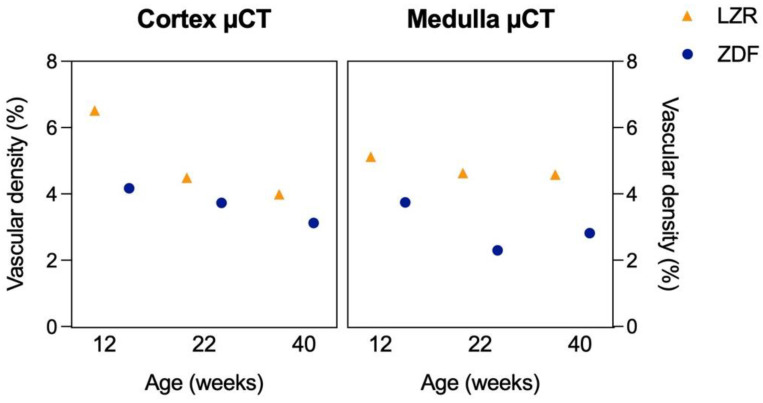
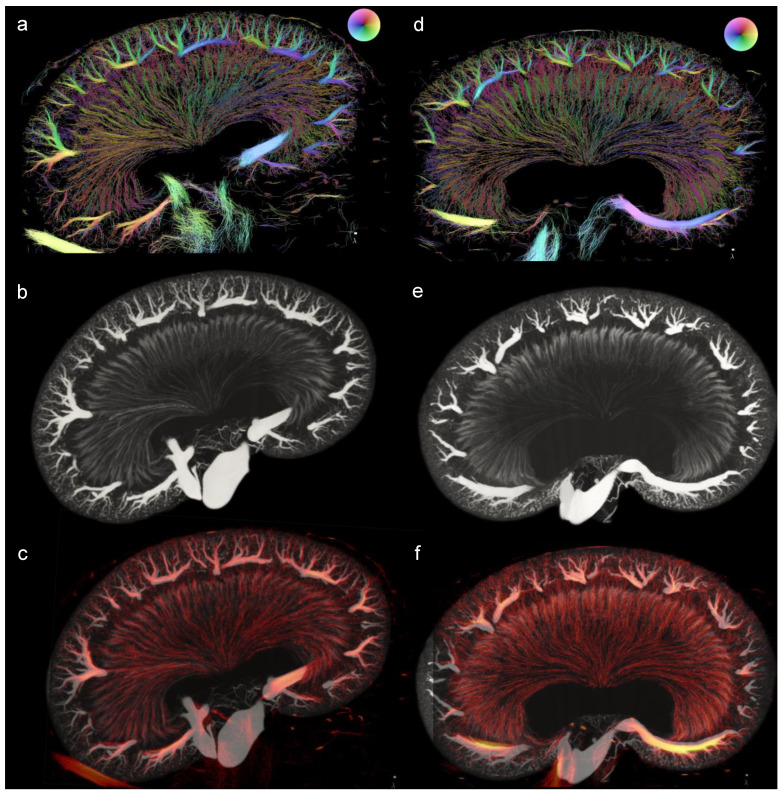
Individuals with diabetes at risk of developing diabetic kidney disease (DKD) are challenging to identify using currently available clinical methods. Prognostic accuracy and initiation of treatment could be improved by a quantification of the renal microvascular rarefaction and the increased vascular tortuosity during the development of DKD. Super-resolution ultrasound (SRUS) imaging is an in vivo technique capable of visualizing blood vessels at sizes below 75 µm. This preclinical study aimed to investigate the alterations in renal blood vessels' density and tortuosity in a type 2 diabetes rat model, Zucker diabetic fatty (ZDF) rats, as a prediction of DKD. Lean age-matched Zucker rats were used as controls. A total of 36 rats were studied, subdivided into ages of 12, 22, and 40 weeks. Measured albuminuria indicated the early stage of DKD, and the SRUS was compared with the ex vivo micro-computed tomography (µCT) of the same kidneys. Assessed using the SRUS imaging, a significantly decreased cortical vascular density was detected in the ZDF rats from 22 weeks of age compared to the healthy controls, concomitant with a significantly increased albuminuria. Already by week 12, a trend towards a decreased cortical vascular density was found prior to the increased albuminuria. The quantified vascular density in µCT corresponded with the in vivo SRUS imaging, presenting a consistently lower vascular density in the ZDF rats. Regarding vessel tortuosity, an overall trend towards an increased tortuosity was present in the ZDF rats. SRUS shows promise for becoming an additional tool for monitoring and prognosing DKD. In the future, large-scale animal studies and human trials are needed for confirmation.
Keywords: chronic kidney disease; diagnostic imaging; renal injury; type 2 diabetes; ultrasound localization microscopy.
Conflict of interest statement
M.S. is an employee at BK Medical ApS, Herlev, Denmark.
Figures
Similar articles
-
The Zucker Diabetic Fatty Rat as a Model for Vascular Changes in Diabetic Kidney Disease: Characterising Hydronephrosis.Diagnostics (Basel). 2025 Mar 20;15(6):782. doi: 10.3390/diagnostics15060782. Diagnostics (Basel). 2025. PMID: 40150124 Free PMC article.
-
Super-Resolution Ultrasound Imaging Provides Quantification of the Renal Cortical and Medullary Vasculature in Obese Zucker Rats: A Pilot Study.Diagnostics (Basel). 2022 Jul 4;12(7):1626. doi: 10.3390/diagnostics12071626. Diagnostics (Basel). 2022. PMID: 35885531 Free PMC article.
-
Evaluation of 2D super-resolution ultrasound imaging of the rat renal vasculature using ex vivo micro-computed tomography.Sci Rep. 2021 Dec 21;11(1):24335. doi: 10.1038/s41598-021-03726-6. Sci Rep. 2021. PMID: 34934089 Free PMC article.
-
Prevention of diabetic nephropathy by compound 21, selective agonist of angiotensin type 2 receptors, in Zucker diabetic fatty rats.Am J Physiol Renal Physiol. 2014 Nov 15;307(10):F1123-31. doi: 10.1152/ajprenal.00247.2014. Epub 2014 Sep 3. Am J Physiol Renal Physiol. 2014. PMID: 25186297
-
Super-resolution ultrasound and microvasculomics: a consensus statement.Eur Radiol. 2024 Nov;34(11):7503-7513. doi: 10.1007/s00330-024-10796-3. Epub 2024 May 29. Eur Radiol. 2024. PMID: 38811389 Review.
Cited by
-
Value of Ultrasound Super-Resolution Imaging for the Assessment of Renal Microcirculation in Patients with Acute Kidney Injury: A Preliminary Study.Diagnostics (Basel). 2024 Jun 5;14(11):1192. doi: 10.3390/diagnostics14111192. Diagnostics (Basel). 2024. PMID: 38893718 Free PMC article.
-
Alterations of urine microRNA-7977/G6PD level in patients with diabetic kidney disease and its association with dysfunction of albumin-induced autophagy in proximal epithelial tubular cells.Am J Physiol Endocrinol Metab. 2024 Oct 1;327(4):E512-E523. doi: 10.1152/ajpendo.00399.2023. Epub 2024 Aug 14. Am J Physiol Endocrinol Metab. 2024. PMID: 39140974 Free PMC article.
-
Ultrasound super-resolution imaging for the assessment of renal allograft dysfunction: A pilot study.Heliyon. 2024 Aug 17;10(16):e36515. doi: 10.1016/j.heliyon.2024.e36515. eCollection 2024 Aug 30. Heliyon. 2024. PMID: 39247269 Free PMC article.
-
Analysing the Renal Vasculature Using Super-Resolution Ultrasound Imaging: Considerations for Clinical and Research Applications.Diagnostics (Basel). 2025 Jun 14;15(12):1515. doi: 10.3390/diagnostics15121515. Diagnostics (Basel). 2025. PMID: 40564835 Free PMC article.
-
Integrated Ultrasound Characterization of the Diet-Induced Obesity (DIO) Model in Young Adult c57bl/6j Mice: Assessment of Cardiovascular, Renal and Hepatic Changes.J Imaging. 2024 Sep 4;10(9):217. doi: 10.3390/jimaging10090217. J Imaging. 2024. PMID: 39330437 Free PMC article.
References
-
- International Diabetes Federation, Diabetes Atlas (10th ed.) [(accessed on 21 February 2022)]. Available online: www.diabetesatlas.org.
-
- World Health Organization Diabetes. [(accessed on 25 May 2022)]. Available online: https://www.who.int/news-room/fact-sheets/detail/diabetes.
Grants and funding
LinkOut - more resources
Full Text Sources
