. 2023 Oct 12;13(10):1513.
doi: 10.3390/biom13101513.

5'-tRF-19-Q1Q89PJZ Suppresses the Proliferation and Metastasis of Pancreatic Cancer Cells via Regulating Hexokinase 1-Mediated Glycolysis

Affiliations

5'-tRF-19-Q1Q89PJZ Suppresses the Proliferation and Metastasis of Pancreatic Cancer Cells via Regulating Hexokinase 1-Mediated Glycolysis

Wenpeng Cao et al. Biomolecules. .

Abstract

tRNA-derived small RNAs (tDRs) are dysregulated in several diseases, including pancreatic cancer (PC). However, only a limited number of tDRs involved in PC progression are known. Herein, a novel tDR, 5'-tRF-19-Q1Q89PJZ (tRF-19-Q1Q89PJZ), was verified in PC plasma using RNA and Sanger sequencing. tRF-19-Q1Q89PJZ was downregulated in PC tissues and plasma, which was related to advanced clinical characteristics and poor prognosis. tRF-19-Q1Q89PJZ overexpression inhibited the malignant activity of PC cells in vitro, while tRF-19-Q1Q89PJZ inhibition produced an opposite effect. The differentially expressed genes induced by tRF-19-Q1Q89PJZ overexpression were enriched in "pathways in cancer" and "glycolysis". Mechanistically, tRF-19-Q1Q89PJZ directly sponged hexokinase 1 (HK1) mRNA and inhibited its expression, thereby suppressing glycolysis in PC cells. HK1 restoration relieved the inhibitory effect of tRF-19-Q1Q89PJZ on glycolysis in PC cells and on their proliferation and mobility in vitro. tRF-19-Q1Q89PJZ upregulation inhibited PC cell proliferation and metastasis in vivo and suppressed HK1 expression in tumor tissues. Furthermore, tRF-19-Q1Q89PJZ expression was attenuated under hypoxia. Collectively, these findings indicate that tRF-19-Q1Q89PJZ suppresses the malignant activity of PC cells by regulating HK1-mediated glycolysis. Thus, tRF-19-Q1Q89PJZ may serve as a key target for PC therapy.

Keywords: 5′-tRF-19-Q1Q89PJZ; glycolysis; hexokinase 1; metastasis; pancreatic cancer.


Conflict of interest statement

The authors declare no conflict of interest.

Figures

Figure 1
Figure 1
The expression profiles of tDRs in plasma of PC and HC. (A) Schematic presenting the experimental procedure of our study. (B) Percent in differential tDRs for each type in PC and HC plasma. (C) The expression profiles in PC and HC plasma. (D) Candidate tDRs’ expression as measured using qRT-PCR. (E) qRT-PCR product confirmed using Sanger sequencing. (F,G) Nucleocytoplasmic separation and FISH assays revealed that tRF-19-Q1Q89PJZ is mainly expressed in the cytoplasm in AsPC-1 and PANC-1 cells. *** p < 0.001, n = 3. The control group was used for comparison. Data are shown as mean ± SD.
Figure 2
Figure 2
Correlation between tRF-19-Q1Q89PJZ expression and clinical characteristics of PC. (A) Expression level of tRF-19-Q1Q89PJZ as detected using qRT-PCR in 80 paired PC and adjacent non-tumor tissues. (B) Fold changes (log2) in tRF-19-Q1Q89PJZ expression in each paired sample, arranged from high to low values. (C) ISH analysis of the expression level of tRF-19-Q1Q89PJZ in PC and adjacent non-tumor tissue. (D) Correlation between tRF-19-Q1Q89PJZ expression and lymph node invasion. (E) Correlation between tRF-19-Q1Q89PJZ expression and clinical stage. (F) Correlation between tRF-19-Q1Q89PJZ expression and distant metastasis. (G) Correlation between tRF-19-Q1Q89PJZ expression and perineural invasion. (H) PC cases were divided into two groups according to the median value of tRF-19-Q1Q89PJZ expression. Overall survival was analyzed using Kaplan–Meier survival analysis with the log-rank test. * p < 0.05, ** p < 0.01, n = 3. The control group was used for comparison. Data are shown as mean ± SD.
Figure 3
Figure 3
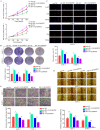
tRF-19-Q1Q89PJZ inhibits the proliferation and metastasis of PC cells. (A) CCK-8 assay comparing the proliferation of PANC-1 and AsPC-1 cells in the anti-NC (negative control), the anti-tRF-19-Q1Q89PJZ, tRF-NC, and tRF-19-Q1Q89PJZ groups. (B) Colony formation assay of PANC-1 and AsPC-1 cells in the anti-NC, anti-tRF-19-Q1Q89PJZ, tRF-NC, and tRF-19-Q1Q89PJZ groups. (C) EDU assay of the proliferation of PANC-1 and AsPC-1 cells in the anti-NC, anti-tRF-19-Q1Q89PJZ, tRF-NC, and tRF-19-Q1Q89PJZ groups. (D) Wound healing assay of the migration ability of PANC-1 and AsPC-1 cells in the anti-NC, anti-tRF-19-Q1Q89PJZ, tRF-NC, and tRF-19-Q1Q89PJZ groups. (E) Transwell assay of the migration and invasion ability of PANC-1 and AsPC-1 cells in the anti-NC, anti-tRF-19-Q1Q89PJZ, tRF-NC, and tRF-19-Q1Q89PJZ groups. * p < 0.05, ** p < 0.01, n = 3. The control group was used for comparison. Data are shown as mean ± SD.
Figure 4
Figure 4
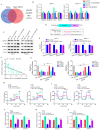
tRF-19-Q1Q89PJZ inhibits glycolysis in PC cells. (A) Volcano plot showing mRNA levels between PANC-1 cells transfected with tRF-NC and tRF-19-Q1Q89PJZ. (B) KEGG analysis was performed to determine the pathways in which the differentially expressed genes were enriched. (C) Gene enrichment plots showing a series of genes enriched in glycolysis/gluconeogenesis. (D) GO analysis was performed to determine the pathways of differentially expressed genes enriched in glycolysis/gluconeogenesis. (E,F) Seahorse Bioscience XFp measured the ECAR and OCR of PANC-1 and AsPC-1 cells in the anti-NC, anti-tRF-19-Q1Q89PJZ, tRF-NC, and tRF-19-Q1Q89PJZ groups. (GI) Glucose uptake, lactate production, and ATP synthesis of PANC-1 and AsPC-1 cells in the anti-NC, anti-tRF-19-Q1Q89PJZ, tRF-NC, and tRF-19-Q1Q89PJZ groups. * p < 0.05, ** p < 0.01, n = 3. The control group was used for comparison. Data are shown as mean ± SD.
Figure 5
Figure 5
HK1 is a target of tRF-19-Q1Q89PJZ in PC. (A) Venn diagram showing overlapping of the identified and predicted target mRNAs of tRF-19-Q1Q89PJZ. (B) qRT-PCR showing the transcript levels of HOXD3, HK1, RABEP2, and ZNF74 in PC cells transfected with anti-tRF-19-Q1Q89PJZ or tRF-19-Q1Q89PJZ, or their negative controls. (C) Western blotting showing the protein levels of HOXD3, HK1, RABEP2, and ZNF74 in PC cells transfected with anti-tRF-19-Q1Q89PJZ or tRF-19-Q1Q89PJZ, or their negative controls. (D) Schematic diagram of the predicted interaction position between tRF-19-Q1Q89PJZ and seed regions within the 3′-UTR and mutation region of HK1. (E) Luciferase activity of pmirGLO-HK1 was significantly decreased by the tRF-19-Q1Q89PJZ mimic in PC cells. (F) Spearman rank correlation analysis, showing a negative correlation between tRF-19-Q1Q89PJZ and HK1. (G) PC cells were co-transfected with a plasmid expressing the HK1 3′-UTR, tRF-19-Q1Q89PJZ mimic, and siRNAs targeting AGO1, AGO2, AGO3, and AGO4. After 48 h, the transfected cells were collected using the luciferase assay. (H,I) Seahorse Bioscience XFp measured the ECAR and OCR of PANC-1 and AsPC-1 cells in the NC, HK1, tRF-19-Q1Q89PJZ, and HK1+tRF-19-Q1Q89PJZ groups. (JL) Glucose uptake, lactate production, and ATP synthesis of PANC-1 and AsPC-1 cells in the NC, HK1, tRF-19-Q1Q89PJZ, and HK1+tRF-19-Q1Q89PJZ groups. * p < 0.05, ** p < 0.01, n = 3. The control group was used for comparison. Data are shown as mean ± SD.
Figure 6
Figure 6
Restoration of HK1 reverses the inhibitory effects of tRF-19-Q1Q89PJZ. Cells were divided into four groups and subjected to different treatments: negative-control lentiviruses transfection (NC), transfection of tRF-19-Q1Q89PJZ lentiviruses (tRF-19-Q1Q89PJZ) alone, transfection of HK1 plasmid (HK1) alone, and transfection of tRF-19-Q1Q89PJZ lentiviruses and HK1 plasmid (HK1+ tRF-19-Q1Q89PJZ). (A) CCK-8 assays were used to detect the proliferation ability of each group. (B) Colony formation assays were used to determine the proliferation ability of cells in each group. (C) EDU assays were used to determine the proliferation ability of cells in each group. (D) Wound healing assays were used to determine the migration ability of cells in each group. (E) Transwell assays were used to determine the invasion ability of cells in each group. * p < 0.05, ** p < 0.01, n = 3. The control group was used for comparison. Data are shown as mean ± SD.
Figure 7
Figure 7
tRF-19-Q1Q89PJZ inhibits the proliferation and metastasis of PC cells in vitro. (A) Typical image of nude mouse tumors (n = 5). Subcutaneous tumor (B) volume and (C) weight. (D) Typical IHC staining images showing Ki-67, PCNA, and HK1 expression levels in transplanted tumors under different experimental conditions. (E,F) Typical IHC staining of HE images showing metastatic loci in the pulmonary tissues. (G) Kaplan–Meier survival curves for each experimental group. * p < 0.05, ** p < 0.01, n = 3. The control group was used for comparison. Data are shown as mean ± SD.
Figure 8
Figure 8
tRF-19-Q1Q89PJZ is downregulated in a hypoxic microenvironment. (AE) Transcript levels of tRF-19-Q1Q89PJZ in PC cells cultured with inflammatory cytokines (i.e., IL-6, IL-10, LIF, TNF-α, and TGF-β dissolved in 0.5% BSA) were determined. (F) PC cells were cultured with 10% or 1% FBS, and the transcript levels of tRF-19-Q1Q89PJZ were detected using qRT-PCR. (G) PC cells were cultured in environments with or without 10 mM of lactate, and the transcript levels of tRF-19-Q1Q89PJZ were detected using qRT-PCR. (H) PC cells were cultured in 21% or 1% O2 environments, and the transcript levels of tRF-19-Q1Q89PJZ were detected using qRT-PCR. * p < 0.05, ** p < 0.01, n = 3. The control group was used for comparison. Data are shown as mean ± SD.

References

    1. Hue J.J., Bingmer K., Sugumar K., Ocuin L.M., Rothermel L.D., Winter J.M., Ammori J.B., Hardacre J.M. Mortality and Survival Among Octogenarians with Localized Pancreatic Head Cancer: A National Cancer Database Analysis. J. Gastrointest. Surg. 2021;25:2582–2592. doi: 10.1007/s11605-021-04949-8. - DOI - PubMed
    1. Yee N.S., Zhang S., He H.Z., Zheng S.Y. Extracellular Vesicles as Potential Biomarkers for Early Detection and Diagnosis of Pancreatic Cancer. Biomedicines. 2020;8:581. doi: 10.3390/biomedicines8120581. - DOI - PMC - PubMed
    1. Springfeld C., Ferrone C.R., Katz M.H.G., Philip P.A., Hong T.S., Hackert T., Büchler M.W., Neoptolemos J. Neoadjuvant therapy for pancreatic cancer. Nat. Rev. Clin. Oncol. 2023;20:318–337. doi: 10.1038/s41571-023-00746-1. - DOI - PubMed
    1. Qin C., Yang G., Yang J., Ren B., Wang H., Chen G., Zhao F., You L., Wang W., Zhao Y. Metabolism of pancreatic cancer: Paving the way to better anticancer strategies. Mol. Cancer. 2020;19:50. doi: 10.1186/s12943-020-01169-7. - DOI - PMC - PubMed
    1. Yang J., Ren B., Yang G., Wang H., Chen G., You L., Zhang T., Zhao Y. The enhancement of glycolysis regulates pancreatic cancer metastasis. Cell. Mol. Life Sci. 2020;7:305–321. doi: 10.1007/s00018-019-03278-z. - DOI - PMC - PubMed

Publication types