. 2023 Oct 20;15(20):4448.
doi: 10.3390/nu15204448.

Administration of Linoleoylethanolamide Reduced Weight Gain, Dyslipidemia, and Inflammation Associated with High-Fat-Diet-Induced Obesity

Affiliations

Administration of Linoleoylethanolamide Reduced Weight Gain, Dyslipidemia, and Inflammation Associated with High-Fat-Diet-Induced Obesity

Rubén Tovar et al. Nutrients. .

Abstract

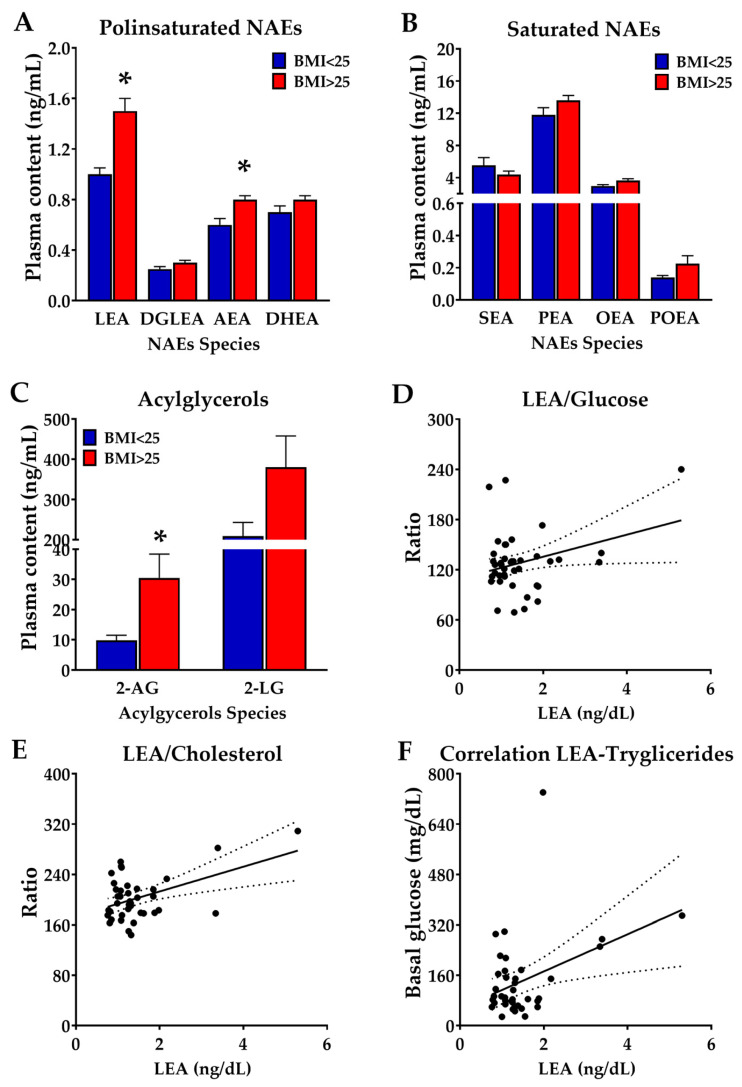
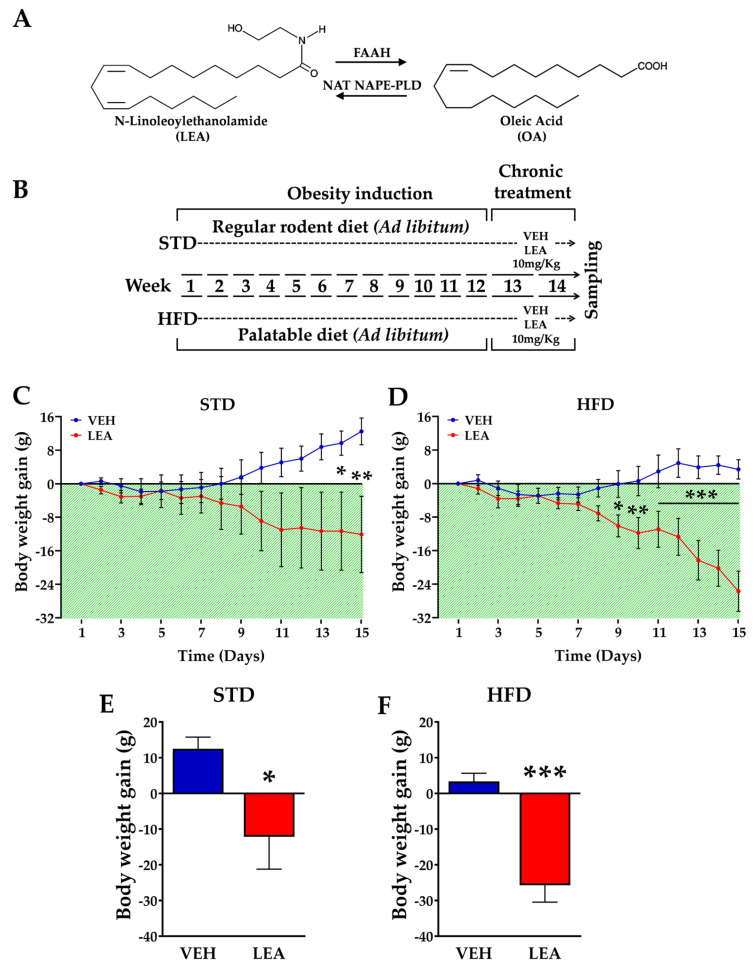
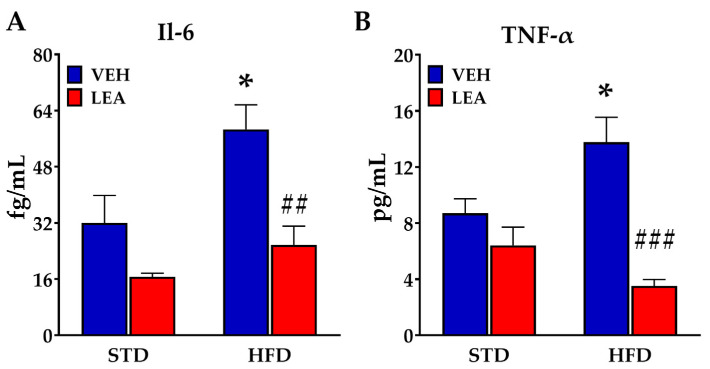
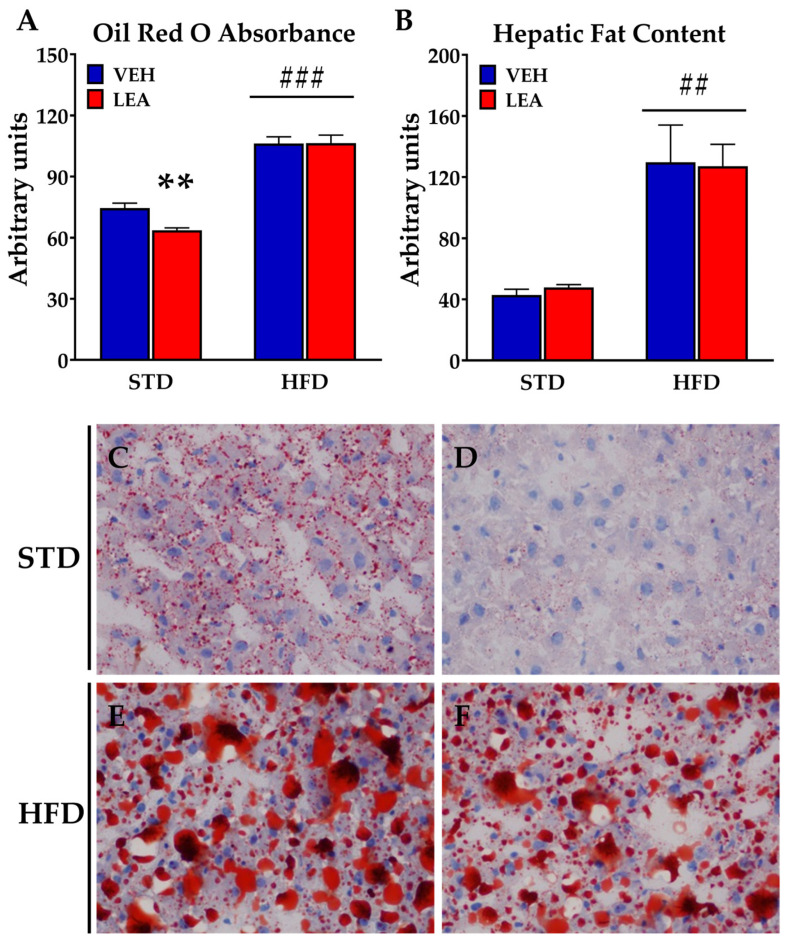
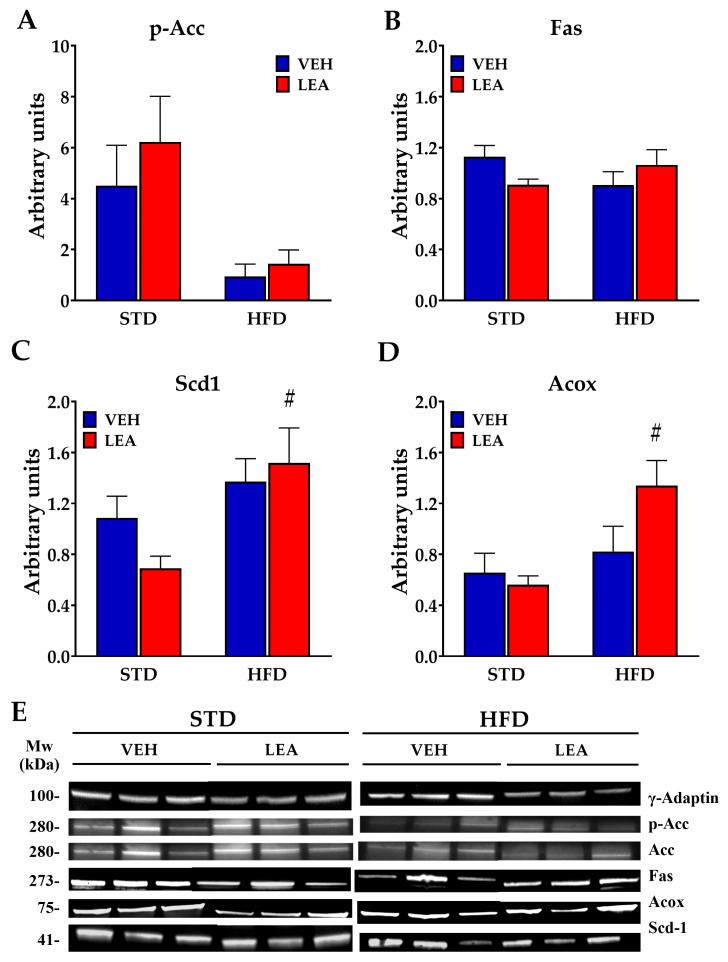
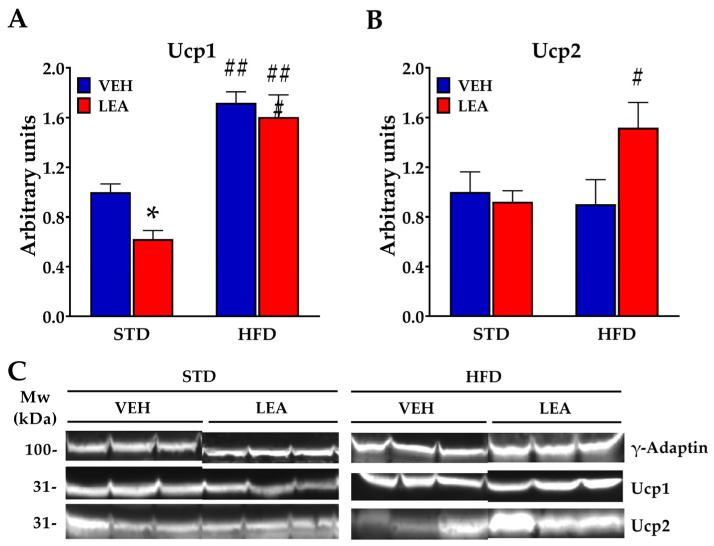
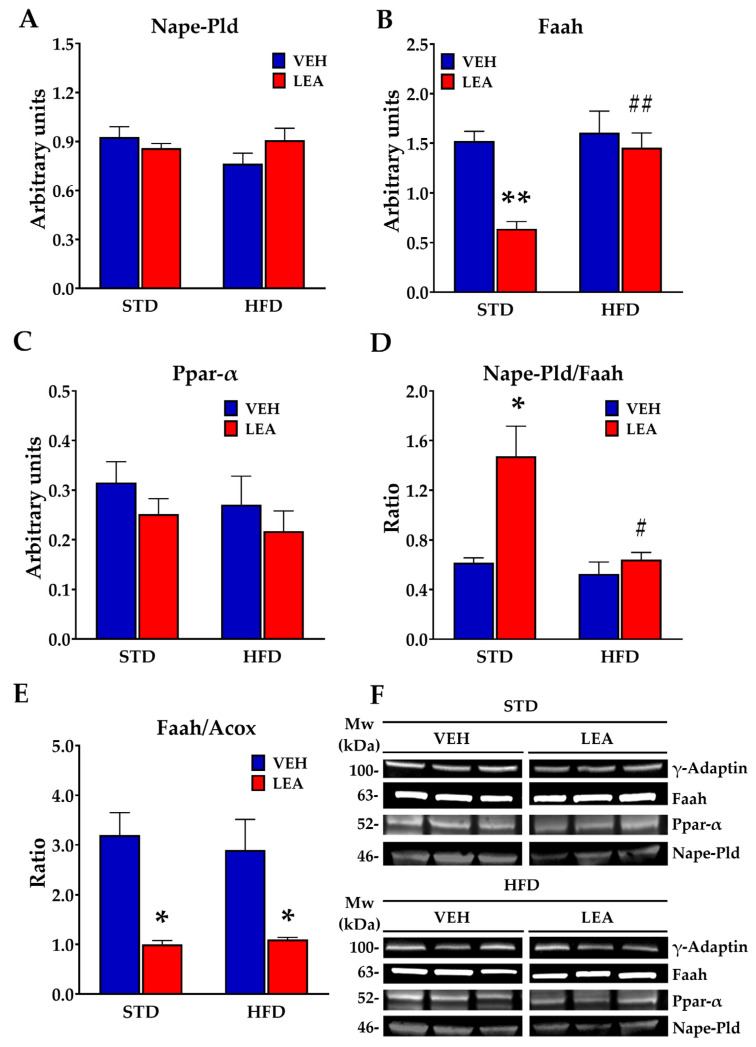
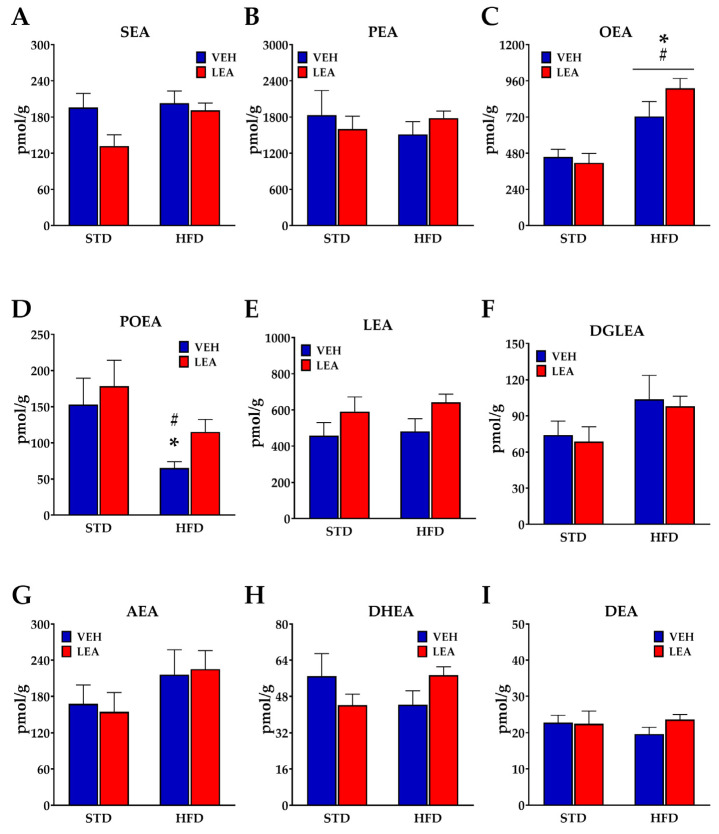
Acylethanolamides (NAEs) are bioactive lipids derived from diet fatty acids that modulate important homeostatic functions, including appetite, fatty acid synthesis, mitochondrial respiration, inflammation, and nociception. Among the naturally circulating NAEs, the pharmacology of those derived from either arachidonic acid (Anandamide), oleic acid (OEA), and palmitic acid (PEA) have been extensively characterized in diet-induced obesity. For the present work, we extended those studies to linoleoylethanolamide (LEA), one of the most abundant NAEs found not only in plasma and body tissues but also in foods such as cereals. In our initial study, circulating concentrations of LEA were found to be elevated in overweight humans (body mass index (BMI, Kg/m2) > 25) recruited from a representative population from the south of Spain, together with AEA and the endocannabinoid 2-Arachidonoyl glycerol (2-AG). In this population, LEA concentrations correlated with the circulating levels of cholesterol and triglycerides. In order to gain insight into the pharmacology of LEA, we administered it for 14 days (10 mg/kg i.p. daily) to obese male Sprague Dawley rats receiving a cafeteria diet or a standard chow diet for 12 consecutive weeks. LEA treatment resulted in weight loss and a reduction in circulating triglycerides, cholesterol, and inflammatory markers such as Il-6 and Tnf-alpha. In addition, LEA reduced plasma transaminases and enhanced acetyl-CoA-oxidase (Acox) and Uncoupling protein-2 (Ucp2) expression in the liver of the HFD-fed animals. Although the liver steatosis induced by the HFD was not reversed by LEA, the overall data suggest that LEA contributes to the homeostatic signals set in place in response to diet-induced obesity, potentially contributing with OEA to improve lipid metabolism after high fat intake. The anti-inflammatory response associated with its administration suggests its potential for use as a nutrient supplement in non-alcoholic steatohepatitis.

Keywords: acylethanolamides; high-fat diet; linoleic acid; linoleylethanolamide; liver steatosis; obesity.


Conflict of interest statement

The authors declare no conflict of interest. The funders had no role in the design of the study; in the collection, analyses, or interpretation of data; in the writing of the manuscript; or in the decision to publish the results.

Figures

Figure 1
Figure 1
(A,B); Plasma concentrations of NAEs in a representative Mediterranean population of Spain (city of Pizarra) stratified on the basis of their body mass index in lean (BMI < 25, N = 13) versus obese (BMI > 25, N = 34) subjects. (C) Plasma concentration of the acylglycerols 2-Arachidonoyl glycerol (2-AG) and 2-LG in the same population. Correlation of plasma LEA concentrations with that of (D) glucose, (E) cholesterol, and (F) triglycerides. Dashed lines correspond to confidence intervas * p < 0.05 versus BMI < 25 patients (ANOVA).
Figure 2
Figure 2
(A) Chemical structure of LEA and linoleic acid and the enzymes involved in their degradation (Faah) and synthesis (Nat, Nape-Pld). (B) Design of the study on the effects of LEA administration in eight male rats (N = 6–8 animals/group). (C,D) Daily effect of LEA treatment on weight gain in the animals of the two diets groups. (E,F) Cumulative weight gain after 15 days of treatment; * p < 0.05, ** p < 0.01, and *** p < 0.001 denote LEA versus VEH group (two-way ANOVA).
Figure 3
Figure 3
LEA treatment reversed the HFD-induced increase in the plasma concentration of Interleukin-6 (Il-6, A) and tumor necrosis factor alfa (Tnf-α, B). Data are presented as means ± standard error of the mean (N = 6–8 animals/group). * p < 0.05 different versus vehicle group; ## p < 0.01 and ### p < 0.01 different versus VEH-treated group of the same diet (two-way ANOVA).
Figure 4
Figure 4
LEA treatment did not reverse the liver steatosis associated with HFD exposure in male rats. (A) Fat content measured using oil red staining; (B) fat content measured using organic extraction; (C) oil red staining of a liver section from a STD–VEH-treated animal; (D) oil red staining of a liver section from a STD–LEA-treated animal; (E) oil red staining of a liver section from a HFD–VEH-treated animal; (F) oil red staining of a liver section from a HFD–LEA-treated animal. Data are presented as means ± standard error of the mean (N = 6–8 animals/group). ** p < 0.01 versus STD-fed animals treated with vehicle; ## p < 0.01 and ### p < 0.001 versus STD-fed animals treated with LEA (two-way ANOVA).
Figure 5
Figure 5
LEA treatment did not modify the alterations in the lipogenic pathway in the liver of male rats exposed to a HFD, but it did activate peroxisomal oxidation. (A) The HFD activated Acetyl-CoA-Carboxylase (Acc) by removing inhibitory phosphorylation; (B) neither HFD nor LEA modified fatty acid synthase (Fas); (C) exposure to the HFD increased the activity of the Stearoyl-CoA-desaturase 1 (Scd1) enzyme; (D) LEA treatment increased the expression of peroxisomal acyl-CoA-oxidase (Acox). (E) Representative blots immunostained for each of the proteins tested. Data are presented as means ± standard error of the mean (N = 6 animals/group). # p < 0.01 versus STD-fed animals treated with LEA (two-way ANOVA).
Figure 6
Figure 6
LEA treatment modified the expression of uncoupling proteins in the liver. (A) HFD exposure enhanced the expression of Uncopling protein 1 (Ucp1), while LEA treatment in STD-exposed animals reduced its expression; (B) LEA treatment in HFD-exposed animals increased the expression of Uncopling protein 2 (Ucp2). (C) Representative blots immunostained for each of the proteins tested. Data are presented as means ± standard error of the mean (N = 6 animals/group). * p < 0.05 versus STD-fed animals treated with vehicle; # p < 0.05, ## p < 0.01, and ### p < 0.001 versus STD-fed animals treated with LEA (two-way ANOVA).
Figure 7
Figure 7
Effects of HFD exposure and/or LEA treatment on NAE signaling machinery. (A) Neither HFD nor LEA modified the NAE-releasing enzyme N-acyl phosphatidylethanolamine-specific phospholipase D (Nape-Pld); (B) LEA treatment reduced the expression of Faah, the main NAE-degrading enzyme, in the STD-fed animals; (C) neither HFD nor LEA modified the NAE receptor Ppar-α; (D) treatment with LEA markedly enhanced the production/degradation ratio of NAEs in the STD-fed animals; (E) LEA treatment markedly reduced the Faah/Acox ratio in the liver of animals independently of the diet; (F) representative blots immunostained for each of the proteins tested. Data are presented as means ± standard error of the mean (N = 6 animals/group). * p < 0.05, ** p < 0.01 versus STD-fed animals treated with vehicle; # p < 0.05 and ## p < 0.01 versus STD-fed animals treated with LEA (two-way ANOVA).
Figure 8
Figure 8
Effects of either HFD exposure or LEA treatment on the content of NAEs in the liver of male rats. (A) Stearoylethanolamide, SEA; (B) palmitoylethanolamide, PEA; (C) oleoylethanolamide, OEA; (D) palmitoleoylethanolamide, POEA; (E) linoleoylethanolamide, LEA; (F) di-homo-γ- linolenylethanolamide, DGLEA; (G) arachidonoylethanolamide, AEA; (H) docosatetraenoylethanolamide, DEA and (I) docosahexaenoylethanolamide, DHEA. Data are presented as means ± standard error of the mean of the six to eight determinations per group (N = 6–8). * p < 0.05 versus STD-fed animals treated with vehicle; # p < 0.05 versus STD-fed animals treated with LEA (two-way ANOVA).

References

    1. de Fonseca F.R., DEL Arco I., Bermudez-Silva F.J., Bilbao A., Cippitelli A., Navarro M. The endocannabinoid system: Physiology and pharmacology. Alcohol. Alcohol. 2005;40:2–14. doi: 10.1093/alcalc/agh110. - DOI - PubMed
    1. Mock E.D., Gagestein B., van der Stelt M. Anandamide and other N-acylethanolamines: A class of signaling lipids with therapeutic opportunities. Prog. Lipid Res. 2023;89:101194. doi: 10.1016/j.plipres.2022.101194. - DOI - PubMed
    1. Schmid H., Berdyshev E. Cannabinoid receptor-inactive N -acylethanolamines and other fatty acid amides: Metabolism and function. Prostaglandins Leukot. Essent. Fat. Acids. 2002;66:363–376. doi: 10.1054/plef.2001.0348. - DOI - PubMed
    1. Hansen H.S. Role of anorectic N-acylethanolamines in intestinal physiology and satiety control with respect to dietary fat. Pharmacol. Res. 2014;86:18–25. doi: 10.1016/j.phrs.2014.03.006. - DOI - PubMed
    1. De Luca L., Ferracane R., Vitaglione P. Food database of N-acyl-phosphatidylethanolamines, N-acylethanolamines and endocannabinoids and daily intake from a Western, a Mediterranean and a vegetarian diet. Food Chem. 2019;300:125218. doi: 10.1016/j.foodchem.2019.125218. - DOI - PubMed