. 2023 Oct 23;15(20):4482.
doi: 10.3390/nu15204482.

Improvement of Locomotion Caused by Lactococcus lactis subsp. lactis in the Model Organism Caenorhabditis elegans

Affiliations

Improvement of Locomotion Caused by Lactococcus lactis subsp. lactis in the Model Organism Caenorhabditis elegans

Mohammad Shaokat Ali et al. Nutrients. .

Abstract

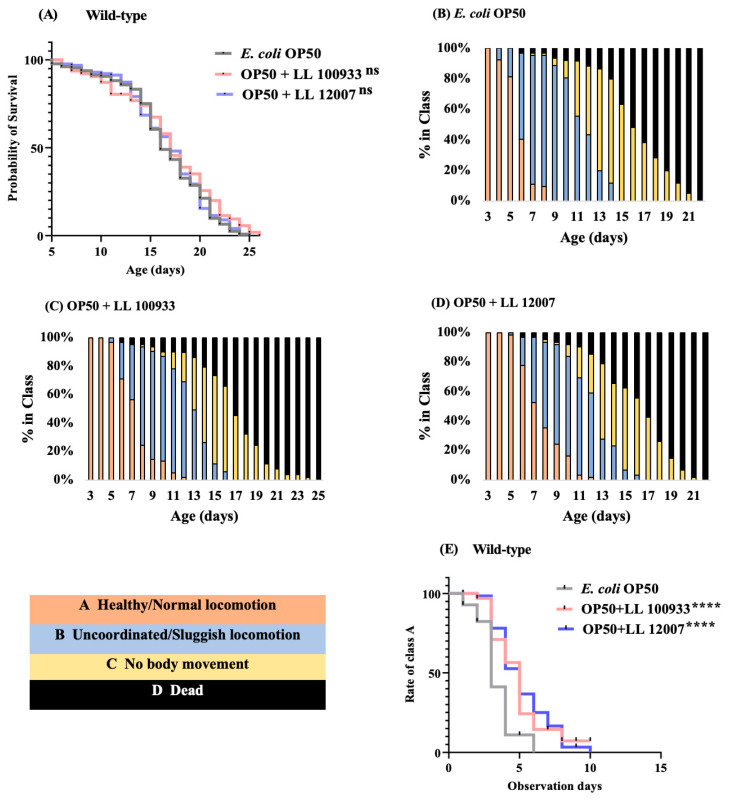
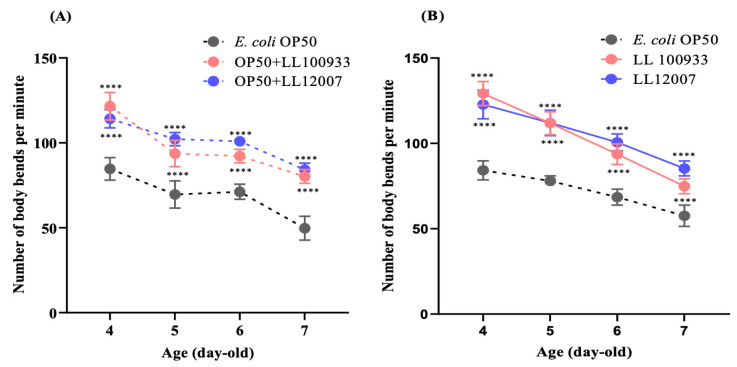
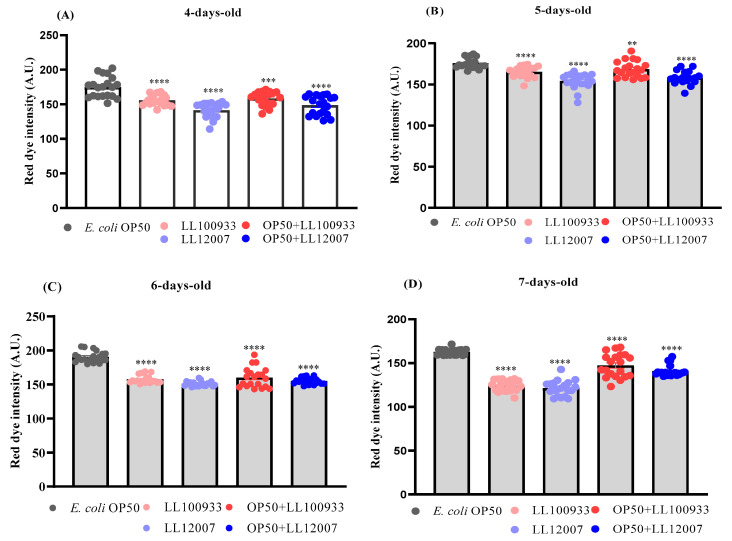
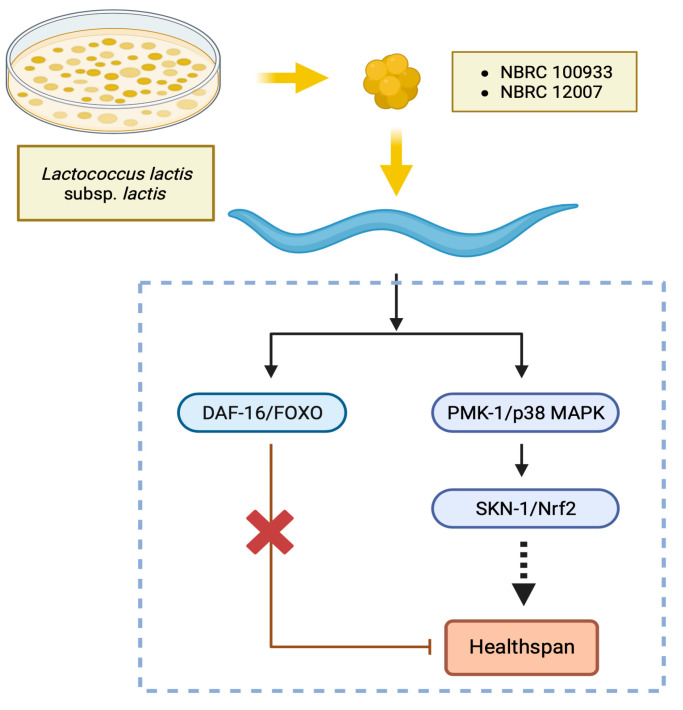
Lactococcus lactis subsp. lactis exhibits probiotic properties in humans. Considering that Caenorhabditis elegans can be used to study the effects of microorganisms on animal behavior, owing to its simple nervous system, we assessed the impacts of two strains of Lactococcus lactis subsp. Lactis-a non-nisin-producing strain, NBRC 100933 (LL100933), and a nisin-producing strain, NBRC 12007 (LL12007)-on the lifespan, locomotion, reproductive capacity of, and lipid accumulation in, C. elegans. The lifespan of adult C. elegans fed a mixture (1:1) of Escherichia coli OP50 and LL100933 or LL12007 did not show a significant increase compared to that of the group fed a standard diet of E. coli OP50. However, the nematodes fed Lactococcus strains showed notable enhancement in their locomotion at all of the tested ages. Further, the beneficial effects of LL100933 and LL12007 were observed in the daf-16 mutants, but not in the skn-1 and pmk-1 mutants. The lipid accumulation in the worms of the Lactococcus-fed group was lower than that in the control group at all experimental ages. Overall, LL100933 and LL12007 enhance the locomotor behavior of C. elegans, likely by modulating the PMK-1/p38 MAPK and SKN-1/Nrf2 transcription factors.

Keywords: Caenorhabditis elegans; Lactococcus; locomotion; nisin.


Conflict of interest statement

The authors declare no conflict of interest.

Figures

Figure 1
Figure 1
Lifespan assay of C. elegans with Lactococcus lactis subsp. lactis NBRC 100933 (LL 100933) and NBRC 12007 (LL 12007). (A) Survival curves of OP50 + LL 100933-fed and OP50 + LL 12007-fed wild-type C. elegans compared with those of the E. coli OP50-fed control worms. Age 0 nominal days was used to designate young adults. ns = Not significant, p > 0.05 vs. the control-fed worms. Asterisks indicate statistically significant differences (****, p < 0.0001) compared to the control worms fed E. coli OP50 using the log-rank (Mantel–Cox) test. Supplementary lifespan data and analysis are provided in supplementary Table S10. Age-related locomotor activity of C. elegans (wild type). (BD) show the locomotory scoring scheme for worms fed OP50, OP50 + LL 10093, and OP50 + LL 12007. Worms were categorized into four classes as follows: Class A, Healthy/Normal locomotion (pink bars); Class B, Uncoordinated/Sluggish locomotion (blue bars); Class C, No body movement but head movement in response to prodding (yellow bars); and Class D, Dead worms (black bars). (E) Health span curves of wild type (N2) C. elegans fed OP50 + LL 100933 and OP50 + LL 12007 compared with those of OP50-fed control worms.
Figure 2
Figure 2
Body bending frequency (bends/minute) of (A) mixed-fed (OP50 + LL100933 and OP50 + LL12007) and (B) sole-fed (LL100933 and LL12007) worms compared with that of control-fed (OP50) worms. Worms fed with mixed and sole cultures of test strains had a significantly (p ≤ 0.0001) higher body bending frequency compared with that of control-fed worms. All data are expressed as means ± standard error. Asterisks (****, p ≤ 0.0001) indicate statistically significant differences compared to those of the control-fed group. Two-factor factorial ANOVA and Tukey’s multiple comparison tests were used to analyze the data where n = 20 worms.
Figure 3
Figure 3
(A) Locomotion score of class A in mutants daf-16 (mu86); (B) skn-1 (ok2315); and (C) pmk-1 (km25) fed with OP50 + LL 100933 and OP50 + LL 12007 compared with that of the control (OP50)-fed worms. Using the log-rank (Mante-Cox) test, the percentages of the frequency of Class A worms were examined. Asterisks (****, p < 0.0001; **, p ≤ 0.005; and *, p ≤ 0.05) indicate statistically significant differences between the test and control groups.
Figure 4
Figure 4
Growth of (A) control-fed (OP50) and mixed-fed (OP50 + LL100933 and OP50 + LL12007) and (B) control-fed (OP50) and sole test-fed (LL 100933 or LL 12007) worms from 4 to 7 days of age. All results are expressed as means ± standard error. On all observed days, the sole test-fed worms (LL 100933 or LL 12007) showed significantly decreased body size compared to that of control (OP50) fed worms. Asterisks indicate (****, p < 0.0001); **, p < 0.01) statistically significant differences between test-fed and control-fed groups. Two-factor factorial ANOVA and Tukey’s multiple comparison tests were used to analyze the data where n = 20 worms.
Figure 5
Figure 5
Comparative investigation of brood size among C. elegans N2. (A) Worms fed with OP50 + LL100933 (n = 20), and OP50 + LL12007 (n = 20) compared with OP50-fed (control) worms (n = 20). (B) LL100933-fed (n = 20) and LL12007-fed worms (n = 20) compared with control (OP50-fed) worms. Asterisks indicate statistically significant differences (*, p ≤ 0.05; ***, p ≤ 0.0004; ****, p < 0.0001) from the control (OP50-fed) worms. Data are shown as means ± standard error. Statistical analysis was carried out using the Mann-Whitney U test.
Figure 6
Figure 6
Quantification of red dye intensity in the (A) 4-day-old (n = 20); (B) 5-day-old (n = 20); (C) 6-day-old; and (D) 7-day-old worms using Oil red O staining based on the projection area of the worm body. Worms of the mixed-fed and sole-fed groups showed statistically lower lipid accumulation (lower red dye intensity) inside the body compared with that in control-fed worms. Error bars represent the standard errors. Asterisks indicate statistically significant differences (**, p ≤ 0.005; ***, p ≤ 0.0005; ****, p ≤ 0.0001) from the control worms (OP50-fed) using Student’s t-test.
Figure 7
Figure 7
Microscopic illustration to measure the red dye intensity in control-fed (OP50), mixed-fed (OP50 + LL100933 or OP50 + LL12007), and sole-fed (LL100933 or LL12007) worms. The higher dye intensity indicates higher lipid accumulation in the worms. ImageJ software was used to measure the red dye intensity absorbed by the worm’s body. The scale bar indicates 100 μm. Magnification, ×10.
Figure 8
Figure 8
Bacterial choice assay of C. elegans N2. Figures (A) illustrates the bacterial choices of worms fed E. coli OP50 (B,C), OP50 + LL100933 (D), and OP50 + LL 12007 (E). Young adult (day 1) worms were fed OP50, OP50 + LL 100933, and OP50 + LL 12007 for 2 consecutive days; Day 3 aged worms were assayed for bacterial choice using the control feed (OP50) and test feed (OP50 + LL 100933 or OP50 + LL 12007) on mNGM plates (5 cm). The percentage of worms (means ± standard error) moving to the specified bacterial lawns was investigated at different time intervals (1 h and 2 h). No choice, the percentage of worms outside the bacterial lawns. Asterisks indicate statistically significant differences (*, p ≤ 0.05) among the worms. Three independent replicates were used for this assay and the data were analyzed using Student’s t-test.
Figure 9
Figure 9
Analysis of relative mRNA expression in OP50 + LL100933-fed and OP50 + LL 12007-fed worms compared with that in control (OP50-fed) worms using real-time PCR. The figure indicates the different upregulated mRNA expressions (means ± SEM) and asterisks indicate statistically significant differences between the control (OP50-fed) and test (OP50 + LL100933-fed or OP50 + LL12007-fed) groups; *, p ≤ 0.05; **, p ≤ 0.005. Student’s t-test was used to measure statistical differences and three (n = 3) biological replicates were used.
Figure 10
Figure 10
The expected mechanism for improving health span with LL100933 and LL12007 is believed to involve the enhancement of locomotor activity in C. elegans. This enhancement is likely achieved through modulation of the PMK-1/p38 MAPK and SKN-1/Nrf2 transcription factors, whereas DAF-16 does not seem to play a role in enhancing the motion capability of C. elegans when exposed to LL.

References

    1. Deng Z., Hou K., Zhao J., Wang H. The Probiotic Properties of Lactic Acid Bacteria and Their Applications in Animal Husbandry. Curr. Microbiol. 2022;79:22. doi: 10.1007/s00284-021-02722-3. - DOI - PubMed
    1. Sanders M.E. Probiotics: Definition, Sources, Selection, and Uses. Clin. Infect. Dis. 2008;46:S58–S61. doi: 10.1086/523341. - DOI - PubMed
    1. Li T.T., Tian W.L., Gu C.T. Elevation of Lactococcus lactis subsp. cremoris to the Species Level as Lactococcus cremoris sp. nov. and Transfer of Lactococcus lactis subsp. tructae to Lactococcus cremoris as Lactococcus cremoris subsp. tructae comb. nov. Int. J. Syst. Evol. Microbiol. 2019;71:004727. doi: 10.1099/ijsem.0.004727. - DOI - PubMed
    1. Jung M.Y., Lee C., Seo M.-J., Roh S.W., Lee S.H. Characterization of a Potential Probiotic Bacterium Lactococcus Raffinolactis WiKim0068 Isolated from Fermented Vegetable Using Genomic and in Vitro Analyses. BMC Microbiol. 2020;20:136. doi: 10.1186/s12866-020-01820-9. - DOI - PMC - PubMed
    1. Belo G.A., Cordeiro B.F., Oliveira E.R., Braga M.P., Da Silva S.H., Costa B.G., Martins F.D.S., Jan G., Le Loir Y., Gala-García A., et al. SlpB Protein Enhances the Probiotic Potential of L. Lactis NCDO 2118 in Colitis Mice Model. Front. Pharmacol. 2021;12:755825. doi: 10.3389/fphar.2021.755825. - DOI - PMC - PubMed