

Cerebrospinal Fluid Proteomic Changes after Nusinersen in Patients with Spinal Muscular Atrophy
- PMID: 37892834
- PMCID: PMC10607664
- DOI: 10.3390/jcm12206696
Cerebrospinal Fluid Proteomic Changes after Nusinersen in Patients with Spinal Muscular Atrophy
Abstract
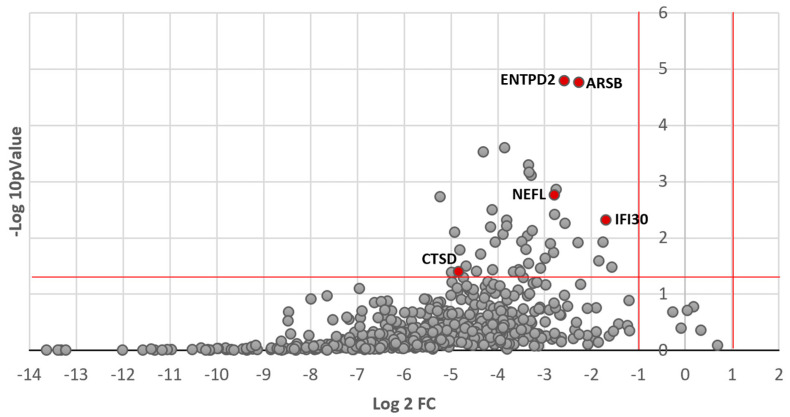
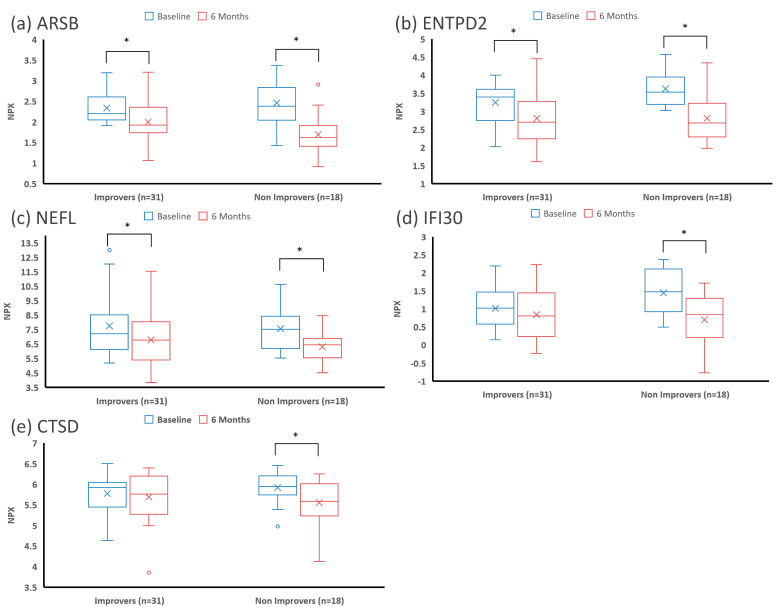
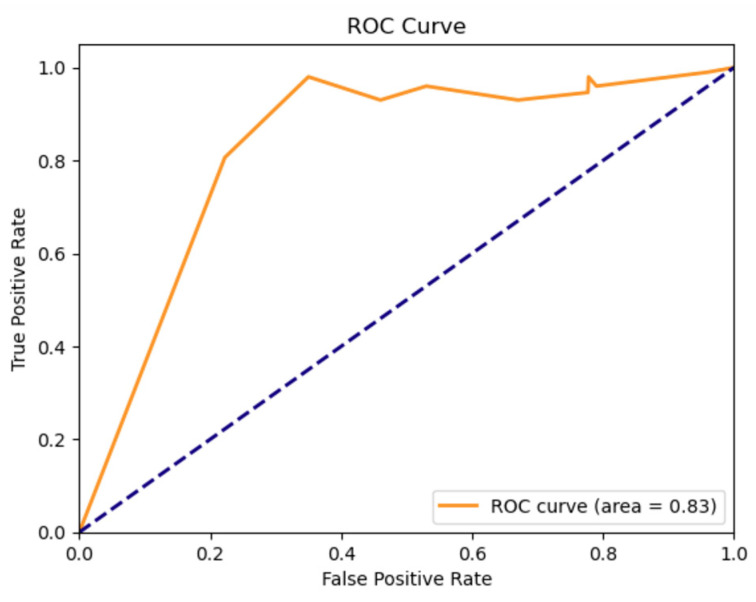
Disease-modifying treatments have transformed the natural history of spinal muscular atrophy (SMA), but the cellular pathways altered by SMN restoration remain undefined and biomarkers cannot yet precisely predict treatment response. We performed an exploratory cerebrospinal fluid (CSF) proteomic study in a diverse sample of SMA patients treated with nusinersen to elucidate therapeutic pathways and identify predictors of motor improvement. Proteomic analyses were performed on CSF samples collected before treatment (T0) and at 6 months (T6) using an Olink panel to quantify 1113 peptides. A supervised machine learning approach was used to identify proteins that discriminated patients who improved functionally from those who did not after 2 years of treatment. A total of 49 SMA patients were included (10 type 1, 18 type 2, and 21 type 3), ranging in age from 3 months to 65 years. Most proteins showed a decrease in CSF concentration at T6. The machine learning algorithm identified ARSB, ENTPD2, NEFL, and IFI30 as the proteins most predictive of improvement. The machine learning model was able to predict motor improvement at 2 years with 79.6% accuracy. The results highlight the potential application of CSF biomarkers to predict motor improvement following SMA treatment. Validation in larger datasets is needed.
Keywords: biomarkers; neurofilament; nusinersen; proteomics; spinal muscular atrophy; treatment.
Conflict of interest statement
M.B., T.K., W.T., K.H. and D.P.: no conflict of interest to declare. S.D.Y.: advisory boards for Biogen, Roche/Genentech, and Scholar Rock; consultant to Biogen, Cure SMA, and Scholar Rock; and research funding from Cure SMA. C.T.R.: advisory board, contracted research, and honoraria for educational lectures organized by Biogen. T.D.: advisory board, CuresSMA, DuchenneUK, Actigraph, Biogen, Scholar Rock, Roche, Novartis, Dyne, consultancy/speaker: Sarepta, Pfizer, Roche, Genentech, Trinds, NMDPharma, and Novartis. J.W.D.: advisory board, Muscular Dystrophy Association, Myotonic Dystrophy Foundation, Foundation Building Strength for Nemaline Myopathy, Cure Congenital Muscular Dystrophy, and Pepgen; consulting: Avidity, Biogen, and Novartis Gene Therapies, Roche/Genentech, Sarepta Therapeutics, Scholar Rock, and Vertex; contracted research: AMO Pharmaceuticals, Astellas, Avidity, Biogen, Ionis Pharmaceuticals, Novartis Gene Therapies, Roche Pharmaceuticals, Sanofi-Genzyme, Sarepta Therapeutics, and Scholar Rock.
Figures
References
-
- Abiusi E., Vaisfeld A., Fiori S., Novelli A., Spartano S., Faggiano M.V., Giovanniello T., Angeloni A., Vento G., Santoloci R., et al. Experience of a 2-year spinal muscular atrophy NBS pilot study in Italy: Towards specific guidelines and standard operating procedures for the molecular diagnosis. J. Med. Genet. 2023;60:697–705. doi: 10.1136/jmg-2022-108873. - DOI - PubMed
-
- Lee B.H., Deng S., Chiriboga C.A., Kay D.M., Irumudomon O., Laureta E., Delfiner L., Treidler S.O., Anziska Y., Sakonju A., et al. Newborn Screening for Spinal Muscular Atrophy in New York State: Clinical Outcomes From the First 3 Years. Neurology. 2022;99:e1527–e1537. doi: 10.1212/WNL.0000000000200986. - DOI - PMC - PubMed
-
- Wang J., Bai J., OuYang S., Wang H., Jin Y., Peng X., Ge X., Jiao H., Zou J., He C., et al. Antisense oligonucleotides targeting the SMN2 promoter region enhance SMN2 expression in spinal muscular atrophy cell lines and mouse model. Hum. Mol. Genet. 2022;31:1635–1650. doi: 10.1093/hmg/ddab350. - DOI - PubMed
Grants and funding
LinkOut - more resources
Full Text Sources
Miscellaneous
