. 2023 Oct 8;11(10):2728.
doi: 10.3390/biomedicines11102728.

Analysis of Leukocyte Subpopulations by Flow Cytometry during Hospitalization Depending on the Severity of COVID-19 Course

Affiliations

Analysis of Leukocyte Subpopulations by Flow Cytometry during Hospitalization Depending on the Severity of COVID-19 Course

Elżbieta Rutkowska et al. Biomedicines. .

Abstract

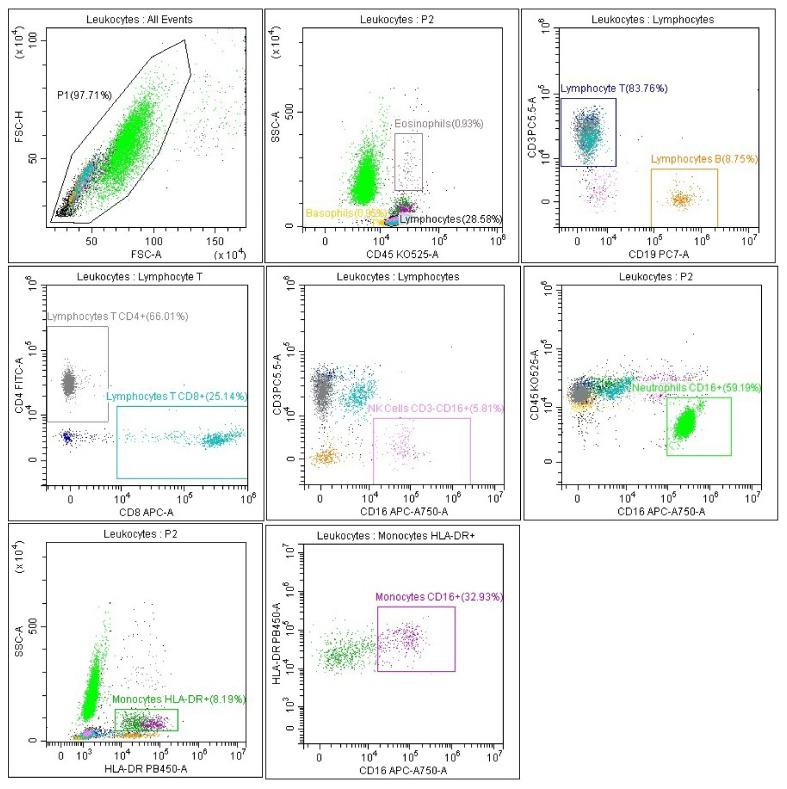
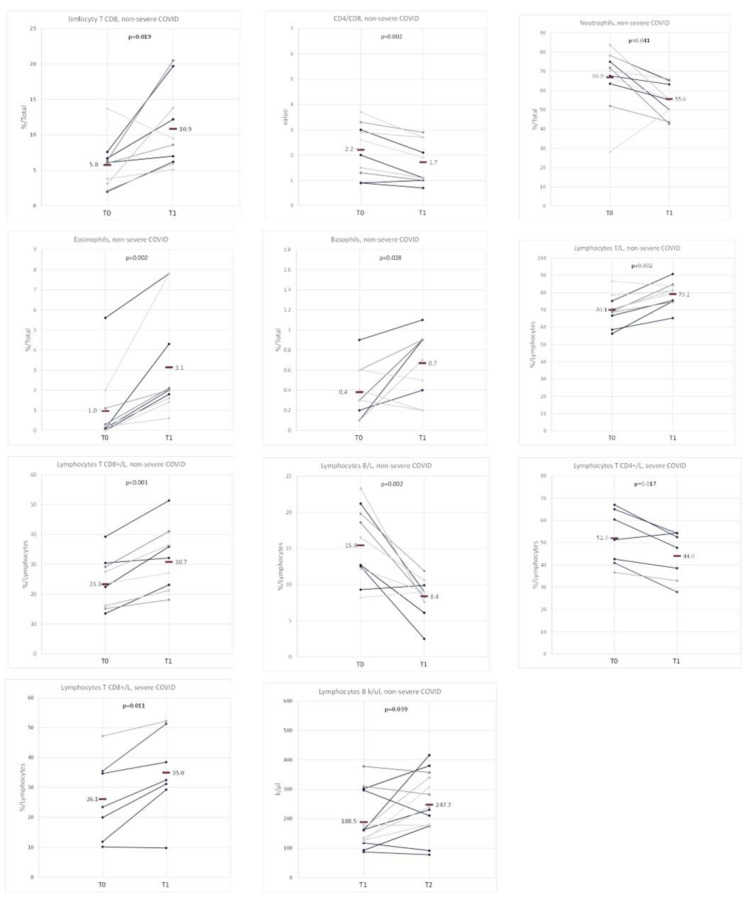
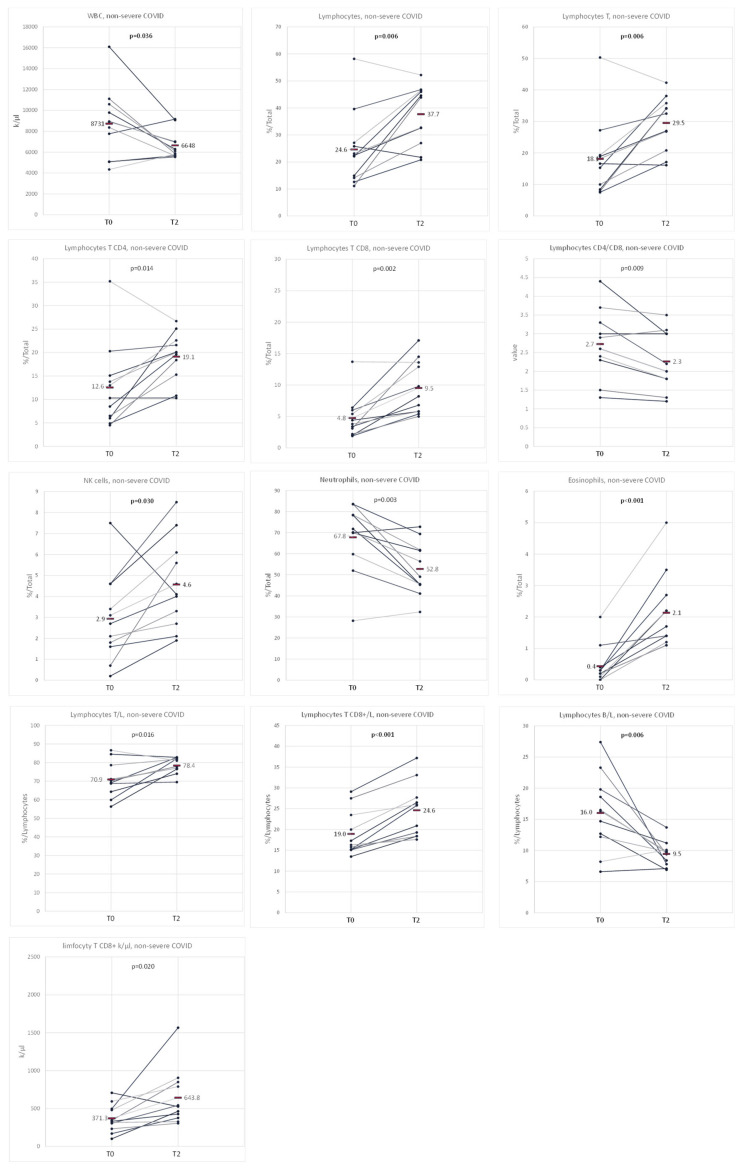
The mechanisms underlying the immune response to coronavirus disease 2019 (COVID-19) and the recovery process have not been fully elucidated. The aim of the study was to analyze leukocyte subpopulations in patients at significant time points (at diagnosis, and 3 and 6 months after infection) selected according to the analysis of changes in the lungs by the CT classification system, considering the severity of the disease. The study groups consisted of severe and non-severe COVID-19 patients. There was a significant decrease in CD8+ T cells, NK and eosinophils, with an increasing percentage of neutrophils during hospitalization. We noticed lower levels of CD4 and CD8 T lymphocytes, eosinophils, basophils, and CD16+ monocytes and elevated neutrophil levels in severe patients relative to non-severe patients. Three months after infection, we observed higher levels of basophils, and after 6 months, higher CD4/CD8 ratios and T cell levels in the severe compared to non-severe group. Non-severe patients showed significant changes in the leukocyte populations studied at time of hospitalization and both within 3 months and 6 months of onset. The CT CSS classification with parameters of the flow cytometry method used for COVID-19 patients determined changes that proved useful in the initial evaluation of patients.

Keywords: B lymphocytes; SARS-CoV-2 infection; T lymphocytes; flow cytometry; leukocytes; lymphocytes; neutrophils.


Conflict of interest statement

The authors declare no conflict of interest.

Figures

Figure 1
Figure 1
Representative flow cytometry analysis of PB cells with antibodies specific for leukocyte subpopulations. Lymphocyte gating strategy: FSC-A vs. FSC-H plot: For removing clumps and debris, the cells with an equal area and height were gated (greater FSC-A relative to FSC-H) and (very low FSC), CD45 vs. SSC-A plot: Indication of lymphocytes based on their SSC/CD45+ characteristics. Gating strategy for lymphocyte subpopulation: CD3 vs. CD19 plot: T lymphocytes (turquoise and gray) with CD3+ antigen expression and B lymphocytes (yellow) with CD19+ antigen expression. CD4 vs. CD8 plot: T lymphocyte subsets: CD4+ (gray) and CD8+ (turquoise) based on their CD4/CD8 expression. CD3 vs. CD16 plot: NK cells (pink) with CD16+ antigen expression and no expression of CD3 antigen. Neutrophil gating strategy: CD45 vs. CD16 plot: Selection of neutrophils (green) based on their CD16+ high properties and CD45 positive. Monocyte gating strategy: SSC-A vs. HLA-DR plot: Selection of monocytes (dark green) based on their CD45+ high and HLA-DR+ properties. Monocytes with CD16+ expression gating strategy: HLA-DR vs. CD16 plot from the monocyte field: monocytes with CD16+ expression (purple).
Figure 2
Figure 2
Change in TK CSS intensity between time of hospitalization (T0) and visit 3 months after hospitalization (T1) and visit 6 months after hospitalization (T2).
Figure 3
Figure 3
Comparison of cytometry results at different time points of hospitalization and follow-up (T0–T1 and T1–T2) and the severity of the disease (non-severe and severe). The graphs show those variables for which a statistically significant difference was obtained between the distinguished measurements in any of the groups: in the population of patients without severe COVID-19 and the population of patients with severe COVID-19. The average values are marked with a horizontal line.
Figure 4
Figure 4
Comparison of cytometry results at different time points of hospitalization and follow-up (T0–T2) and non-severe course of COVID-19. The graphs show those variables for which a statistically significant difference was obtained between the distinguished measurements in the population of patients with a non-severe COVID-19 course. The average values are marked with a horizontal line.

Similar articles

Cited by

References

    1. Ramsey N., Obeidallah M., Abraham A. Impact of COVID-19 on adolescent health and use of social media. Curr. Opin. Pediatr. 2023;35:362–367. doi: 10.1097/MOP.0000000000001248. - DOI - PMC - PubMed
    1. Moreno C., Wykes T., Galderisi S., Nordentoft M., Crossley N., Jones N., Cannon M., Correll C.U., Byrne L., Carr S., et al. How mental health care should change as a consequence of the COVID-19 pandemic. Lancet Psychiatry. 2020;7:813–824. doi: 10.1016/S2215-0366(20)30307-2. - DOI - PMC - PubMed
    1. Ejaz H., Alsrhani A., Zafar A., Javed H., Junaid K., Abdalla A.E., Abosalif K.O.A., Ahmed Z., Younas S. COVID-19 and comorbidities: Deleterious impact on infected patients. J. Infect. Public Health. 2020;13:1833–1839. doi: 10.1016/j.jiph.2020.07.014. - DOI - PMC - PubMed
    1. Clementi N., Ghosh S., De Santis M., Castelli M., Criscuolo E., Zanoni I., Clementi M., Mancini N. Viral Respiratory Pathogens and Lung Injury. Clin. Microbiol. Rev. 2021;34 doi: 10.1128/CMR.00103-20. - DOI - PMC - PubMed
    1. Rutkowska E., Kwiecien I., Zabicka M., Maliborski A., Raniszewska A., Klos K., Urbanska W., Klajnowicz I., Rzepecki P., Chcialowski A. Cytokines and Leukocytes Subpopulations Profile in SARS-CoV-2 Patients Depending on the CT Score Severity. Viruses. 2021;13:880. doi: 10.3390/v13050880. - DOI - PMC - PubMed