. 2023 Oct 12;13(20):3184.
doi: 10.3390/ani13203184.

Multi-Omic, Histopathologic, and Clinicopathologic Effects of Once-Weekly Oral Rapamycin in a Naturally Occurring Feline Model of Hypertrophic Cardiomyopathy: A Pilot Study

Affiliations

Multi-Omic, Histopathologic, and Clinicopathologic Effects of Once-Weekly Oral Rapamycin in a Naturally Occurring Feline Model of Hypertrophic Cardiomyopathy: A Pilot Study

Victor N Rivas et al. Animals (Basel). .

Abstract

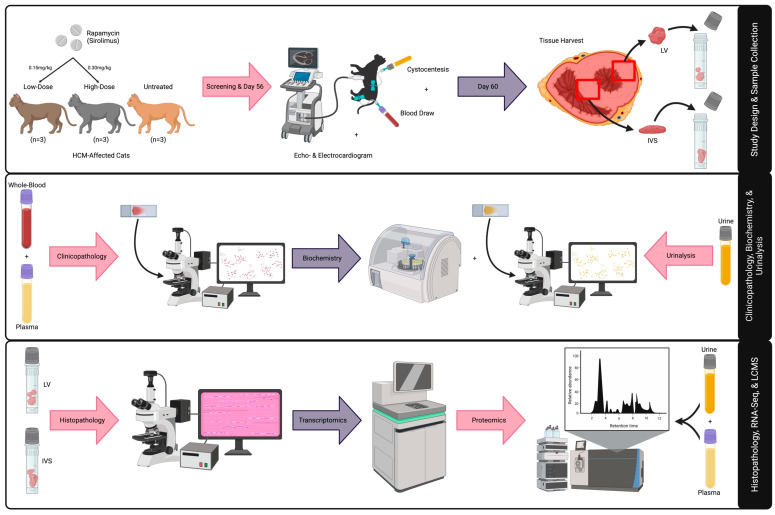
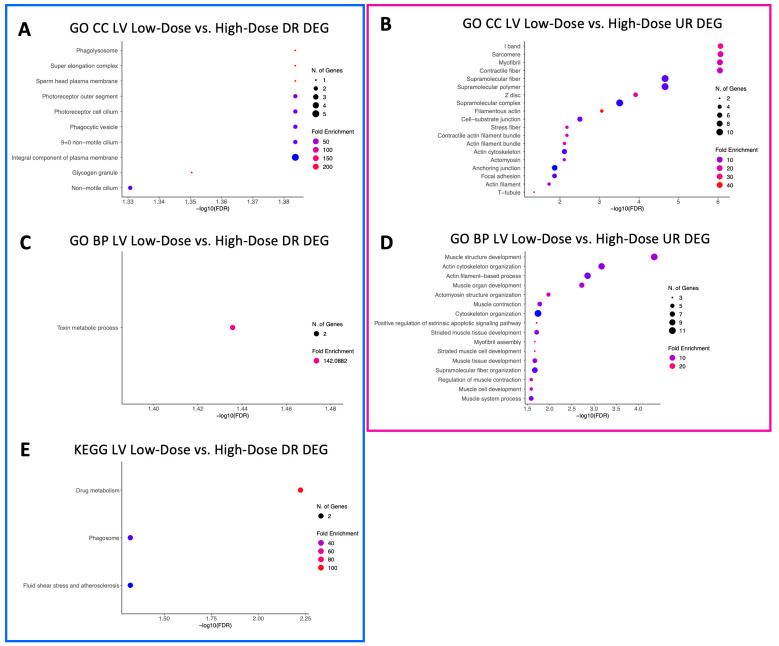
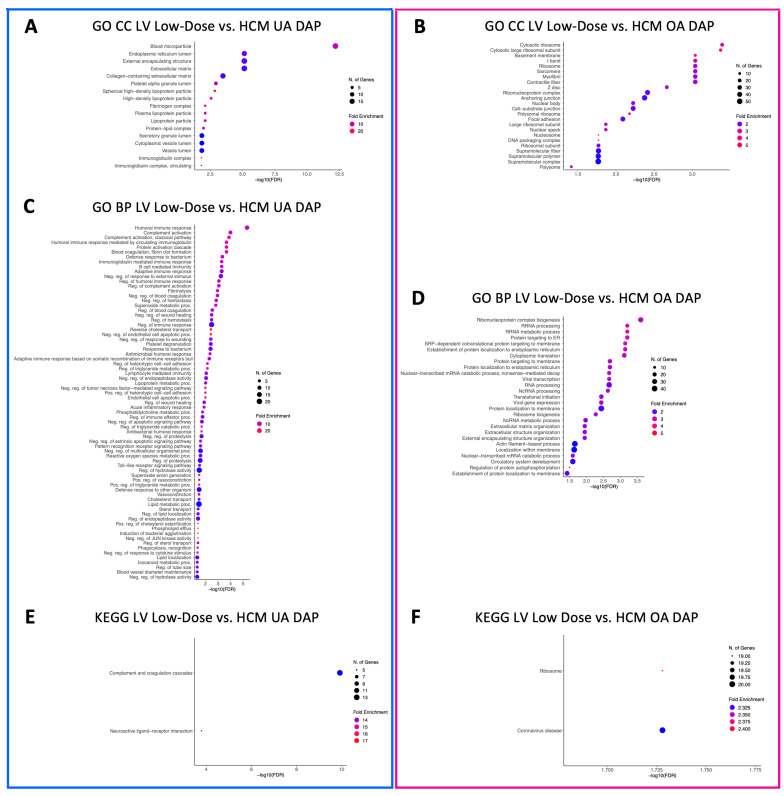
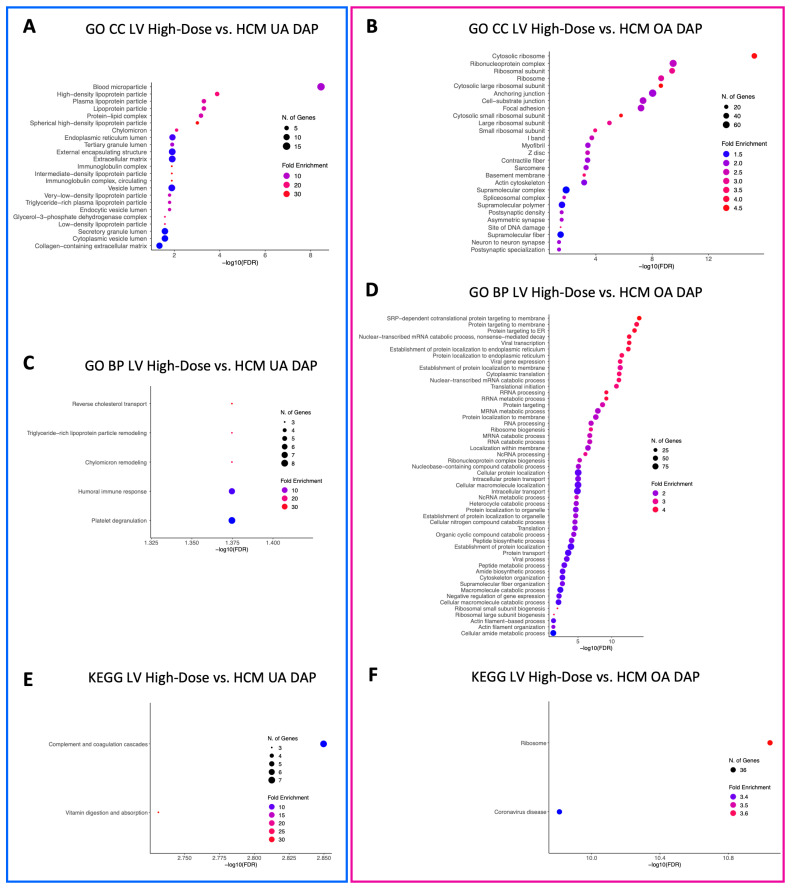
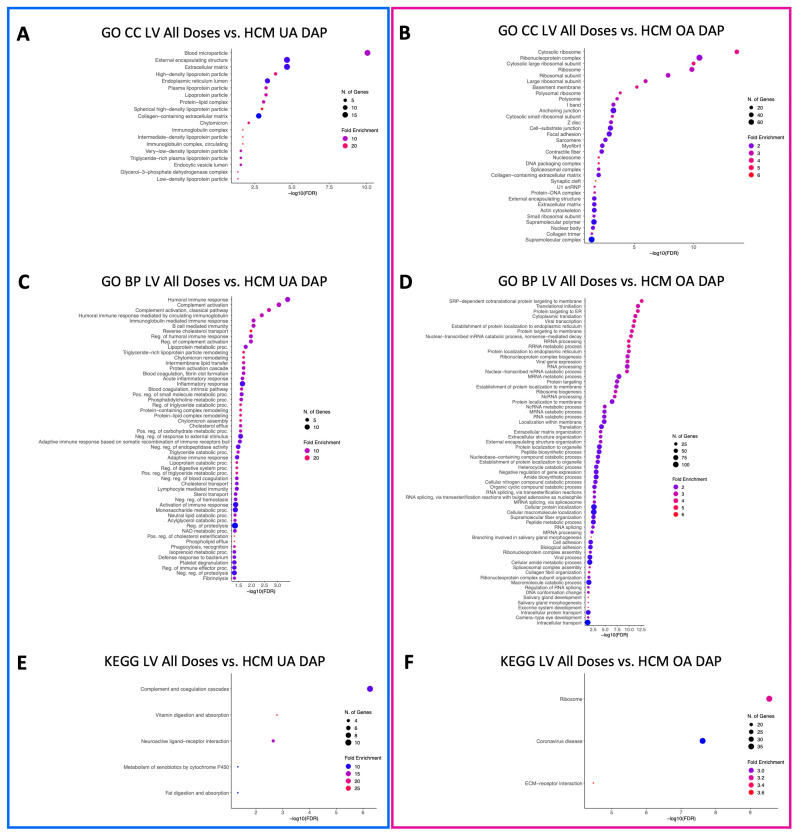
Hypertrophic cardiomyopathy (HCM) remains the single most common cardiomyopathy in cats, with a staggering prevalence as high as 15%. To date, little to no direct therapeutical intervention for HCM exists for veterinary patients. A previous study aimed to evaluate the effects of delayed-release (DR) rapamycin dosing in a client-owned population of subclinical, non-obstructive, HCM-affected cats and reported that the drug was well tolerated and resulted in beneficial LV remodeling. However, the precise effects of rapamycin in the hypertrophied myocardium remain unknown. Using a feline research colony with naturally occurring hereditary HCM (n = 9), we embarked on the first-ever pilot study to examine the tissue-, urine-, and plasma-level proteomic and tissue-level transcriptomic effects of an intermittent low dose (0.15 mg/kg) and high dose (0.30 mg/kg) of DR oral rapamycin once weekly. Rapamycin remained safe and well tolerated in cats receiving both doses for eight weeks. Following repeated weekly dosing, transcriptomic differences between the low- and high-dose groups support dose-responsive suppressive effects on myocardial hypertrophy and stimulatory effects on autophagy. Differences in the myocardial proteome between treated and control cats suggest potential anti-coagulant/-thrombotic, cellular remodeling, and metabolic effects of the drug. The results of this study closely recapitulate what is observed in the human literature, and the use of rapamycin in the clinical setting as the first therapeutic agent with disease-modifying effects on HCM remains promising. The results of this study establish the need for future validation efforts that investigate the fine-scale relationship between rapamycin treatment and the most compelling gene expression and protein abundance differences reported here.

Keywords: autophagy; cat; large animal model; mTOR (mammalian/mechanistic target of rapamycin); proteomics (LCMS); sirolimus; transcriptomics (RNA sequencing); translational.


Conflict of interest statement

S.A.K., S.F., A.F. and L.G. are employees of TriviumVet (Waterford, Ireland), which served as the sponsor of this research. J.A.S. is a member of the scientific advisory for TriviumVet.

Figures

Figure 1
Figure 1
Graphic summary of study design and methods. An illustrative representation of study design and multi-omic techniques for LV, IVS, blood, and urine specimens is provided. Abbreviations: HCM = hypertrophic cardiomyopathy, LV = left ventricle, IVS = interventricular septum, LCMS = liquid chromatography mass spectrometry.
Figure 2
Figure 2
Enriched terms for LV DEGs in the low-dose vs. HCM comparison. Enrichment plots for GO CC (A,B), GO BP (C,D), and KEGG pathway (E,F) term analyses are presented for down- (blue box) and upregulated (pink box) DEGs. The y-axis depicts identified enriched terms, whereas the x-axis depicts the terms’ significance (−log10[FDR]). The terms are sorted according to statistical significance; the top-most terms on the y-axis constitute the most statistically significant terms. The size of individual points depicts the total number of genes binned to a given enriched term; high or low fold enrichment is represented by red or blue coloring, respectively. Abbreviations: HCM = hypertrophic cardiomyopathy, LV = left ventricle, GO = gene ontology, CC = cellular components, BP = biological processes, UR = upregulated, DR = downregulated, DEG = differentially expressed gene(s).
Figure 3
Figure 3
Enriched terms for LV DEGs in the high-dose vs. HCM comparison. Enrichment plots for GO CC (A), GO BP (B,C), and KEGG pathway (D) term analyses are presented for down- (blue box) and upregulated (pink box) DEGs. The y-axis depicts identified enriched terms, whereas the x-axis depicts the terms’ significance (−log10[FDR]). The terms are sorted according to statistical significance; the top-most terms on the y-axis constitute the most statistically significant of terms. The size of individual points depicts the total number of genes binned to a given enriched term; high or low fold enrichment is represented by red or blue coloring, respectively. Abbreviations: HCM = hypertrophic cardiomyopathy, LV = left ventricle, GO = gene ontology, CC = cellular components, BP = biological processes, UR = upregulated, DR = downregulated, DEG = differentially expressed gene(s).
Figure 4
Figure 4
Enriched terms for upregulated LV DEGs in the pooled doses vs. HCM comparison. Enrichment plots for GO CC (A) and GO BP (B) term analyses are presented for upregulated (pink box) DEGs. The y-axis depicts identified enriched terms, whereas the x-axis depicts the terms’ significance (−log10[FDR]). The terms are sorted according to statistical significance; the top-most terms on the y-axis constitute the most statistically significant of terms. The size of individual points depicts the total number of genes binned to a given enriched term; high or low fold enrichment is represented by red or blue coloring, respectively. Abbreviations: HCM = hypertrophic cardiomyopathy, LV = left ventricle, GO = gene ontology, CC = cellular components, BP = biological processes, UR = upregulated, DEG = differentially expressed gene(s).
Figure 5
Figure 5
Enriched terms for LV DEGs in the low- vs. high-dose comparison. Enrichment plots for GO CC (A,B), GO BP (C,D), and KEGG pathway (E) term analyses are presented for down- (blue box) and upregulated (pink box) DEGs. The y-axis depicts identified enriched terms, whereas the x-axis depicts the terms’ significance (−log10[FDR]). The terms are sorted according to statistical significance; the top-most terms on the y-axis constitute the most statistically significant of terms. The size of individual points depicts the total number of genes binned to a given enriched term; high or low fold enrichment is represented by red or blue coloring, respectively. Abbreviations: HCM = hypertrophic cardiomyopathy, LV = left ventricle, GO = gene ontology, CC = cellular components, BP = biological processes, UR = upregulated, DR = downregulated, DEG = differentially expressed gene(s).
Figure 6
Figure 6
Enriched terms for LV DAPs in the low-dose vs. HCM comparison. Enrichment plots for GO CC (A,B), GO BP (C,D), and KEGG pathway (E,F) term analyses are presented for under- (blue box) and overabundant (pink box) DAPs. The y-axis depicts identified enriched terms, whereas the x-axis depicts the terms’ significance (−log10[FDR]). The terms are sorted according to statistical significance; the top-most terms on the y-axis constitute the most statistically significant of terms. The size of individual points depicts the total number of proteins binned to a given enriched term; high or low fold enrichment is represented by red or blue coloring, respectively. Abbreviations: HCM = hypertrophic cardiomyopathy, LV = left ventricle, GO = gene ontology, CC = cellular components, BP = biological processes, UA = underabundant, OA = overabundant, DAP = differentially abundant peptide(s).
Figure 7
Figure 7
Enriched terms for LV DAPs in the high-dose vs. HCM comparison. Enrichment plots for GO CC (A,B), GO BP (C,D), and KEGG pathway (E,F) term analyses are presented for under- (blue box) and overabundant (pink box) DAPs. The y-axis depicts identified enriched terms, whereas the x-axis depicts the terms’ significance (−log10[FDR]). The terms are sorted according to statistical significance; the top-most terms on the y-axis constitute the most statistically significant of terms. The size of individual points depicts the total number of proteins binned to a given enriched term; high or low fold enrichment is represented by red or blue coloring, respectively. Abbreviations: HCM = hypertrophic cardiomyopathy, LV = left ventricle, GO = gene ontology, CC = cellular components, BP = biological processes, UA = underabundant, OA = overabundant, DAP = differentially abundant peptide(s).
Figure 8
Figure 8
Enriched terms for LV DAPs in the pooled all doses vs. HCM comparison. Enrichment plots for GO CC (A,B), GO BP (C,D), and KEGG pathway (E,F) term analyses are presented for under- (blue box) and overabundant (pink box) DAPs. The y-axis depicts identified enriched terms, whereas the x-axis depicts the terms’ significance (−log10[FDR]). The terms are sorted according to statistical significance; the top-most terms on the y-axis constitute the most statistically significant of terms. The size of individual points depicts the total number of proteins binned to a given enriched term; high or low fold enrichment is represented by red or blue coloring, respectively. Abbreviations: HCM = hypertrophic cardiomyopathy, LV = left ventricle, GO = gene ontology, CC = cellular components, BP = biological processes, UA = underabundant, OA = overabundant, DAP = differentially abundant peptide(s).

References

    1. Laplante M., Sabatini D.M. mTOR signaling in growth control and disease. Cell. 2012;149:274–293. doi: 10.1016/j.cell.2012.03.017. - DOI - PMC - PubMed
    1. Sciarretta S., Volpe M., Sadoshima J. Mammalian target of rapamycin signaling in cardiac physiology and disease. Circ. Res. 2014;114:549–564. doi: 10.1161/CIRCRESAHA.114.302022. - DOI - PMC - PubMed
    1. Sciarretta S., Forte M., Frati G., Sadoshima J. New Insights Into the Role of mTOR Signaling in the Cardiovascular System. Circ. Res. 2018;122:489–505. doi: 10.1161/CIRCRESAHA.117.311147. - DOI - PMC - PubMed
    1. Arriola Apelo S.I., Lamming D.W. Rapamycin: An InhibiTOR of Aging Emerges from the Soil of Easter Island. J. Gerontol. A Biol. Sci. Med. Sci. 2016;71:841–849. doi: 10.1093/gerona/glw090. - DOI - PMC - PubMed
    1. McMullen J.R., Sherwood M.C., Tarnavski O., Zhang L., Dorfman A.L., Shioi T., Izumo S. Inhibition of mTOR signaling with rapamycin regresses established cardiac hypertrophy induced by pressure overload. Circulation. 2004;109:3050–3055. doi: 10.1161/01.CIR.0000130641.08705.45. - DOI - PubMed