. 2023 Sep 23;11(10):2379.
doi: 10.3390/microorganisms11102379.

The Signal Transduction Protein PII Controls the Levels of the Cyanobacterial Protein PipX

Affiliations

The Signal Transduction Protein PII Controls the Levels of the Cyanobacterial Protein PipX

Antonio Llop et al. Microorganisms. .

Abstract

Cyanobacteria, microorganisms performing oxygenic photosynthesis, must adapt their metabolic processes to environmental challenges such as day and night changes. PipX, a unique regulatory protein from cyanobacteria, provides a mechanistic link between the signalling protein PII, a widely conserved (in bacteria and plants) transducer of carbon/nitrogen/energy richness, and the transcriptional regulator NtcA, which controls a large regulon involved in nitrogen assimilation. PipX is also involved in translational regulation through interaction with the ribosome-assembly GTPase EngA. However, increases in the PipX/PII ratio are toxic, presumably due to the abnormally increased binding of PipX to other partner(s). Here, we present mutational and structural analyses of reported PipX-PII and PipX-NtcA complexes, leading to the identification of single amino acid changes that decrease or abolish PipX toxicity. Notably, 4 out of 11 mutations decreasing toxicity did not decrease PipX levels, suggesting that the targeted residues (F12, D23, L36, and R54) provide toxicity determinants. In addition, one of those four mutations (D23A) argued against the over-activation of NtcA as the cause of PipX toxicity. Most mutations at residues contacting PII decreased PipX levels, indicating that PipX stability would depend on its ability to bind to PII, a conclusion supported by the light-induced decrease of PipX levels in Synechococcus elongatus PCC7942 (hereafter S. elongatus).

Keywords: NtcA; PipX toxicity; Synechococcus elongatus; energy sensing; light and dark conditions; mutational analysis; nitrogen regulation network; protein interaction.


Conflict of interest statement

The authors declare no conflict of interest.

Figures

Figure 1
Figure 1
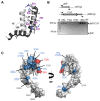
PipX in complex with PII or NtcA, or illustrating the position of residues discussed in this work. (A) PipX-PII (PDB:2XG8), (B) PipX-NtcA (PDB:2XKO), and (C) PipX (chain E of PDB file 2XG8). PipX structures are shown in ribbon representations and different hues of grey. PII and NtcA are shown in surface representation, with each subunit in a different hue of blue (PII) or green (NtcA). In (B), NtcA-bound 2-OG molecules are shown in spheres in brown. In (C), yellow spheres indicate the location of the indicated residues in the PipX structure.
Figure 2
Figure 2
PipX point mutations and toxicity. (A) Ribbon representation of C-terminal helices of PipX in “flexed” (light grey; taken from chain D of 2XKO) and “extended” (dark grey, taken from chain D of 2XG8) forms. The discussed residues are indicated, with arginines in purple. Selected side chains are shown (stick representation), with N atoms coloured blue. (B) Schematic representation of the wild-type (glnB) and mutant (glnB::C.S3) glnB alleles whose segregation in CK1X*Y strains is shown below by PCR analysis. The positions of primers and expected sizes of PCR products are indicated. (C) Two views of the PipX subunit structure (chain D of PDB file 2XG8) in the extended conformation, with the surface represented in semi-transparent form, rendering visible the fold of the chain in cartoon representation. Underlined residues indicate spontaneous mutations. The location and phenotype conferred by each mutation are illustrated with the following colour code: grey, neutral; blue, loss-of-function; red, gain-of-function.
Figure 3
Figure 3
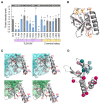
Effects of PipX point mutations on protein levels and location of residues in complexes. (A) Top, representative illustrations of PipX bands from Western blots of S. elongatus derivatives Main panel: quantification (means and SD) of PipX band intensities for the indicated number of biological replicates (above the bars) normalised to the intensity in the same blot of endogenous PlmA. The Wilcoxon rank sum test with Holm–Bonferroni correction of the mutants versus the control strain (CK1XY) produced p-values <0.05 (∗), <0.01 (**), or <0.001 (***). The colours of the bars follow the colour code in Figure 2C for toxicity. Bottom: a schematic representation of the PipX polypeptide indicates the position of mutations. (B) Localization in the PipX structure (chain E taken from PDB 2XG8; secondary structure elements are labelled) of residues inferred to provide determinants for toxicity, with side chains shown in stick representation and inter-residue distances as dashed red lines. C, O, and N atoms are coloured orange, red, and blue, respectively. (C) Stereoviews of PipX-PII (top) or PipX-NtcA (bottom) zooming on PipX (in cartoon representation) and the region of PII or NtcA (in surface representation) that accommodates PipX. Side chains of PipX residues are shown in stick representation (O and N atoms in red and blue, respectively) and in black or red coloring, depending on whether they do or do not make direct interactions with PII or NtcA. (D) The same residues are represented as spheres on the isolated PipX structure (from PDB:2XG8 chain E) and residues interacting or not with PII in cyan or pink, respectively. Pale and dark tones correspond to low or normal protein levels, respectively.
Figure 4
Figure 4
PipX levels after the transition from darkness to light. Representative immunodetection pictures of PipX and PlmA detected in S. elongatus and relative PipX levels, normalised by the PlmA signal and referred to as point 0, Means and error bars (SD) from the number of biological replicates (two independent experiments) are indicated above the points. The Wilcoxon rank sum test with Holm–Bonferroni correction versus the 120-min point produced p-values < 0.05 (*).

Similar articles

Cited by

References

    1. Blank C.E., Sanchez-Baracaldo P. Timing of morphological and ecological innovations in the cyanobacteria—A key to understanding the rise in atmospheric oxygen. Geobiology. 2010;8:1–23. doi: 10.1111/j.1472-4669.2009.00220.x. - DOI - PubMed
    1. Lee H.-W., Noh J.-H., Choi D.-H., Yun M., Bhavya P.S., Kang J.-J., Lee J.-H., Kim K.-W., Jang H.-K., Lee S.-H. Picocyanobacterial Contribution to the Total Primary Production in the Northwestern Pacific Ocean. Water. 2021;13:1610. doi: 10.3390/w13111610. - DOI
    1. Zhang Y., Burkhardt D.H., Rouskin S., Li G.W., Weissman J.S., Gross C.A. A Stress Response that Monitors and Regulates mRNA Structure Is Central to Cold Shock Adaptation. Mol. Cell. 2018;70:274–286.e277. doi: 10.1016/j.molcel.2018.02.035. - DOI - PMC - PubMed
    1. Forchhammer K., Selim K.A. Carbon/nitrogen homeostasis control in cyanobacteria. FEMS Microbiol. Rev. 2020;44:33–53. doi: 10.1093/femsre/fuz025. - DOI - PMC - PubMed
    1. Muro-Pastor M.I., Reyes J.C., Florencio F.J. Ammonium assimilation in cyanobacteria. Photosynth. Res. 2005;83:135–150. doi: 10.1007/s11120-004-2082-7. - DOI - PubMed

LinkOut - more resources