. 2023 Oct 15;11(10):2564.
doi: 10.3390/microorganisms11102564.

Differential Immune-Modulating Activities of Cell Walls and Secreted Metabolites from Probiotic Bacillus coagulans JBI-YZ6.3 under Normal versus Inflamed Culture Conditions

Affiliations

Differential Immune-Modulating Activities of Cell Walls and Secreted Metabolites from Probiotic Bacillus coagulans JBI-YZ6.3 under Normal versus Inflamed Culture Conditions

Ifeanyi Iloba et al. Microorganisms. .

Abstract

Spore-forming probiotic bacteria, including Bacillus coagulans, are resilient and produce a variety of beneficial metabolites. We evaluated the immune-modulating effects of the novel probiotic strain Bacillus coagulans JBI-YZ6.3, where the germinated spores, metabolite fraction, and cell wall fraction were tested in parallel using human peripheral blood mononuclear cell cultures under both normal and lipopolysaccharide-induced inflamed culture conditions. The expression of CD25 and CD69 activation markers was evaluated via flow cytometry. Supernatants were tested for cytokines, interferons, chemokines, and growth factors using Luminex arrays. The germinated spores were highly immunogenic; both the cell wall and metabolite fractions contributed significantly. Under normal culture conditions, increased levels of immune activation were observed as increased expressions of CD25 and CD69 relative to natural killer cells, suggesting an increased ability to attack virus-infected target cells. On monocytes, a complex effect was observed, where the expression of CD25 increased under normal conditions but decreased under inflamed conditions. This, in combination with increased interleukin-10 (IL-10) and decreased monocyte chemoattractant protein-1 (MCP-1) production under inflamed conditions, points to anti-inflammatory effects. The production of the stem cell-related growth factor granulocyte colony-stimulating Factor (G-CSF) was enhanced. Further research is warranted to characterize the composition of the postbiotic metabolite fraction and document the characteristics of immunomodulating agents secreted by this probiotic strain.

Keywords: T cells; anti-inflammatory; chemokines; cytokines; granulocyte colony-stimulating factor (G-CSF); monocytes; natural killer (NK) cells.


Conflict of interest statement

The authors declare no conflict of interest. The funders had no role in the design of the study; in the collection, analyses, or interpretation of data; or in the writing of the manuscript. The funders supported the decision to publish the results.

Figures

Figure 1
Figure 1
Diagram showing the procedures for preparing germinated spores, the metabolite fraction, and the cell wall fraction from Bacillus coagulans.
Figure 2
Figure 2
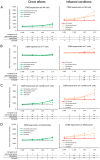
Expression levels of the CD25 activation marker on subsets of human peripheral blood mononuclear cells. The left panel (green lines) shows the direct effects of the germinated spores, metabolites, and cell walls; untreated control cultures (UCs) were used as negative controls (grey lines). The right panel (orange lines) shows the effects of the test products under inflamed culture conditions, where inflammation was induced by lipopolysaccharides (LPSs); LPS alone was used as a positive control (red lines). (A) Expression of CD25 on natural killer (NK) cells was mildly induced by all 3 products; under inflamed culture conditions, the products triggered an increase in LPS-induced levels of CD25. (B) Expression of CD25 on T cells was induced by all 3 products; under inflamed culture conditions, the germinated spores and the cell walls triggered a mild increase in LPS-induced levels of CD25, whereas the metabolites had no effect. (C) Expression of CD25 on nonNK nonT cells was induced by all 3 products; under inflamed culture conditions, the germinated spores triggered a robust increase, and the cell walls triggered a mild increase in the LPS-induced levels of CD25, whereas the effects of the metabolites were minimal. (D) Expression of CD25 on monocytes was induced by all 3 products; under inflamed culture conditions, the germinated spores triggered a robust decrease, and the cell walls triggered a mild decrease in the LPS-induced levels of CD25, whereas the metabolites had no effect. Statistical comparisons are shown in the tables below each graph. For the graphs on the left side, statistical comparisons are carried out on the untreated control cultures (UCx). For the graphs on the right side, statistical comparisons are carried out on the LPS-treated (LPS) control cultures. The statistical significance when comparing the test products to controls is indicated with (*) for p < 0.1, * for p < 0.05, and ** for p < 0.01.
Figure 3
Figure 3
Expression levels of the CD69 activation marker on subsets of human peripheral blood mononuclear cells. The left panel (green lines) shows the direct effects of the germinated spores, metabolites, and cell walls; untreated control cultures (UCs) were used as negative controls (grey lines). The right panel (orange lines) shows the effects of the test products under inflamed culture conditions, where inflammation was induced by lipopolysaccharide (LPS); LPS alone was used as a positive control (red lines). (A) Expression of CD69 on natural killer (NK) cells was mildly induced by all 3 products; under inflamed culture conditions, the products triggered an increase in LPS-induced levels of CD69, and the effect was the strongest for the cell walls. (B) Expression of CD69 on T cells was not affected by the 3 products; under inflamed culture conditions, the highest dose of the cell walls triggered a mild increase in the LPS-induced levels of CD69. (C) Expression of CD69 on non-NK non-T cells was induced by all 3 products; under inflamed culture conditions, the cell walls triggered a robust increase, with milder effects from the germinated spores and metabolites. (D) Expression of CD69 on monocytes was induced by the germinated spores and the cell walls but not affected by the metabolites; under inflamed culture conditions, the cell walls triggered a robust increase, and the germinated spores and metabolites triggered a milder increase in LPS-induced levels of CD69. Statistical comparisons are shown in the tables below each graph. For the graphs on the left side, the statistical comparisons are for the untreated control cultures (UCs). For the graphs on the right side, the statistical comparisons are for the LPS-treated (LPS) control cultures. The statistical significance when comparing the test products to controls is indicated with (*) for p < 0.1, * for p < 0.05, and ** for p < 0.01.
Figure 4
Figure 4
Cytokine production in cell cultures of human peripheral blood mononuclear cells. The left panel (green lines) shows the direct effects of the germinated spores, metabolites, and cell walls; untreated control cultures (UCs) were used as negative controls (grey lines). The right panel (orange lines) shows the effects of the test products under inflamed culture conditions, where inflammation was induced by lipopolysaccharides (LPSs); LPS alone was used as a positive control (red lines). (A) Interleukin-1-beta (IL-1β) was mildly induced by all 3 products, and under inflamed culture conditions, it triggered a robust increase in the LPS-induced levels of IL-1β. (B) Interleukin-6 (IL-6) was robustly induced by all 3 products, and under inflamed culture conditions, it triggered a mild but highly significant increase in the LPS-induced levels of IL-6. (C) Interleukin-17A (IL-17A) was robustly induced by all 3 products, and under inflamed culture conditions, it triggered a mild increase in the LPS-induced levels of IL-17A. (D) Tumor necrosis factor-alpha (TNF-α) was mildly induced by all 3 products, and under inflamed culture conditions, it triggered a robust increase in the LPS-induced levels of TNF-α. Statistical comparisons are shown in the tables below each graph. For the graphs on the left side, the statistical comparisons are for the untreated control cultures (UCs). For the graphs on the right side, the statistical comparisons are for the LPS-treated (LPS) control cultures. The statistical significance when comparing the test products to controls is indicated with (*) for p < 0.1, * for p < 0.05, and ** for p < 0.01.
Figure 5
Figure 5
Cytokine production in cell cultures of human peripheral blood mononuclear cells. The left panel (green lines) shows the direct effects of the germinated spores, metabolites, and cell walls; untreated control cultures (UCs) were used as negative controls (grey lines). The right panel (orange lines) shows the effects of the test products under inflamed culture conditions, where inflammation was induced by lipopolysaccharides (LPSs); LPS alone was used as a positive control (red lines). (A) Interferon-gamma (IFN-γ) was robustly induced by all 3 products, and under inflamed culture conditions, they triggered a very mild increase in the LPS-induced levels of IFN-γ. (B) Monocyte chemoattractant protein-1 (MCP-1) was robustly induced by all 3 products; however, under inflamed culture conditions, the products triggered a decrease in the LPS-induced levels of MCP-1. (C) Macrophage inflammatory protein-1 beta (MIP-1β) was robustly induced by all 3 products, and under inflamed culture conditions, it triggered a mild increase in the LPS-induced levels of MIP-1β. (D) The regulated upon activation, normal T cell expressed and secreted (RANTES) chemokine was robustly induced by all 3 products; under inflamed culture conditions, the products triggered a mild increase in the LPS-induced levels of RANTES, which was the strongest for the germinated spores. Statistical comparisons are shown in the tables below each graph. For the graphs on the left side, the statistical comparisons are for the untreated control cultures (UCs). For the graphs on the right side, the statistical comparisons are for the LPS-treated (LPS) control cultures. The statistical significance when comparing the test products to controls is indicated with (*) for p < 0.1, * for p < 0.05, and ** for p < 0.01.
Figure 6
Figure 6
Cytokine production in cell cultures of human peripheral blood mononuclear cells. The left panel (green lines) shows the direct effects of the germinated spores, metabolites, and cell walls; untreated control cultures (UCs) were used as negative controls (grey lines). The right panel (orange lines) shows the effects of the test products under inflamed culture conditions, where inflammation was induced by lipopolysaccharides (LPSs); LPS alone was used as a positive control (red lines). (A) Interleukin-10 (IL-10) was induced by all 3 products; under inflamed culture conditions, a robust increase was observed in the LPS-induced levels of IL-10. (B) Granulocyte colony-stimulating factor (G-CSF) was robustly induced by all 3 products; under inflamed culture conditions, the germinated spores and the cell walls triggered an increase in the LPS-induced levels of G-CSF. Statistical comparisons are shown in the tables below each graph. For the graphs on the left side, the statistical comparisons are for the untreated control cultures (UCs). For the graphs on the right side, the statistical comparisons are for the LPS-treated control cultures (LPS). The statistical significance when comparing the test products to controls is indicated with (*) for p < 0.1, * for p < 0.05, and ** for p < 0.01.

References

    1. McDermott A.J., Huffnagle G.B. The Microbiome and Regulation of Mucosa Immunity. Immunology. 2014;142:24–31. doi: 10.1111/imm.12231. - DOI - PMC - PubMed
    1. Gomaa E.Z. Human gut microbiota/microbiome in health and diseases: A review. Antonie Van Leeuwenhoek. 2020;113:2019–2040. doi: 10.1007/s10482-020-01474-7. - DOI - PubMed
    1. Kristensen N.B., Bryrup T., Allin K.H., Nielsen T., Hansen T.H., Pedersen O. Alterations in fecal microbiota composition by probiotic supplementation in healthy adults: A systematic review of randomized controlled trials. Genome Med. 2016;8:52. doi: 10.1186/s13073-016-0300-5. - DOI - PMC - PubMed
    1. Talebi S., Makhdoumi A., Bahreini M., Matin M.M., Moradi H.S. Three novel Bacillus strains from a traditional lacto-fermented pickle as potential probiotics. J. Appl. Microbiol. 2018;125:888–896. doi: 10.1111/jam.13901. - DOI - PubMed
    1. Upadrasta A., Pitta S., Madempudi R.S. Draft Genome Sequence of the Spore-Forming Probiotic Strain Bacillus coagulans Unique IS-2. Genome Announc. 2016;4:e00225-16. doi: 10.1128/genomeA.00225-16. - DOI - PMC - PubMed

Grants and funding

LinkOut - more resources