. 2023 Oct 17;15(20):5014.
doi: 10.3390/cancers15205014.

The Carcinogenic Potential of Bisphenol A in the Liver Based on Transcriptomic Studies

Affiliations

The Carcinogenic Potential of Bisphenol A in the Liver Based on Transcriptomic Studies

Marta Wiszpolska et al. Cancers (Basel). .

Abstract

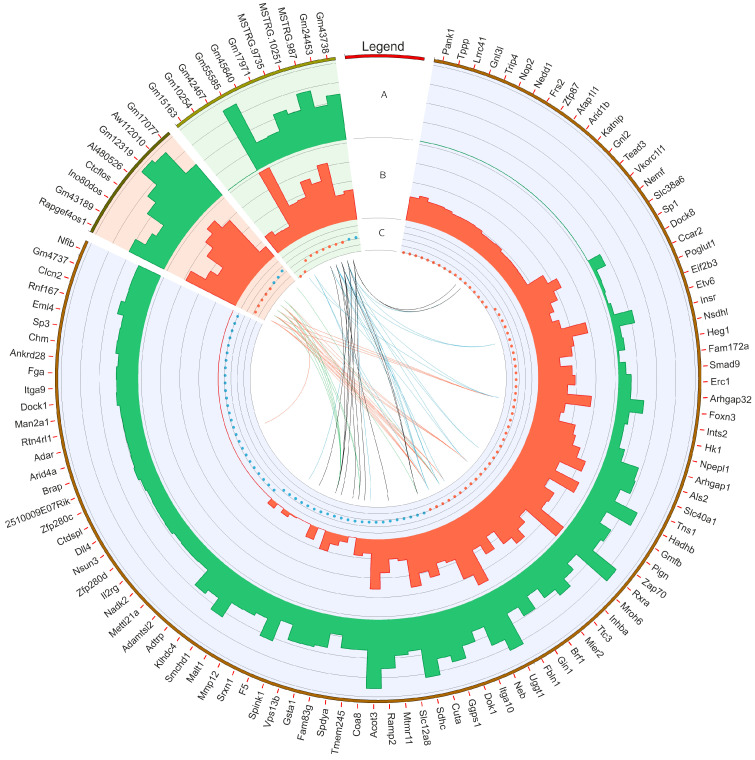
Bisphenol A (BPA) is an environmental toxin widely used in the production of polycarbonate plastics. A correlation exists between BPA tissue contamination and the occurrence of pathological conditions, including cancer. First-passage detoxification of high BPA amounts in the liver promotes hepatotoxicity and morphological alterations of this organ, but there is a lack of knowledge about the molecular mechanisms underlying these phenomena. This prompted us to investigate changes in the liver transcriptomics of 3-month-old female mice exposed to BPA (50 mg/kg) in drinking water for 3 months. Five female mice served as controls. The animals were euthanized, the livers were collected, and RNA was extracted to perform RNA-seq analysis. The multistep transcriptomic bioinformatics revealed 120 differentially expressed genes (DEGs) in the BPA-exposed samples. Gene Ontology (GO) annotations indicated that DEGs have been assigned to many biological processes, including "macromolecule modification" and "protein metabolic process". Several of the revealed DEGs have been linked to the pathogenesis of severe metabolic liver disorders and malignant tumors, in particular hepatocellular carcinoma. Data from this study suggest that BPA has a significant impact on gene expression in the liver, which is predictive of the carcinogenic potential of this compound in this organ.

Keywords: RNA-Seq; bisphenol A; hepatocellular carcinoma; liver; mitochondrial dysfunction.


Conflict of interest statement

The authors declare no conflict of interest.

Figures

Figure 1
Figure 1
Volcano plot presenting the expression changes measured by log2 fold change (log2FC) level within gene expression profiles in BPA-treated versus control experimental comparison. The difference values of each gene are presented on the X-axis, and the negative logarithmic adjusted p-value (q-value) is presented on the Y-axis. The horizontal dotted line is equal to the negative logarithmic value of q cut-off (0.05) and two vertical lines are equal to the absolute value of log2FC (1.0). Colored points represent different types of significant differentially expressed genes (DEGs), long non-coding RNAs (DELs), and other RNAs (DE-RNAs) and gray points represent non-significant genes.
Figure 2
Figure 2
Circular heatmap visualization of differentially expressed genes (DEGs), long non-coding RNAs (DELs), and other DE-RNAs in BPA-affected and control libraries. The DEGs, DELs, and other DE-RNAs were highlighted by blue, red, and green backgrounds, respectively. The first track shows the gene ID for particular transcripts/genes. In the second (A) and third tracks (B), the bars describe the summarized counts values of BPA-treated (green bars) and CTR (red bars). The fourth track (C) depicts down- (red dots) and upregulated (blue dots) transcripts. The internal links merge expression profiles of DEGs and other non-coding RNAs according to the Pearson correlation coefficient (absolute r value > 0.8). The red and blue links join positively correlated DEGs and non-coding RNAs. The black and green lines show negative correlations.
Figure 3
Figure 3
Volcano plot showing the inclusion level differences (ΔPSI; X-axis) against the statistical significance (−log10FDR; Y-axis) of differential alternative splicing events (DASs) identified within genes of murine BPA-affected liver vs. control samples. The horizontal dotted line is equal to the negative logarithmic value of the FDR cut-off (0.05) and two vertical lines are equal to the absolute value of 0.1 ∆PSI. The colors of the dots indicate specific types of DAS: alternative 3′ splice site (A3SS—blue), alternative 5′ splice site (A5SS—yellow), mutually exclusive exons (MXE—purple), retained intron (RI—brown), skipping exon (SE—green), and not a significant event (gray). Uncolored figures denote ΔPSI values (circle—higher inclusion level in BPA, square—higher inclusion level in CTR, triangle—not significant).
Figure 4
Figure 4
Circular heatmap presents the differentially alternative splicing events (DASs) occurring after BPA treatment. The five-scale color heatmaps (outer track) represent inclusion level values (PSI) in experimental (BPA) and control (CTR) samples. The heatmap blocks present types of alternative splicing events, where purple is alternative 3′ splice site (A3SS), orange is mutually exclusive exons (MXE), green is retained intron (RI), blue is skipped exon (SE), and pink is alternative 5′ splice site (A5SS). The middle track describes the difference in the compared group, measured by inclusion level differences (red—higher inclusion level in BPA, blue—higher inclusion level in CTR). Colors inner links join common genes with more than one DAS classified in different types of alternative splicing events (green line intersects RI and SE, navy RI and A3SS, light blue SE and A5SS, and red links SE and MXE).
Figure 5
Figure 5
Sashimi plot visualizing statistically significant differentiated alternative splicing events within (a) SRRT, (b) PRDM2, and (c) CANT1 genes. Red and purple histograms show detected coverage of RNA-seq reads on the reference genome fragments within control and BPA-treated groups. The average values of reads combining distant genome fragments (black blocks underneath the graphs) are displayed on lines symbolizing spliced regions. Abbreviations: IncLevel—inclusion level, RPKM—reads per kilobase million.
Figure 6
Figure 6
Circos-plot relationship of differentially expressed genes (DEGs) and differentially alternatively spliced genes (DASs) engaged in liver function under BPA influence significantly associated with three selected Gene Ontology (GO)-enriched terms. Color links merge genes with the GO terms (GO:0043412: macromolecule modification; GO:0019538: protein metabolic process; GO:0036211: protein modification process).
Figure 7
Figure 7
The mRNA expression of selected genes was obtained through real-time PCR. The expression of endogenous control is shown as normalized to a value of 1 (REF), and the expression of validated genes indicates the changes relative to the control. The exact values of the expression are marked above the bars. p-values < 0.05 were considered statistically significant, where 0.0332 (*), 0.0021 (**), 0.0002 (***), and 0.0001 (****).

References

    1. Michałowicz J. Bisphenol A—Sources, Toxicity and Biotransformation. Environ. Toxicol. Pharmacol. 2014;37:738–758. doi: 10.1016/j.etap.2014.02.003. - DOI - PubMed
    1. Rubin B.S. Bisphenol A: An Endocrine Disruptor with Widespread Exposure and Multiple Effects. J. Steroid Biochem. Mol. Biol. 2011;127:27–34. doi: 10.1016/j.jsbmb.2011.05.002. - DOI - PubMed
    1. Wang K., Zhao Z., Ji W. Bisphenol A Induces Apoptosis, Oxidative Stress and Inflammatory Response in Colon and Liver of Mice in a Mitochondria-Dependent Manner. Biomed. Pharmacother. 2019;117:109182. doi: 10.1016/j.biopha.2019.109182. - DOI - PubMed
    1. Huang Y.Q., Wong C.K.C., Zheng J.S., Bouwman H., Barra R., Wahlström B., Neretin L., Wong M.H. Bisphenol A (BPA) in China: A Review of Sources, Environmental Levels, and Potential Human Health Impacts. Environ. Int. 2012;42:91–99. doi: 10.1016/j.envint.2011.04.010. - DOI - PubMed
    1. Liao C., Liu F., Kannan K. Bisphenol S, a New Bisphenol Analogue, in Paper Products and Currency Bills and Its Association with Bisphenol A Residues. Environ. Sci. Technol. 2012;46:6515–6522. doi: 10.1021/es300876n. - DOI - PubMed

LinkOut - more resources