. 2023 Oct 12;24(20):15107.
doi: 10.3390/ijms242015107.

Endotenon-Derived Type II Tendon Stem Cells Have Enhanced Proliferative and Tenogenic Potential

Affiliations

Endotenon-Derived Type II Tendon Stem Cells Have Enhanced Proliferative and Tenogenic Potential

Marta Clerici et al. Int J Mol Sci. .

Abstract

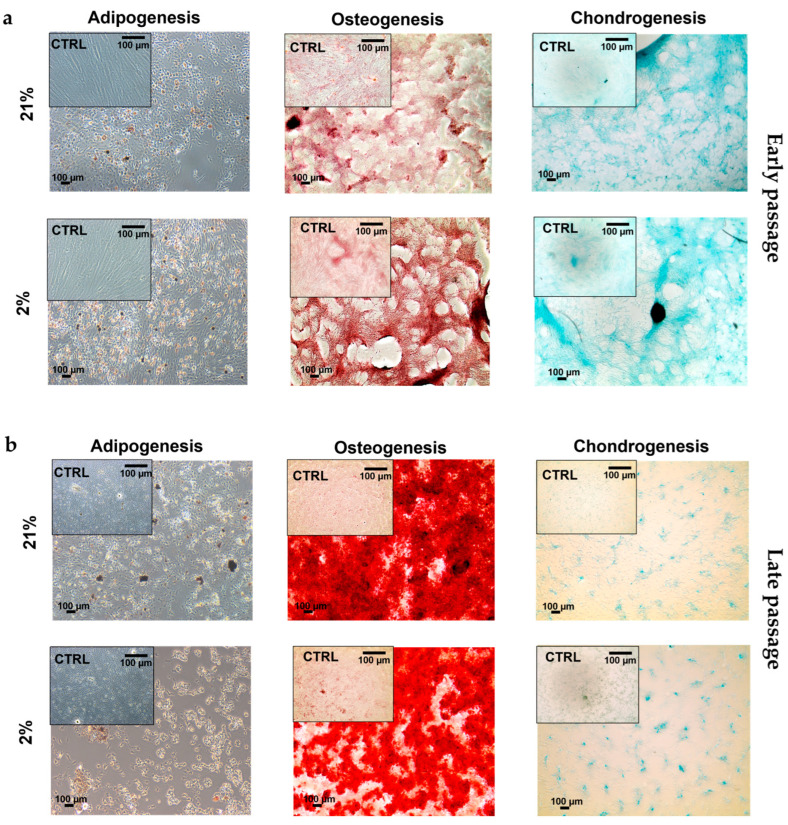
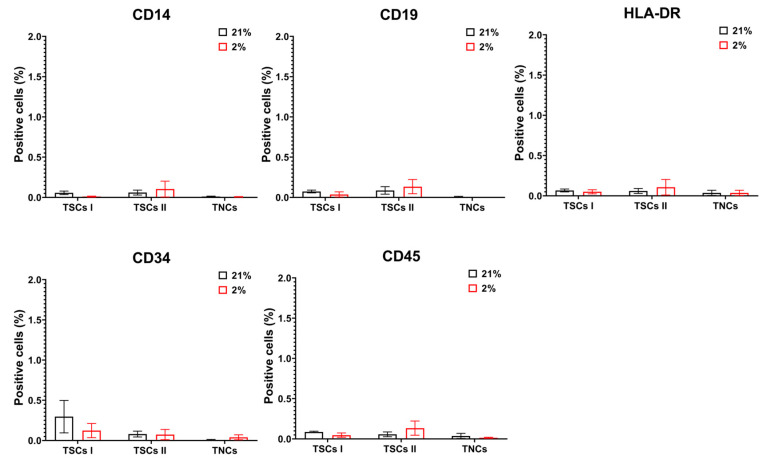
Tendon injuries caused by overuse or age-related deterioration are frequent. Incomplete knowledge of somatic tendon cell biology and their progenitors has hindered interventions for the effective repair of injured tendons. Here, we sought to compare and contrast distinct tendon-derived cell populations: type I and II tendon stem cells (TSCs) and tenocytes (TNCs). Porcine type I and II TSCs were isolated via the enzymatic digestion of distinct membranes (paratenon and endotenon, respectively), while tenocytes were isolated through an explant method. Resultant cell populations were characterized by morphology, differentiation, molecular, flow cytometry, and immunofluorescence analysis. Cells were isolated, cultured, and evaluated in two alternate oxygen concentrations (physiological (2%) and air (21%)) to determine the role of oxygen in cell biology determination within this relatively avascular tissue. The different cell populations demonstrated distinct proliferative potential, morphology, and transcript levels (both for tenogenic and stem cell markers). In contrast, all tendon-derived cell populations displayed multipotent differentiation potential and immunophenotypes (positive for CD90 and CD44). Type II TSCs emerged as the most promising tendon-derived cell population for expansion, given their enhanced proliferative potential, multipotency, and maintenance of a tenogenic profile at early and late passage. Moreover, in all cases, physoxia promoted the enhanced proliferation and maintenance of a tenogenic profile. These observations help shed light on the biological mechanisms of tendon cells, with the potential to aid in the development of novel therapeutic approaches for tendon disorders.

Keywords: TNCs; TSCs; tendinopathies; tendon regeneration; tenogenic markers.


Conflict of interest statement

The authors declare no conflict of interest.

Figures

Figure 1
Figure 1
Tendon stem cells were successfully isolated from porcine Achilles tendons through enzymatic digestion. (a) Porcine Achilles tendon, indicated by red arrow, from which tendon cells were isolated after any visible fat or muscle were removed; (b) viable type I TSCs (red), derived from the digestion of the paratenon; type II TSCs (blue), derived from the digestion of the endotenon; and TNCs (black) derived from tissue explant (2% and 21% O2 averaged together); n = 3. Data expressed as mean ± SD.
Figure 2
Figure 2
Growth kinetics of tendon cells. (a) Physoxia promotes higher proliferative potential in tendon cell populations. TSCs I (red) and II (blue) and TNCs (black) were isolated and cultured in 2% and 21% O2 to calculate cumulative population doubling (CPD); (b) tendon cell populations have different population doubling times. Type II TSCs (blue) have the shortest PDT during the whole culture time compared with type I TSCs (red) and TNCs (black). Data expressed as mean ± SD. ‘**’ = p < 0.01 and ‘****’= p < 0.0001.
Figure 3
Figure 3
TSC I aspect ratio is oxygen-dependent. (a) TSC I morphology changes in 21% and 2% O2, observed through optical microscopy between early and late passages. Scale bar = 100 µm. (b) TSC I aspect ratios were measured and compared between early and late passages within the same oxygen culture condition and between the same passages at different oxygen concentrations. ‘***’ = p < 0.001.
Figure 4
Figure 4
TSC II aspect ratio is oxygen- and passage-dependent. (a) TSC II morphology changes in 21% and 2% O2 observed through optical microscopy between early and late passages. Scale bar = 100 µm. (b) TSC II aspect ratios were measured and compared between early and late passages within the same oxygen culture condition and between the same passages at different oxygen concentrations. ‘**’ = p < 0.01 and ‘****’= p < 0.0001.
Figure 5
Figure 5
TNC aspect ratio is oxygen and passage-dependent. (a) TNC morphology changes in 21% and 2% O2 observed through optical microscopy between early and late passages. Scale bar = 100 µm. (b) TNC aspect ratios were measured and compared between early and late passages within the same oxygen culture condition and between the same passages at different oxygen concentrations. ‘***’ = p < 0.001 and ‘****’= p < 0.0001.
Figure 6
Figure 6
Multipotency potential of type I TSCs. Trilineage differentiation (adipogenesis, osteogenesis, and chondrogenesis) of type I TSCs at an early passage (P3) in 21% and 2% O2. Cells were cultured for 21 days using complete culture media as a control. Scale bar = 100 µm.
Figure 7
Figure 7
Multipotency potential of type II TSCs. Trilineage differentiation (adipogenesis, osteogenesis, and chondrogenesis) of type II TSCs at (a) an early passage (P3) and (b) a late passage (P13) in 21% and 2% O2. Cells were cultured for 21 days using complete culture media as a control. Scale bar = 100 µm.
Figure 8
Figure 8
Multipotency potential of TNCs. Trilineage differentiation (adipogenesis, osteogenesis, and chondrogenesis) of TNCs at an early passage (P3) in 21% and 2% O2. Cells were cultured for 21 days using complete culture media as a control. Scale bar = 100 µm.
Figure 9
Figure 9
TSCs I and II and TNCs do not express hematopoietic markers. The panel shows CD14, CD19, CD34, CD45, and HLA-DR surface marker expression for all cell types through flow cytometry analysis. Cell count bar charts display marker expressions (% of positive events) on single cells.
Figure 10
Figure 10
Tendon-derived cell populations expressing CD44. (a) Cell count bar charts display CD44 marker expressions (% of positive events) in single cells for TSCs I and II and TNCs; (b) relative fluorescence intensity geomean (rFIG) of all cell types that expressed CD44.
Figure 11
Figure 11
Tendon-derived cell populations express CD90. (a) Cell count bar charts display CD90 marker expressions (% of positive events) in single cells for TSCs I and II and TNCs; (b) relative fluorescence intensity geomean (rFIG) of all cell types that expressed CD90.
Figure 12
Figure 12
TSCs I and II and TNCs do not express CD73 and CD105. The panel shows CD73 and CD105 surface marker expression for all cell types through flow cytometry analysis. Cell count bar charts display marker expressions (% of positive events) in single cells.
Figure 13
Figure 13
TSCs and tenocytes have distinct responses to air exposure in size and granularity. The panel shows (a) the forward scatter area (FSC-A) of TSCs I and II and TNCs; (b)the side scatter area (SSC-A) of TSCs I and II and TNCs. ‘*’ for p < 0.05, ‘**’ for p < 0.01, ‘***’ for p < 0.001, and ‘****’ for p < 0.0001, ‘ns’ indicates ‘non significant’.
Figure 14
Figure 14
Tendon-derived cell populations express tenogenic genes. TSCs I and II and TNCs were tested at an early passage and a late passage at 2% and 21% O2 for the expression of (a) TNMD, (b) SCX-A, (c) THBS4, and (d) Tn-C. Data are expressed as −ΔCt, normalizing each gene of interest to ACT-β (housekeeping gene). ‘*’ for p < 0.05, ‘**’ for p < 0.01, ‘***’ for p < 0.001, and ‘****’ for p < 0.0001.
Figure 15
Figure 15
Tendon-derived cell populations expressing stem markers. TSCs I and II and TNCs were tested at an early passage and a late passage at 2% and 21% O2 for the expression of (a) NANOG, (b) NESTIN, and (c) OCT-4. Data are expressed as −ΔCt, normalizing each gene of interest to ACT-β (housekeeping gene). ‘*’ for p < 0.05, ‘**’ for p < 0.01, ‘***’ for p < 0.001, and ‘****’ for p < 0.0001.
Figure 16
Figure 16
Physoxia promotes better maintenance of the tenogenic profile in type II TSCs. (a) Immunofluorescence images of TNMD expression at days 1, 7, and 14 of type II TSCs cultured in 2% and 21% O2. Scale bar = 100 µm. (b) MFI analysis of TNMD expression of type II TSCs cultured for 14 days in 2% and 21% O2. ‘*’ for p < 0.05, ‘***’ for p < 0.001, and ‘****’ for p < 0.0001.

Similar articles

Cited by

References

    1. Nourissat G., Berenbaum F., Duprez D. Tendon Injury: From Biology to Tendon Repair. Nat. Rev. Rheumatol. 2015;11:223–233. doi: 10.1038/nrrheum.2015.26. - DOI - PubMed
    1. Vleck V.E., Garbutt G. Injury and Training Characteristics of Male Elite, Development Squad, and Club Triathletes. Int. J. Sports Med. 1998;19:38–42. doi: 10.1055/s-2007-971877. - DOI - PubMed
    1. Oliva F., Gatti S., Porcellini G., Forsyth N.R., Maffulli N. Growth Factors and Tendon Healing. Med. Sport Sci. 2012;57:53–64. doi: 10.1159/000328878. - DOI - PubMed
    1. Ciardulli M.C., Lovecchio J., Scala P., Lamparelli E.P., Dale T.P., Giudice V., Giordano E., Selleri C., Forsyth N.R., Maffulli N., et al. 3D Biomimetic Scaffold for Growth Factor Controlled Delivery: An In-Vitro Study of Tenogenic Events on Wharton’s Jelly Mesenchymal Stem Cells. Pharmaceutics. 2021;13:1448. doi: 10.3390/pharmaceutics13091448. - DOI - PMC - PubMed
    1. Yang G., Rothrauff B.B., Tuan R.S. Tendon and Ligament Regeneration and Repair: Clinical Relevance and Developmental Paradigm. Birth Defects Res. C Embryo Today. 2013;99:203–222. doi: 10.1002/bdrc.21041. - DOI - PMC - PubMed

LinkOut - more resources