

Comprehensive Analysis of GH3 Gene Family in Potato and Functional Characterization of StGH3.3 under Drought Stress
- PMID: 37894803
- PMCID: PMC10606756
- DOI: 10.3390/ijms242015122
Comprehensive Analysis of GH3 Gene Family in Potato and Functional Characterization of StGH3.3 under Drought Stress
Abstract
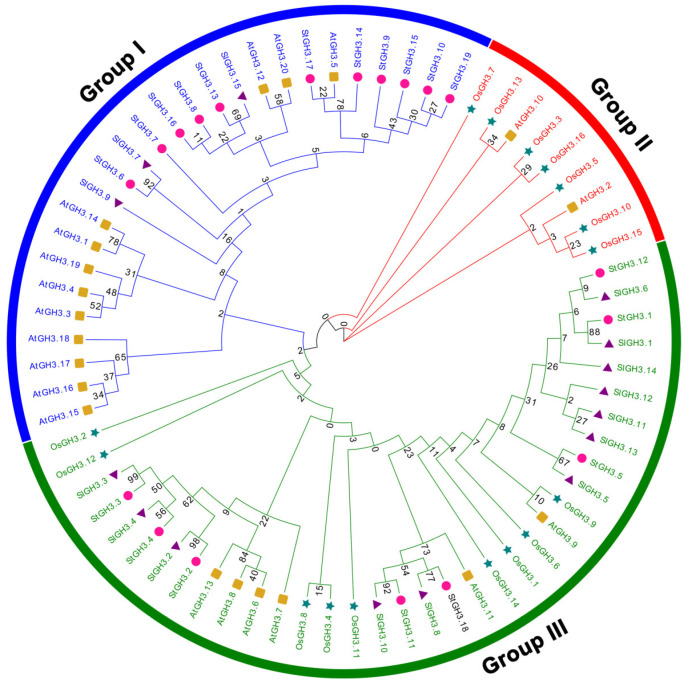
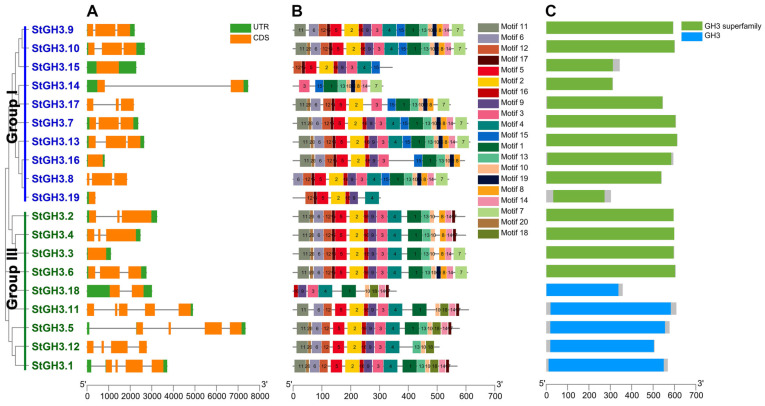
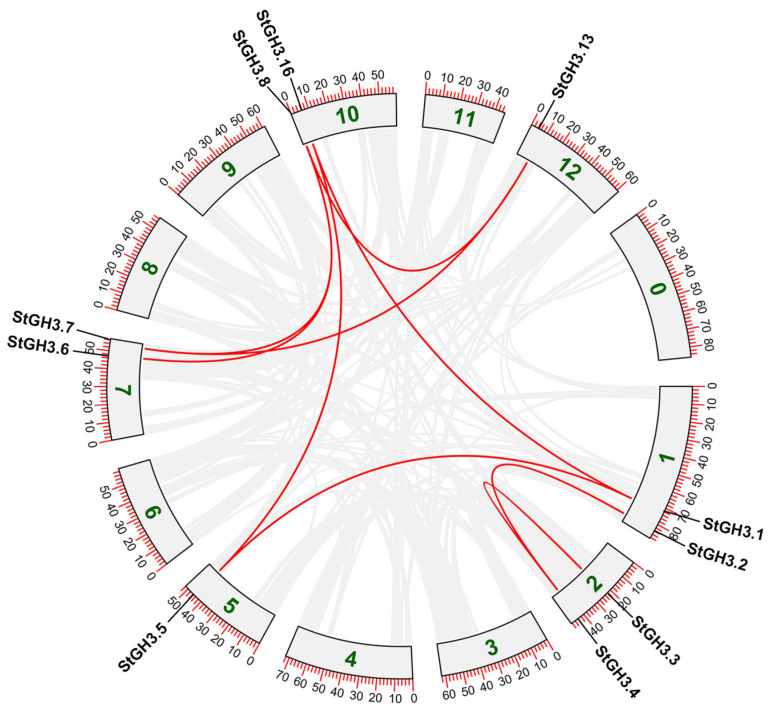
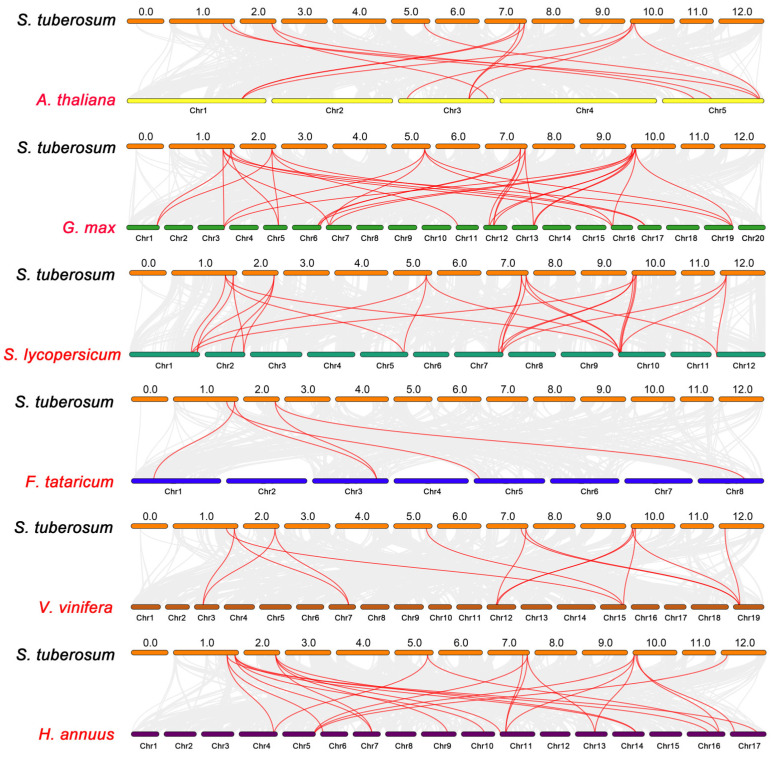
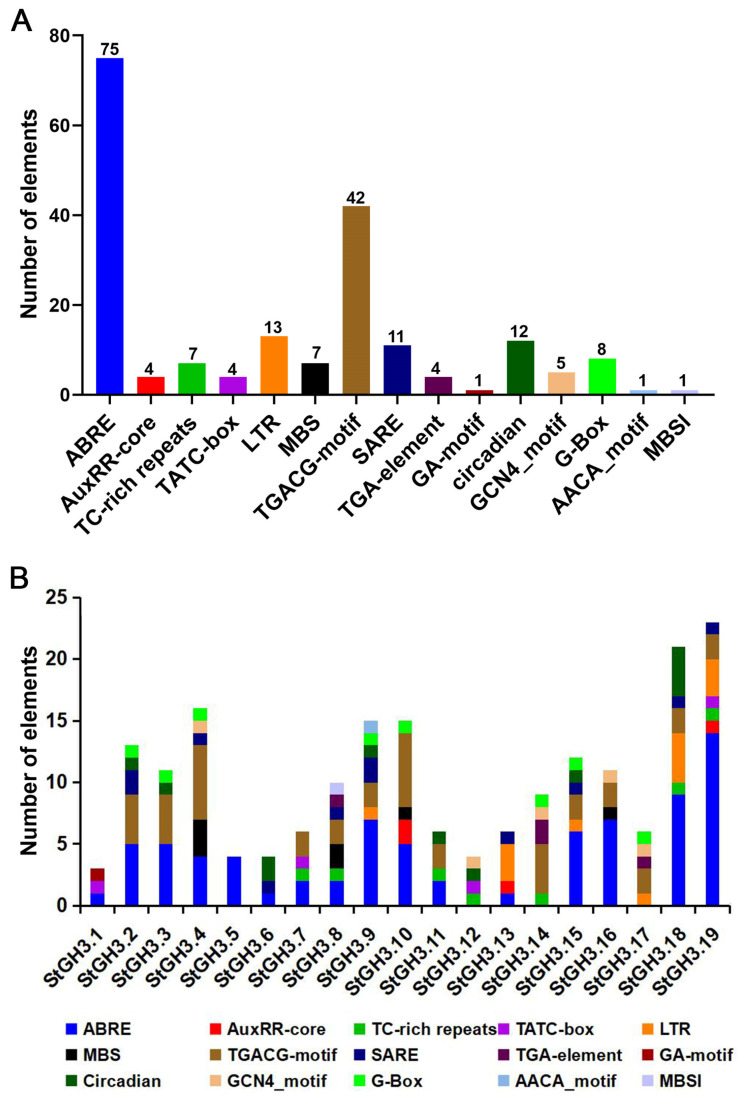
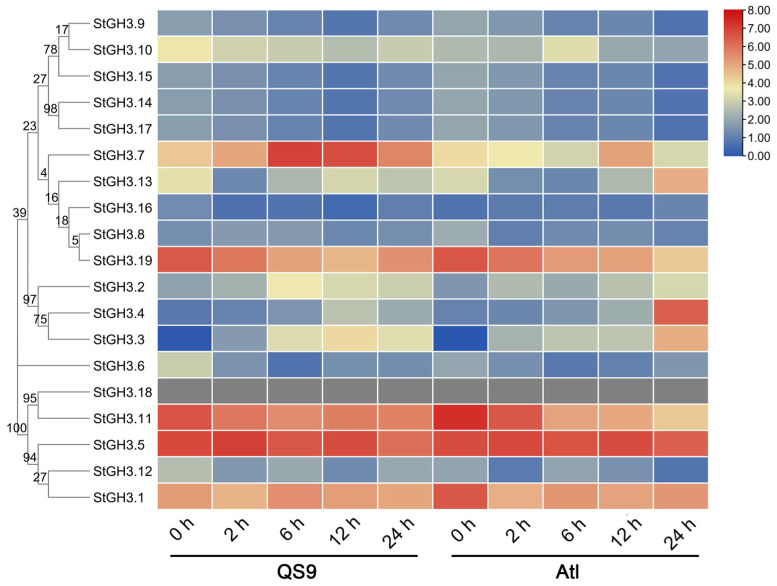
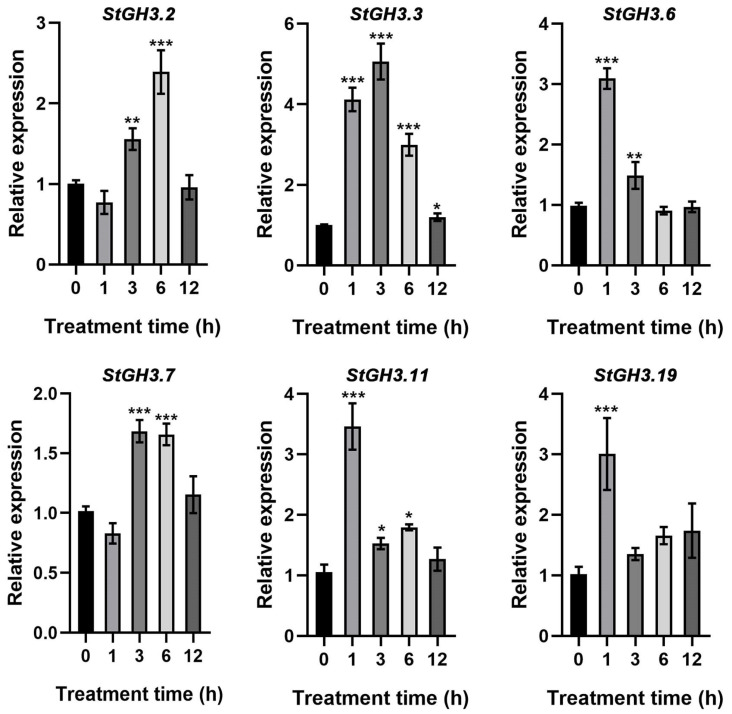
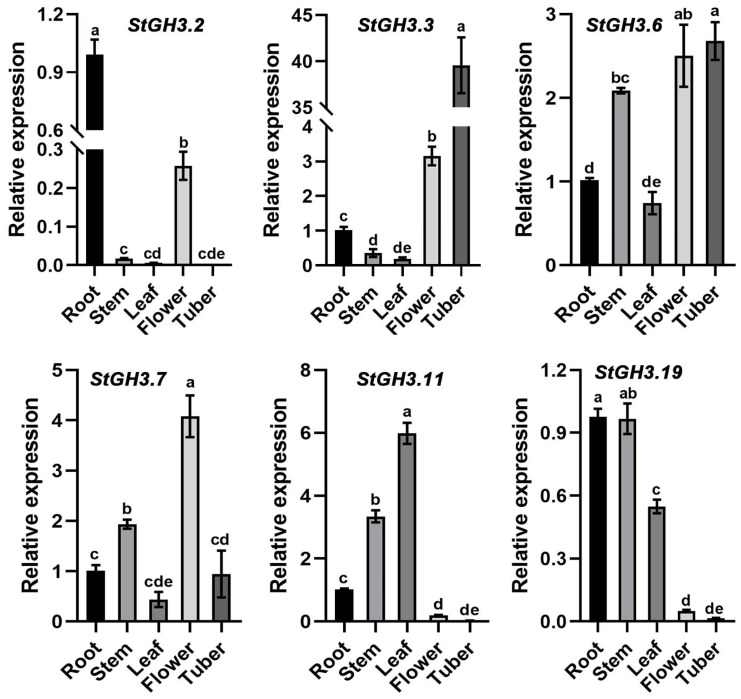
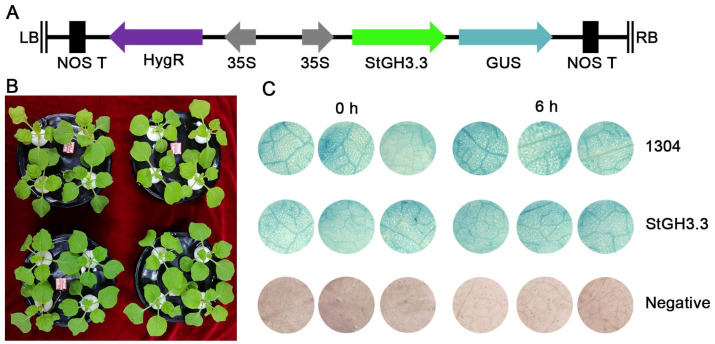
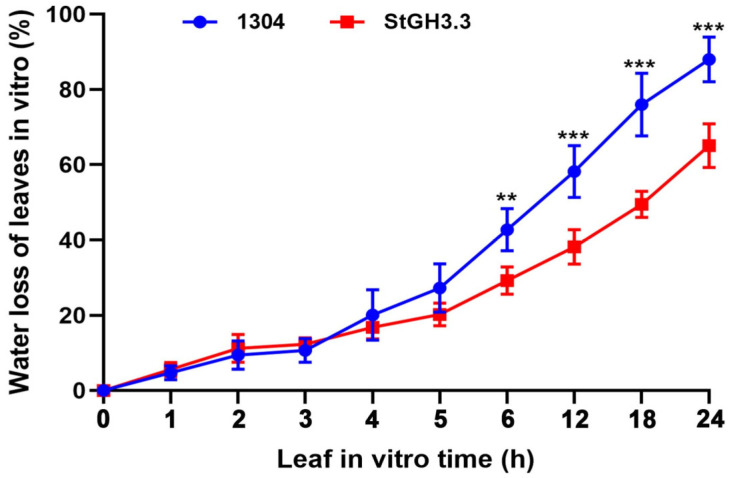
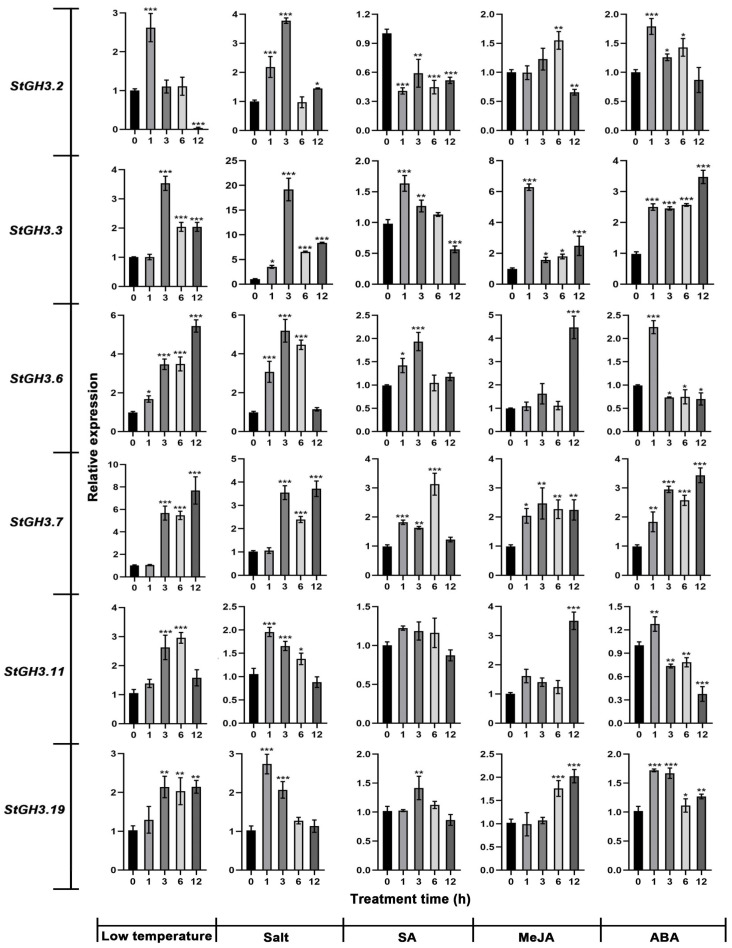
As an important hormone response gene, Gretchen Hagen 3 (GH3) maintains hormonal homeostasis by conjugating excess auxin with amino acids during plant stress-related signaling pathways. GH3 genes have been characterized in many plant species, but they are rarely reported in potato. Here, 19 StGH3 genes were isolated and characterized. Phylogenetic analysis indicated that StGH3s were divided into two categories (group I and group III). Analyses of gene structure and motif composition showed that the members of a specific StGH3 subfamily are relatively conserved. Collinearity analysis of StGH3 genes in potato and other plants laid a foundation for further exploring the evolutionary characteristics of the StGH3 genes. Promoter analysis showed that most StGH3 promoters contained hormone and abiotic stress response elements. Multiple transcriptome studies indicated that some StGH3 genes were responsive to ABA, water deficits, and salt treatments. Moreover, qRT-PCR analysis indicated that StGH3 genes could be induced by phytohormones (ABA, SA, and MeJA) and abiotic stresses (water deficit, high salt, and low temperature), although with different patterns. Furthermore, transgenic tobacco with transient overexpression of the StGH3.3 gene showed positive regulation in response to water deficits by increasing proline accumulation and reducing the leaf water loss rate. These results suggested that StGH3 genes may be involved in the response to abiotic stress through hormonal signal pathways. Overall, this study provides useful insights into the evolution and function of StGH3s and lays a foundation for further study on the molecular mechanisms of StGH3s in the regulation of potato drought resistance.
Keywords: GH3 family; expression pattern; potato; water deficit.
Conflict of interest statement
The authors declare no conflict of interest.
Figures

Similar articles
-
Evolutionary History of the Glycoside Hydrolase 3 (GH3) Family Based on the Sequenced Genomes of 48 Plants and Identification of Jasmonic Acid-Related GH3 Proteins in Solanum tuberosum.Int J Mol Sci. 2018 Jun 23;19(7):1850. doi: 10.3390/ijms19071850. Int J Mol Sci. 2018. PMID: 29937487 Free PMC article.
-
Genome-wide identification, characterization analysis and expression profiling of auxin-responsive GH3 family genes in wheat (Triticum aestivum L.).Mol Biol Rep. 2020 May;47(5):3885-3907. doi: 10.1007/s11033-020-05477-5. Epub 2020 May 2. Mol Biol Rep. 2020. PMID: 32361896
-
Functional characterization of Gh_A08G1120 (GH3.5) gene reveal their significant role in enhancing drought and salt stress tolerance in cotton.BMC Genet. 2019 Jul 23;20(1):62. doi: 10.1186/s12863-019-0756-6. BMC Genet. 2019. PMID: 31337336 Free PMC article.
-
Ectopic expression of a hot pepper bZIP-like transcription factor in potato enhances drought tolerance without decreasing tuber yield.Plant Mol Biol. 2015 Nov;89(4-5):421-31. doi: 10.1007/s11103-015-0378-y. Epub 2015 Sep 22. Plant Mol Biol. 2015. PMID: 26394867
-
Characterization of the GGP gene family in potato (Solanum tuberosum L.) and Pepper (Capsicum annuum L.) and its expression analysis under hormonal and abiotic stresses.Sci Rep. 2024 Jul 3;14(1):15329. doi: 10.1038/s41598-024-66337-x. Sci Rep. 2024. PMID: 38961199 Free PMC article.
Cited by
-
Genome-Wide Identification and Expression Analysis of the FAR1-RELATED SEQUENCE (FRS) Gene Family in Grape (Vitis vinifera L.).Int J Mol Sci. 2025 May 14;26(10):4675. doi: 10.3390/ijms26104675. Int J Mol Sci. 2025. PMID: 40429817 Free PMC article.
-
Genome-Wide Identification and Expression Analysis of Auxin-Responsive GH3 Gene Family in Pepper (Capsicum annuum L.).Plants (Basel). 2025 Jul 18;14(14):2231. doi: 10.3390/plants14142231. Plants (Basel). 2025. PMID: 40733468 Free PMC article.
-
Drought and salt stress mitigation in crop plants using stress-tolerant auxin-producing endophytic bacteria: a futuristic approach towards sustainable agriculture.Front Plant Sci. 2024 Jul 2;15:1422504. doi: 10.3389/fpls.2024.1422504. eCollection 2024. Front Plant Sci. 2024. PMID: 39015292 Free PMC article. Review.
-
Engineering saline-alkali-tolerant apple rootstock by knocking down MdGH3 genes in M9-T337.Stress Biol. 2025 Jun 23;5(1):44. doi: 10.1007/s44154-025-00236-7. Stress Biol. 2025. PMID: 40549263 Free PMC article.
-
The ETHYLENE RESPONSE FACTOR6-GRETCHEN HAGEN3.5 module regulates rooting and heat tolerance in Dimocarpus longan.Plant Physiol. 2025 Mar 1;197(3):kiaf096. doi: 10.1093/plphys/kiaf096. Plant Physiol. 2025. PMID: 40106655 Free PMC article.
References
MeSH terms
Substances
Grants and funding
- GSCS-2022-Z01/the Research Program Sponsored by State Key Laboratory of Aridland Crop Science of China
- 23ZYQJ304/the Central Government Guidance for Local Scientific and Technological Development Projects
- GAU-KYQD-2021-11/the Scientific Research Startup Funds for Openly-recruited Doctors of Gansu Agricultural University
- CARS-09-P10/the China Agriculture Potato Research System of MOF and MARA
LinkOut - more resources
Full Text Sources
Research Materials
