. 2023 Oct 13;24(20):15130.
doi: 10.3390/ijms242015130.

Thrombin-Induced COX-2 Expression and PGE2 Synthesis in Human Tracheal Smooth Muscle Cells: Role of PKCδ/Pyk2-Dependent AP-1 Pathway Modulation

Affiliations

Thrombin-Induced COX-2 Expression and PGE2 Synthesis in Human Tracheal Smooth Muscle Cells: Role of PKCδ/Pyk2-Dependent AP-1 Pathway Modulation

Chien-Chung Yang et al. Int J Mol Sci. .

Abstract

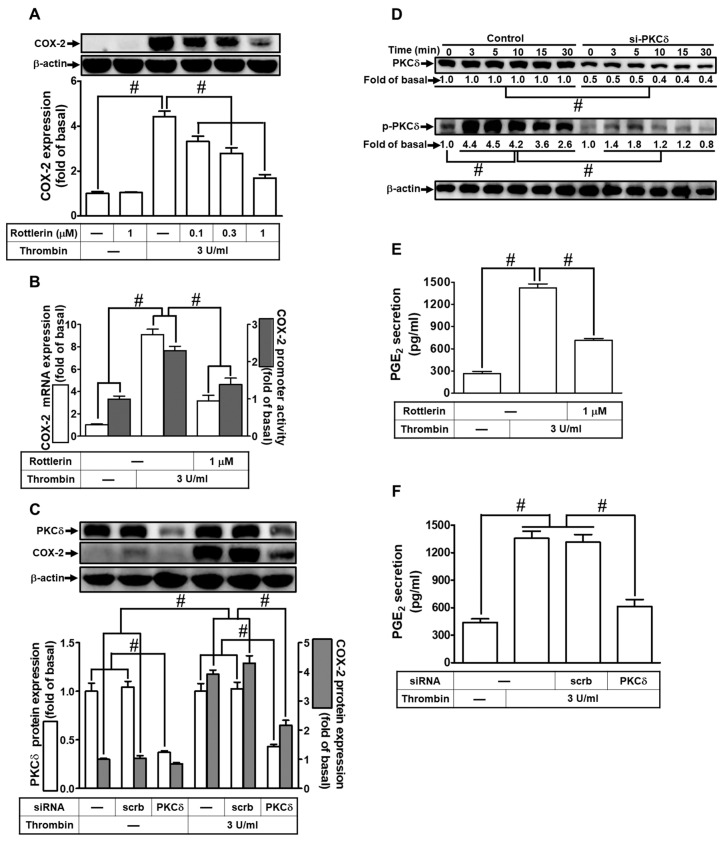
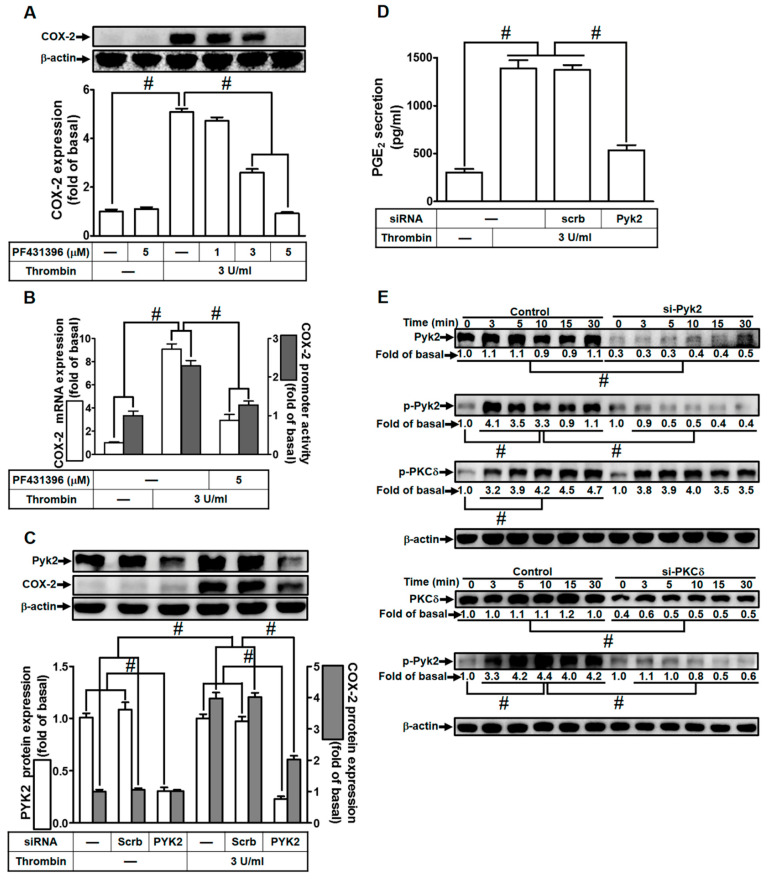
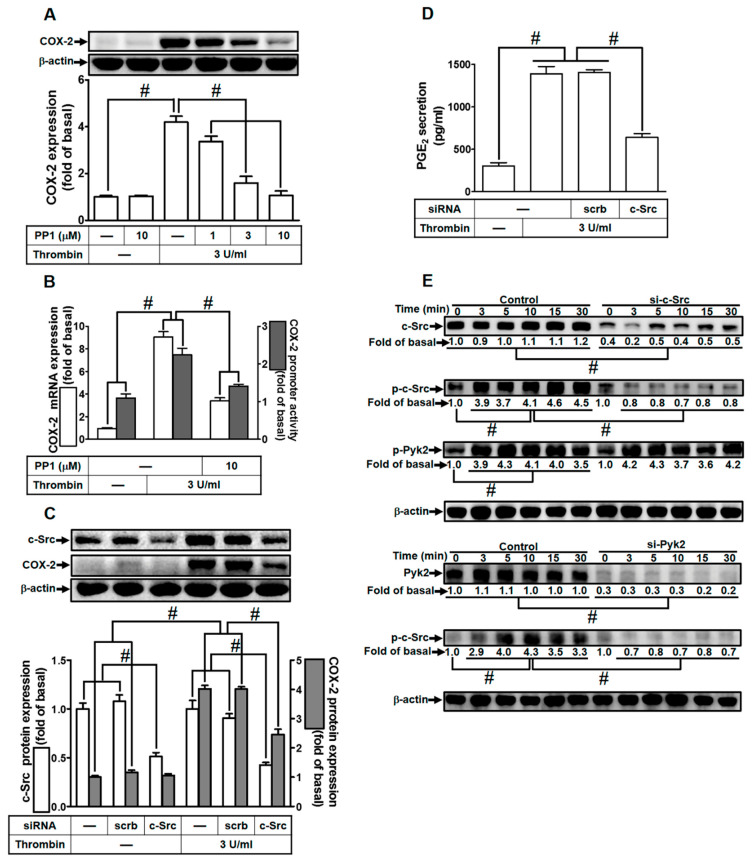
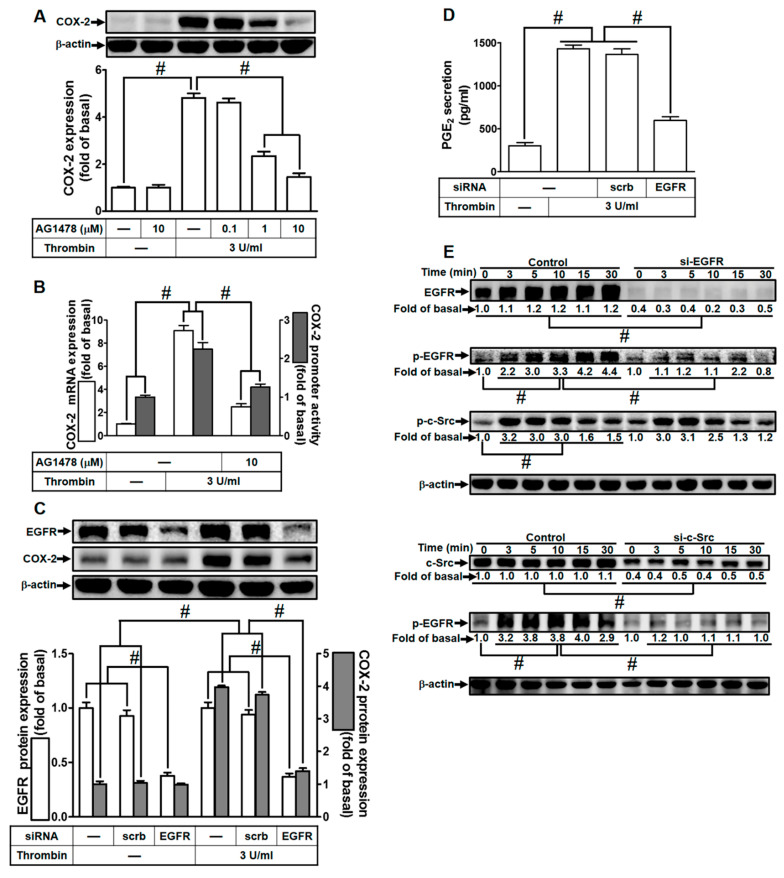
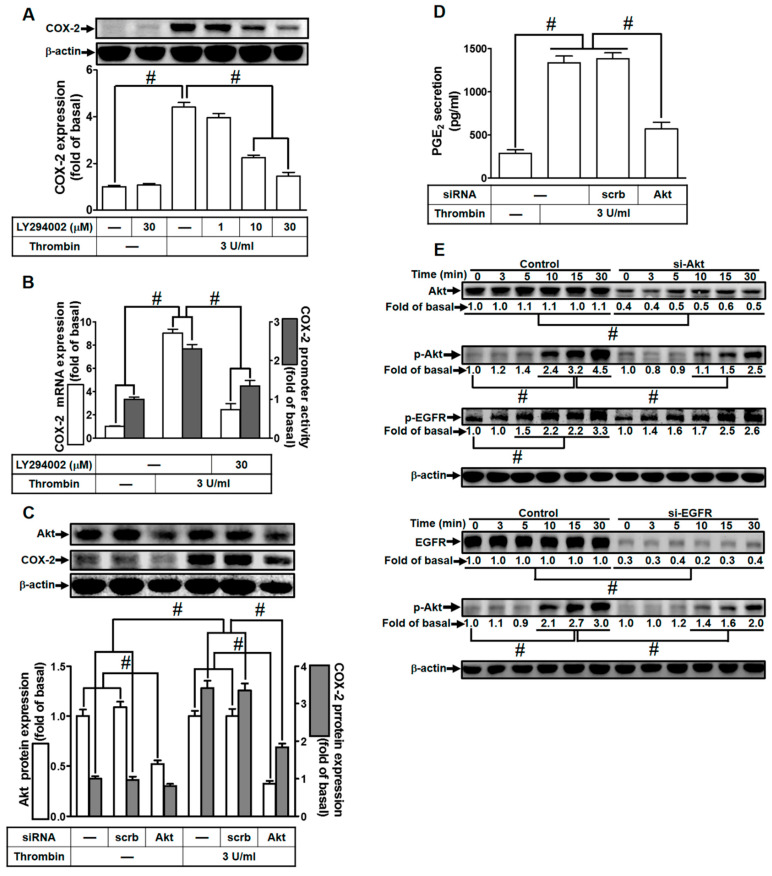
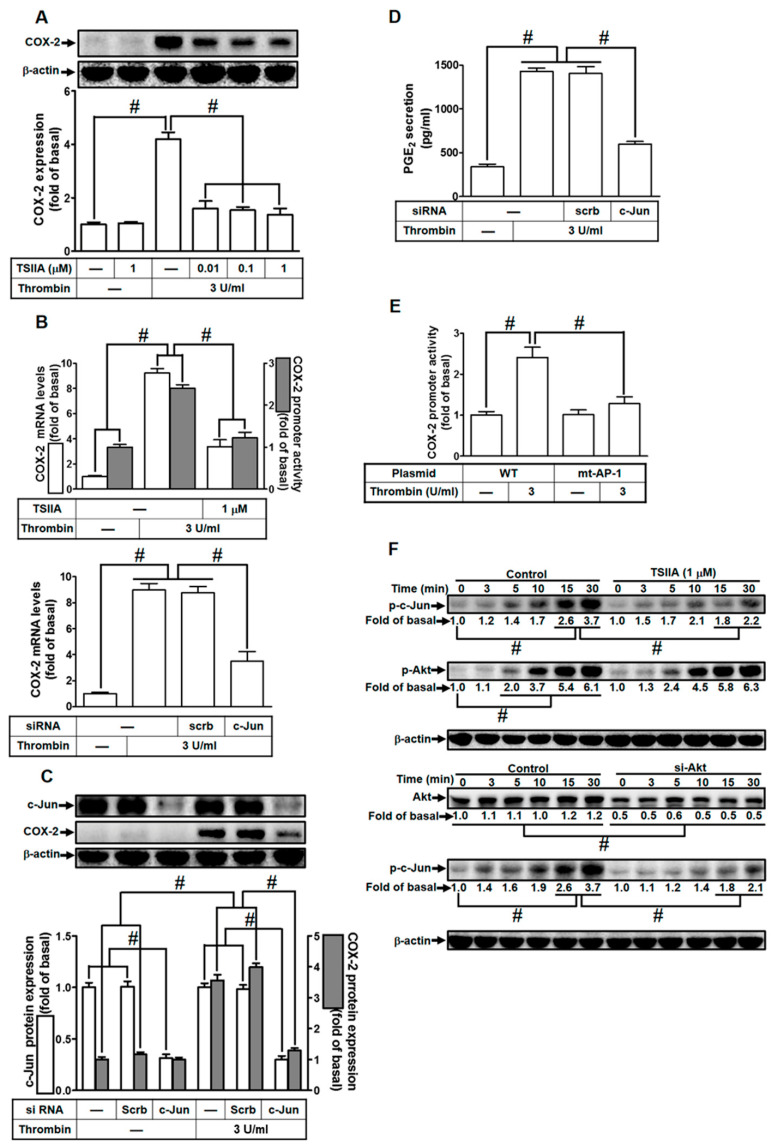
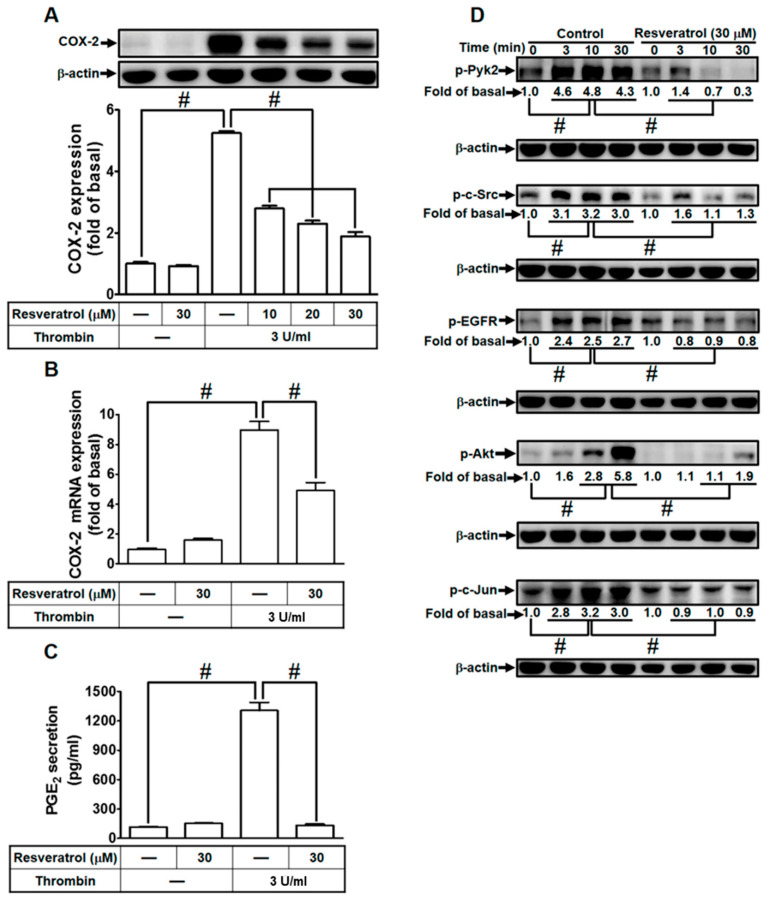
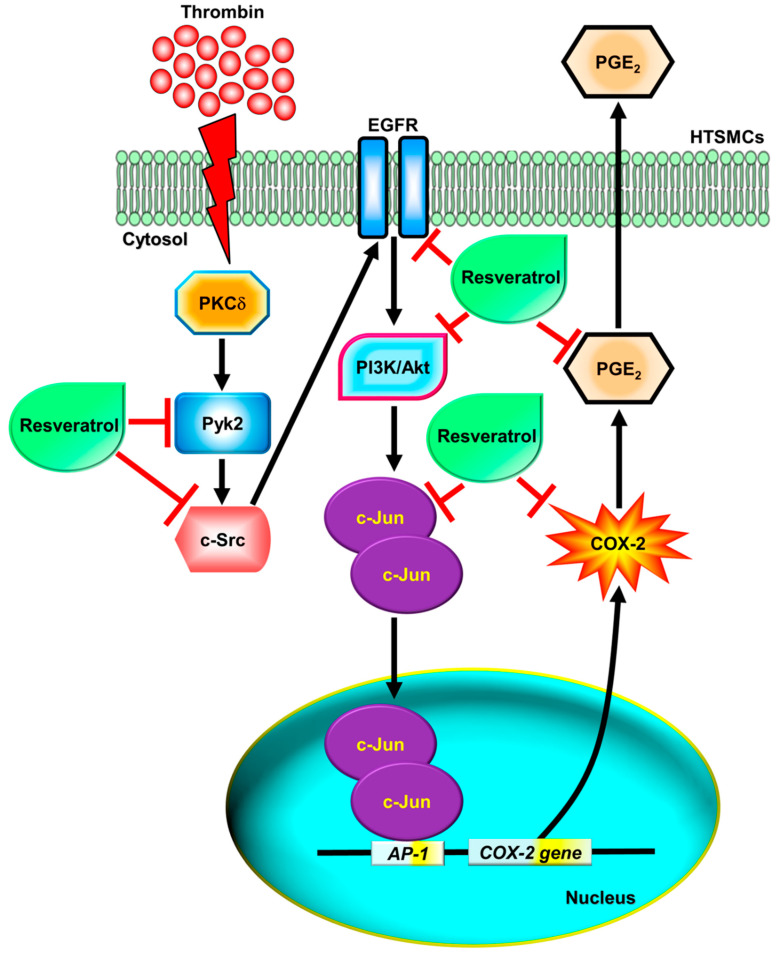
In this study, we confirmed that thrombin significantly increases the production of COX-2 and PGE2 in human tracheal smooth muscle cells (HTSMCs), leading to inflammation in the airways and lungs. These molecules are well-known contributors to various inflammatory diseases. Here, we investigated in detail the involved signaling pathways using specific inhibitors and small interfering RNAs (siRNAs). Our results demonstrated that inhibitors targeting proteins such as protein kinase C (PKC)δ, proline-rich tyrosine kinase 2 (Pyk2), c-Src, epidermal growth factor receptor (EGFR), phosphatidylinositol 3-kinase (PI3K), or activator protein-1 (AP-1) effectively reduced thrombin-induced COX-2 and PGE2 production. Additionally, transfection with siRNAs against PKCδ, Pyk2, c-Src, EGFR, protein kinase B (Akt), or c-Jun mitigated these responses. Furthermore, our observations revealed that thrombin stimulated the phosphorylation of key components of the signaling cascade, including PKCδ, Pyk2, c-Src, EGFR, Akt, and c-Jun. Thrombin activated COX-2 promoter activity through AP-1 activation, a process that was disrupted by a point-mutated AP-1 site within the COX-2 promoter. Finally, resveratrol (one of the most researched natural polyphenols) was found to effectively inhibit thrombin-induced COX-2 expression and PGE2 release in HTSMCs through blocking the activation of Pyk2, c-Src, EGFR, Akt, and c-Jun. In summary, our findings demonstrate that thrombin-induced COX-2 and PGE2 generation involves a PKCδ/Pyk2/c-Src/EGFR/PI3K/Akt-dependent AP-1 activation pathway. This study also suggests the potential use of resveratrol as an intervention for managing airway inflammation.

Keywords: airway inflammation; cyclooxygenase; human tracheal smooth muscle cell; prostaglandin E2; resveratrol; thrombin.


Conflict of interest statement

The authors declare no conflict of interest. The funders had no role in the design of the study; in the collection, analyses, or interpretation of data; in the writing of the manuscript; or in the decision to publish the results.

Figures

Figure 1
Figure 1
Thrombin induces COX-2 expression via PKCδ. (A) Cells were pretreated with Rottlerin (0.1, 0.3, and 1 µM) for 1 h and then incubated with 3 U/mL thrombin for 6 h. COX-2 and β-actin protein levels were determined via Western blot. (B) Cells were pretreated with Rottlerin (1 µM) for 1 h and then incubated with 3 U/mL thrombin for 4 h. COX-2 mRNA levels were determined via real-time PCR (open bars), and COX-2 promoter activity was assessed via promoter assay (gray bars). (C) Cells were transfected with either scrambled or PKCδ siRNA and then incubated with 3 U/mL thrombin for 6 h. Protein levels of PKCδ, COX-2, and β-actin were determined via Western blot. (D) Cells were transfected with either scrambled or PKCδ siRNA and then incubated with 3 U/mL thrombin for the indicated time intervals. Phospho-PKCδ, total PKCδ, and β-actin levels were determined via Western blot. (E) Cells were pretreated with Rottlerin (1 µM) for 1 h and then incubated with 3 U/mL thrombin for 6 h. PGE2 generation was measured. (F) Cells were transfected with either scrambled or PKCδ siRNA and then incubated with 3 U/mL thrombin for 6 h. PGE2 generation was measured. Data are presented as mean ± SEM of three independent experiments (n = 3). # p < 0.05 indicates a significant difference between compared groups.
Figure 2
Figure 2
Thrombin induces COX-2 expression via Pyk2. (A) Cells were pretreated with PF431396 (1, 3, and 5 µM) for 1 h, followed by incubation with 3 U/mL thrombin for 6 h. The levels of COX-2 and β-actin proteins were assessed through Western blot analysis. (B) Cells were pretreated with PF431396 (5 µM) for 1 h and then exposed to 3 U/mL thrombin for 4 h. COX-2 mRNA levels were determined using real-time PCR (open bars), and COX-2 promoter activity was assessed through a promoter assay (gray bars). (C) Cells were transfected with either scrambled or Pyk2 siRNA and subsequently incubated with 3 U/mL thrombin for 6 h. Pyk2, COX-2, and β-actin protein levels were analyzed via Western blot. (D) Cells were transfected with either scrambled or Pyk2 siRNA and then treated with 3 U/mL thrombin for 6 h. PGE2 generation was quantified. (E) Cells were transfected with scrambled, Pyk2, or PKCδ siRNA, respectively, and then incubated with 3 U/mL thrombin for the specified time intervals. The levels of Pyk2, PKCδ, phospho-Pyk2, phospho-PKCδ, and β-actin were determined using Western blot analysis. The data represent the mean ± SEM of three independent experiments (n = 3). # p < 0.05 indicates a significant difference between the compared groups.
Figure 3
Figure 3
Thrombin induces COX-2 expression via c-Src. (A) Cells were pretreated with PP1 (1, 3, and 10 µM) for 1 h and then exposed to 3 U/mL thrombin for 6 h. COX-2 and β-actin protein levels were assessed through Western blot analysis. (B) Cells were pretreated with PP1 (10 µM) for 1 h, followed by incubation with 3 U/mL thrombin for 4 h. COX-2 mRNA levels were determined using real-time PCR (open bars), and COX-2 promoter activity was assessed through a promoter assay (gray bars). (C) Cells were transfected with either scrambled or c-Src siRNA and subsequently exposed to 3 U/mL thrombin for 6 h. Protein levels of c-Src, COX-2, and β-actin were analyzed via Western blot. (D) Cells were transfected with either scrambled or c-Src siRNA and then treated with 3 U/mL thrombin for 6 h. PGE2 generation was quantified. (E) Cells were transfected with scrambled, c-Src, or Pyk2 siRNA, respectively, and then exposed to 3 U/mL thrombin for the specified time intervals. Levels of c-Src, Pyk2, phospho-c-Src, phospho-Pyk2, and β-actin were determined using Western blot analysis. The data represent the mean ± SEM of three independent experiments (n = 3). # p < 0.05 indicates a significant difference between the compared groups.
Figure 4
Figure 4
Thrombin induces COX-2 expression via EGFR. (A) Cells were pretreated with AG1478 (0.1, 1, and 10 µM) for 1 h and subsequently exposed to 3 U/mL thrombin for 6 h. COX-2 and β-actin protein levels were assessed using Western blot analysis. (B) Cells were pretreated with AG1478 (10 µM) for 1 h, followed by incubation with 3 U/mL thrombin for 4 h. COX-2 mRNA levels were determined using real-time PCR (open bars), and COX-2 promoter activity was assessed through a promoter assay (gray bars). (C) Cells were transfected with either scrambled or EGFR siRNA and then incubated with 3 U/mL thrombin for 6 h. Protein levels of EGFR, COX-2, and β-actin were analyzed via Western blot. (D) Cells were transfected with either scrambled or EGFR siRNA and then treated with 3 U/mL thrombin for 6 h. PGE2 generation was quantified. (E) Cells were transfected with scrambled, EGFR, or c-Src siRNA, respectively, and then exposed to 3 U/mL thrombin for the indicated time intervals. Levels of EGFR, c-Src, phospho-EGFR, phospho-c-Src, and β-actin were determined using Western blot analysis. The data represent the mean ± SEM of three independent experiments (n = 3). # p < 0.05 indicates a significant difference between the compared groups.
Figure 5
Figure 5
Thrombin induces COX-2 expression via PI3K/Akt. (A) Cells were pretreated with LY294002 (1, 10, and 30 µM) for 1 h, followed by incubation with 3 U/mL thrombin for 6 h. The levels of COX-2 and β-actin protein were assessed using Western blot analysis. (B) Cells were pretreated with LY294002 (30 µM) for 1 h and then exposed to 3 U/mL thrombin for 4 h. COX-2 mRNA levels were determined via real-time PCR (open bars), and the promoter activity of COX-2 was evaluated through promoter assay (gray bars). (C) Cells were transfected with either scrambled or Akt siRNA and then incubated with 3 U/mL thrombin for 6 h. The protein levels of Akt, COX-2, and β-actin were measured using Western blot analysis. (D) Cells were transfected with either scrambled or Akt siRNA and then incubated with 3 U/mL thrombin for 6 h. PGE2 generation was quantified. (E) Cells were transfected with scrambled, Akt, or EGFR siRNA, respectively, and then treated with 3 U/mL thrombin for the indicated time intervals. The levels of Akt, EGFR, phospho-Akt, phospho-EGFR, and β-actin were analyzed using Western blot. Data are presented as mean ± SEM of three independent experiments (n = 3). # p < 0.05 indicates a significant difference between the compared groups.
Figure 6
Figure 6
Thrombin induces COX-2 expression via AP-1. (A) Cells were preincubated with varying concentrations of Tanshinone IIA (0.01, 0.1, and 1 µM) for 1 h, followed by stimulation with 3 U/mL thrombin for 6 h. Western blot analysis was performed to assess the levels of COX-2 and β-actin proteins. (B) Cells were preincubated with Tanshinone IIA (1 µM) for 1 h and then stimulated with 3 U/mL thrombin for 4 h (upper panel). Real-time PCR was utilized to measure COX-2 mRNA levels (open bars), and promoter activity was evaluated through promoter assay (gray bars). Cells were transfected with either scrambled or c-Jun siRNA and subsequently treated with 3 U/mL thrombin for 4 h (bottom panel). COX-2 mRNA levels were determined via real-time PCR. (C) Cells were transfected with scrambled or c-Jun siRNA and then treated with 3 U/mL thrombin for 6 h. Western blot analysis was performed to assess the levels of c-Jun, COX-2, and β-actin proteins. (D) Cells were transfected with scrambled or c-Jun siRNA and then exposed to 3 U/mL thrombin for 6 h. PGE2 generation was quantified. (E) Cells were transfected with wild-type COX-2 promoter or mutated AP-1 binding site COX-2 promoter and then stimulated with 3 U/mL thrombin for 4 h. Promoter activity of COX-2 was determined using promoter assays. (F) Cells were either preincubated without or with Tanshinone IIA (1 µM) for 1 h, or transfected with scrambled or c-Jun siRNA, respectively. Subsequently, cells were stimulated with 3 U/mL thrombin for the indicated time intervals. Western blot analysis was performed to assess the protein levels of phospho-c-Jun, phospho-Akt, Akt, and β-actin. The data represent the mean ± SEM of three independent experiments (n = 3). # p < 0.05 indicates a significant difference between the compared groups.
Figure 7
Figure 7
Resveratrol mitigates thrombin-induced COX-2 expression and PGE2 secretion through impeding protein kinase activation. (A) Cells were pretreated with resveratrol (10, 20, and 30 µM) for 1 h, followed by incubation with 3 U/mL thrombin for 6 h. Western blot analysis was performed to determine COX-2 and β-actin protein levels. (B) Pretreatment with resveratrol (30 µM) for 1 h, followed by incubation with 3 U/mL thrombin for 4 h, resulted in decreased COX-2 mRNA levels, as assessed via real-time PCR. (C) Cells, pretreated with resveratrol (30 µM) for 1 h, were incubated with 3 U/ml thrombin for 6 h. PGE2 levels in the media were measured using ELISA. (D) Pretreatment with 30 µM resveratrol for 1 h, followed by incubation with 3 U/mL thrombin for various time intervals, showed reduced levels of phospho-Pyk2, phospho-c-Src, phospho-EGFR, phospho-Akt, and phospho-c-Jun, as determined via Western blot with β-actin serving as an internal control. The data represent the mean ± SEM of three independent experiments (n = 3). # p < 0.05, indicating a significant difference between the compared groups.
Figure 8
Figure 8
Schematic diagram illustrating the proposed signaling pathways involved in thrombin-induced COX-2 expression and PGE2 secretion, which are inhibited by resveratrol in HTSMCs. Thrombin induces COX-2 expression and PGE2 generation through a PKCδ/Pyk2/c-Src/EGFR/PI3K/Akt-dependent pathway, leading to AP-1 activation in HTSMCs. Resveratrol inhibits thrombin-induced COX-2 expression and PGE2 generation through blocking the activation of Pyk2, c-Src, EGFR, PI3K/Akt, and c-Jun.

References

    1. Lam M., Lamanna E., Bourke J.E. Regulation of airway smooth muscle contraction in health and disease. Adv. Exp. Med. Biol. 2019;1124:381–422. doi: 10.1007/978-981-13-5895-1_16. - DOI - PubMed
    1. Lee I.T., Yang C.M. Inflammatory signalings involved in airway and pulmonary diseases. Mediat. Inflamm. 2013;2013:791231. doi: 10.1155/2013/791231. - DOI - PMC - PubMed
    1. Kolmert J., Gómez C., Balgoma D., Sjödin M., Bood J., Konradsen J.R., Ericsson M., Thörngren J.O., James A., Mikus M., et al. Urinary Leukotriene E4 and Prostaglandin D2 metabolites increase in adult and childhood severe asthma characterized by type 2 inflammation. A clinical observational study. Am. J. Respir. Crit. Care Med. 2021;203:37–53. doi: 10.1164/rccm.201909-1869OC. - DOI - PMC - PubMed
    1. Pucsok J.M., Györe I., Argay K., Huszár E., Barát E., Pucsok J., Horváth I. Effect of exercise on levels of cyclo-oxygenase mediators in exhaled breath condensate in elite athletes. J. Sports Med. Phys. Fitness. 2007;47:223–227. - PubMed
    1. Lee I.-T., Lee C.-W., Tung W.-H., Wang S.-W., Lin C.-C., Shu J.-C., Yang C.-M. Cooperation of TLR2 with MyD88, PI3K, and Rac1 in lipoteichoic acid–induced cPLA2/COX-2–dependent airway inflammatory responses. Am. J. Pathol. 2010;176:1671–1684. doi: 10.2353/ajpath.2010.090714. - DOI - PMC - PubMed

MeSH terms

LinkOut - more resources