. 2023 Oct 13;24(20):15133.
doi: 10.3390/ijms242015133.

miR-632 Induces DNAJB6 Inhibition Stimulating Endothelial-to-Mesenchymal Transition and Fibrosis in Marfan Syndrome Aortopathy

Affiliations

miR-632 Induces DNAJB6 Inhibition Stimulating Endothelial-to-Mesenchymal Transition and Fibrosis in Marfan Syndrome Aortopathy

Sonia Terriaca et al. Int J Mol Sci. .

Abstract

Marfan syndrome (MFS) is a connective tissue disorder caused by FBN1 gene mutations leading to TGF-β signaling hyperactivation, vascular wall weakness, and thoracic aortic aneurysms (TAAs). The pathogenetic mechanisms are not completely understood and patients undergo early vascular surgery to prevent TAA ruptures. We previously reported miR-632 upregulation in MFS TAA tissues compared with non-genetic TAA tissues. DNAJB6 is a gene target of miR-632 in cancer and plays a critical role in blocking epithelial-to-mesenchymal transition by inhibiting the Wnt/β catenin pathway. TGF-β signaling also activates Wnt/β catenin signaling and induces endothelial-to-mesenchymal transition (End-Mt) and fibrosis. We documented that miR-632 upregulation correlated with DNAJB6 expression in both the endothelium and the tunica media of MFS TAA (p < 0.01). Wnt/β catenin signaling, End-Mt, and fibrosis markers were also upregulated in MFS TAA tissues (p < 0.05, p < 0.01 and p < 0.001). Moreover, miR-632 overexpression inhibited DNAJB6, inducing Wnt/β catenin signaling, as well as End-Mt and fibrosis exacerbation (p < 0.05 and p < 0.01). TGF-β1 treatment also determined miR-632 upregulation (p < 0.01 and p < 0.001), with the consequent activation of the aforementioned processes. Our study provides new insights about the pathogenetic mechanisms in MFS aortopathy. Moreover, the high disease specificity of miR-632 and DNAJB6 suggests new potential prognostic factors and/or therapeutic targets in the progression of MFS aortopathy.

Keywords: DNAJB6; Marfan syndrome; TGF-β1; aortic wall degeneration; endothelial-to-mesenchymal transition; fibrosis; miR-632; thoracic aortic aneurysms.


Conflict of interest statement

The authors declare no conflict of interest.

Figures

Figure 1
Figure 1
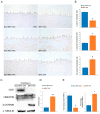
miR-632 upregulation associates with DNAJB6 inhibition in MFS TAAs. (A) Gene expression analysis shows a greater upregulation of miR-632 in the endothelium and the tunica media of MFS compared with non-MFS TAA. (B) Representative images of DNAJB6 immunostaining document the almost complete absence of the protein in MFS TAA. Instead, DNAJB6 expression is evident in the endothelium and the tunica media of non-MFS TAA. Scale bar = 100 µm. (C) Representative blots display an undetectable signal for DNAJB6 in the endothelium and the tunica media of MFS TAA. (D) Gene expression analysis shows a significant downregulation of DNAJB6 in the endothelium and the tunica media of MFS TAA. The results are reported as the mean ± SEM. Immunohistochemical analysis was performed on MFS TAA tissue samples (n = 30) and non-MFS TAA tissue samples (n = 30). Biomolecular analyses were carried out on two different pooled samples (two for non-MFS and two for MFS; five samples for each pool), totaling ten MFS TAA patients and ten non-MFS TAA patients. Unpaired t-test: * indicates p < 0.01; 4 < Cohens’ d < 11.
Figure 2
Figure 2
Endothelial-to-mesenchymal transition is strongly accentuated in MFS TAAs. (A) Representative images and (B) semiquantitative evaluation of CD31, vimentin, and β catenin immunostainings display a reduced percentage of CD31+ cells (arrow heads), as well as an increased percentage of vimentin (arrow heads) and β catenin (arrow heads) in the endothelium of MFS TAA compared with non-MFS TAA. The results are reported as the mean ± SEM. Scale bar = 50 µm. (C) Representative blots and (D) densitometric analysis show a significant downregulation of CD31, as well as an upregulation of vimentin and β catenin in the endothelium of MFS TAA compared with non-MFS TAA. (E) Gene expression analysis documents the transcript levels of CD31 and VIMENTIN in non-MFS TAA and MFS TAA endothelium. Immunohistochemical analysis was performed on MFS TAA tissue samples (n = 30) and non-MFS TAA tissue samples (n = 30). Biomolecular analyses were carried out on two different pooled samples (two for non-MFS and two for MFS; five samples for each pool), totaling ten MFS TAA patients and ten non-MFS TAA patients. Unpaired T-test: * and ** indicate p < 0.05 and p < 0.01, respectively; 1 < Cohen’s d < 7.
Figure 3
Figure 3
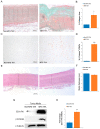
A marked fibrosis is present in the tunica media of MFS TAAs. (A) Representative images and (B) morphometric analysis of Masson’s trichrome-stained tunica media sections display a higher percentage of collagen area in MFS TAA than in non-MFS TAA. Scale bar = 500 µm. The results are reported as the average percentage of the collagen areas ± SEM. (C) Representative images and (D) immunohistochemistry evaluation of β catenin show an increased expression in MFS TAA compared with non-MFS TAA. Scale bar = 100 µm. The results are reported as the average percentage of the positive cells/field (at 20× magnification) ± SEM. (E) Representative images of hematoxylin and eosin-stained aorta tissue sections and (F) morphometric evaluation of medial thickness document similar values for non-MFS TAA and MFS TAA. Scale bar = 0.8 mm. (G) Representative blots for ED-A FN and β catenin display an increased protein expression in MFS TAA media. (H) Gene expression analysis shows a significant upregulation of ED-A FN transcripts in the tunica media of MFS TAA compared with non-MFS TAA. The results are reported as the mean ± SEM. Histochemical and immunohistochemical analyses were performed on MFS TAA tissue samples (n = 30) and non-MFS TAA tissue samples (n = 30). Biomolecular analyses were carried out on two different pooled samples (two for non-MFS and two for MFS; five samples from each pool), totaling ten MFS TAA patients and ten non-MFS TAA patients. Unpaired t-test: *, ** and *** indicate p < 0.05, p < 0.01 and p < 0.001, respectively; 2 < Cohen’s d < 11.
Figure 4
Figure 4
miR-632 overexpression inhibits DNAJB6 levels. (A) Gene expression analysis confirms the overexpression of miR632 in the endothelium and the tunica media of non-MFS TAA transfected with miR-632 mimic (50 µm) at 24 h. (B) DNAJB6 is downregulated in the endothelium and the tunica media of miR-632 mimic-transfected non-MFS TAA. The results are reported as the mean ± SEM. (C) Representative blots confirm the inhibition of DNAJB6 in the endothelium and the tunica media of miR-632 mimic-transfected non-MFS TAA. Experiments were performed in triplicate on one sample at a time for a total of six patients collected in two different pools (two for scramble and two for mimic-632; three samples for each pool). Unpaired t-test: * and ** indicate p < 0.01 and p < 0.001, respectively; 4 < Cohen’s d < 12.
Figure 5
Figure 5
miR-632 overexpression increased endothelial-to-mesenchymal transition and fibrosis. (A) Representative blots and (B) densitometric analysis show a reduced expression of CD31 and increased levels of vimentin and β catenin in the endothelium of miR-632 mimic-transfected non-MFS TAA. (C) Gene expression analysis documents a significant downregulation of CD31 and upregulation of VIMENTIN in the endothelium of miR-632 mimic-transfected non-MFS TAA. (D) Representative blots and (E) densitometric analysis display an increased expression of ED-A FN and β catenin in the tunica media of miR-632 mimic-transfected non-MFS TAA. (F) Gene expression analysis confirms a significant upregulation of ED-A FN in the tunica media of miR-632 mimic-transfected non-MFS TAA. The results are reported as the mean ± SEM. Experiments were performed in triplicate on one sample at a time for a total of six patients collected in two different pools (two for scramble and two for mimic-632; three samples for each pool). Unpaired t-test: * and ** indicate p < 0.05 and p < 0.01, respectively; 2 < Cohen’s d < 11.
Figure 6
Figure 6
Microscopic features of the marked endothelial-to-mesenchymal transition and fibrosis induced by miR-632 overexpression. First row: representative images of hematoxylin and eosin-stained aorta tissue sections of non-MFS TAA transfected with mimic-632 or scramble for 1 week. Scale bar = 200 µm. Rows below: representative images of CD31, vimentin, β catenin, and ED-A FN immunostaining show a reduced percentage of CD31+ cells (arrowheads) and an increased percentage of vimentin and β catenin in the endothelium of miR-632 mimic-transfected non-MFS TAA. Regarding tunica media, representative images of β catenin and ED-A FN immunostainings also document an increased expression of those proteins in miR-632 mimic-transfected fragments. Scale bar = 50 µm. Experiments were performed in triplicate on one sample at a time for a total of six patients.
Figure 7
Figure 7
TGF-β1 treatment inhibits DNAJB6 by miR-632 upregulation. (A,B) Gene expression analysis shows a significant upregulation of miR-632 and DNAJB6 inhibition in the endothelium and the tunica media of TGF-β1-treated non-MFS TAA. The results are reported as the mean ± SEM. (C) Representative blots document the undetectable expression of DNAJB6 in TGF-β1-treated non-MFS TAA tissues. Experiments were performed in triplicate on one sample at a time for a total of six patients collected in two different pools (two for untreated and two for treated; three samples for each pool). Unpaired t-test: *, ** and *** indicate p < 0.05, p < 0.01 and p < 0.001, respectively; 1 < Cohen’s d < 11.
Figure 8
Figure 8
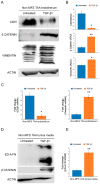
TGF-β1 treatment increases endothelial-to-mesenchymal transition and fibrosis. (A) Representative blots and (B) densitometric analysis show a reduced expression of CD31, as well as a high expression of β catenin and vimentin in the endothelium of TGF-β1-treated non-MFS TAA. (C) Gene expression analysis confirms the CD31 downregulation and the upregulation of VIMENTIN in the endothelium of TGF-β1-treated non-MFS TAA. (D) Representative blots and (E) gene expression analysis document an increased expression of ED-A FN and β catenin in the endothelium of TGF-β1-treated non-MFS TAA. The results are reported as the mean ± SEM. Experiments were performed in triplicate on one sample at a time for a total of six patients collected in two different pools (two for untreated and two for treated; three samples each pool). Unpaired t-test: * and ** indicate p < 0.05 and p < 0.01, respectively; 1 < Cohens’d < 8.
Figure 9
Figure 9
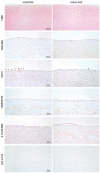
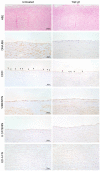
Microscopic features of the marked endothelial-to-mesenchymal transition and fibrosis induced by TGF-β1 treatment. First row: representative images of hematoxylin and eosin-stained aorta tissue sections of non-MFS TAA treated (or not treated) with TGF-β1 (10 ng/mL) for 1 week. Scale bar = 200 µm. Rows below: representative images of CD31, vimentin, β catenin, and ED-A FN immunostaining document the reduced percentage of CD31+ cells (arrowheads) and the increased percentage of vimentin and β catenin in the endothelium of TGF-β1-treated non-MFS TAA. Moreover, representative images of β catenin and ED-A FN immunostaining show the increased expression of those markers in the tunica media of TGF-β1-treated non-MFS TAA. Scale bar = 50 µm. Experiments were performed in triplicate on one sample at a time for a total of six patients.
Figure 10
Figure 10
Schematic summary of the pathogenetic mechanisms induced by TGF-β1/miR-632 signaling in MFS TAA. MFS TAA is characterized by a hyperactivation of the TGF-β1 receptor that induces the upregulation of miR-632. The latter targets DNAJB6 and induces β catenin accumulation, favoring endothelial-to-mesenchymal transition and VSMC dedifferentiation (into myofibroblasts), with the consequent exacerbation of fibrosis.

References

    1. Pyeritz R.E. The Marfan syndrome. Annu. Rev. Med. 2000;51:481–510. doi: 10.1146/annurev.med.51.1.481. - DOI - PubMed
    1. Dietz H.C., Cutting C.R., Pyeritz R.E., Maslen C.L., Sakai L.Y., Corson G.M., Puffenberger E.G., Hamosh A., Nanthakumar E.J., Curristin S.M., et al. Marfan syndrome caused by a recurrent de novo missense mutation in the fibrillin gene. Nature. 1991;352:337–339. doi: 10.1038/352337a0. - DOI - PubMed
    1. Romaniello F., Mazzaglia D., Pellegrino A., Grego S., Fiorito R., Ferlosio A., Chiariello L., Orlandi A. Aortopathy in Marfan syndrome: An update. Cardiovasc. Pathol. 2014;23:261–266. doi: 10.1016/j.carpath.2014.04.007. - DOI - PubMed
    1. Zeigler S.M., Sloan B., Jones J.A. Pathophysiology and Pathogenesis of Marfan Syndrome. Adv. Exp. Med. Biol. 2021;1348:185–206. - PMC - PubMed
    1. Dietz H.C., Loeys B., Carta L., Ramirez F. Recent progress towards a molecular understanding of Marfan syndrome. Am. J. Med. Genet. C Semin. Med. Genet. 2005;139C:4–9. doi: 10.1002/ajmg.c.30068. - DOI - PubMed

LinkOut - more resources