. 2023 Oct 14;24(20):15186.
doi: 10.3390/ijms242015186.

Endoplasmic Reticulum Stress Promotes the Expression of TNF-α in THP-1 Cells by Mechanisms Involving ROS/CHOP/HIF-1α and MAPK/NF-κB Pathways

Affiliations

Endoplasmic Reticulum Stress Promotes the Expression of TNF-α in THP-1 Cells by Mechanisms Involving ROS/CHOP/HIF-1α and MAPK/NF-κB Pathways

Nadeem Akhter et al. Int J Mol Sci. .

Abstract

Obesity and metabolic syndrome involve chronic low-grade inflammation called metabolic inflammation as well as metabolic derangements from increased endotoxin and free fatty acids. It is debated whether the endoplasmic reticulum (ER) stress in monocytic cells can contribute to amplify metabolic inflammation; if so, by which mechanism(s). To test this, metabolic stress was induced in THP-1 cells and primary human monocytes by treatments with lipopolysaccharide (LPS), palmitic acid (PA), or oleic acid (OA), in the presence or absence of the ER stressor thapsigargin (TG). Gene expression of tumor necrosis factor (TNF)-α and markers of ER/oxidative stress were determined by qRT-PCR, TNF-α protein by ELISA, reactive oxygen species (ROS) by DCFH-DA assay, hypoxia-inducible factor 1-alpha (HIF-1α), p38, extracellular signal-regulated kinase (ERK)-1,2, and nuclear factor kappa B (NF-κB) phosphorylation by immunoblotting, and insulin sensitivity by glucose-uptake assay. Regarding clinical analyses, adipose TNF-α was assessed using qRT-PCR/IHC and plasma TNF-α, high-sensitivity C-reactive protein (hs-CRP), malondialdehyde (MDA), and oxidized low-density lipoprotein (OX-LDL) via ELISA. We found that the cooperative interaction between metabolic and ER stresses promoted TNF-α, ROS, CCAAT-enhancer-binding protein homologous protein (CHOP), activating transcription factor 6 (ATF6), superoxide dismutase 2 (SOD2), and nuclear factor erythroid 2-related factor 2 (NRF2) expression (p ≤ 0.0183),. However, glucose uptake was not impaired. TNF-α amplification was dependent on HIF-1α stabilization and p38 MAPK/p65 NF-κB phosphorylation, while the MAPK/NF-κB pathway inhibitors and antioxidants/ROS scavengers such as curcumin, allopurinol, and apocynin attenuated the TNF-α production (p ≤ 0.05). Individuals with obesity displayed increased adipose TNF-α gene/protein expression as well as elevated plasma levels of TNF-α, CRP, MDA, and OX-LDL (p ≤ 0.05). Our findings support a metabolic-ER stress cooperativity model, favoring inflammation by triggering TNF-α production via the ROS/CHOP/HIF-1α and MAPK/NF-κB dependent mechanisms. This study also highlights the therapeutic potential of antioxidants in inflammatory conditions involving metabolic/ER stresses.

Keywords: CHOP; ER stress; HIF-1α; MAPK/NF-κB; ROS; TNF-α; inflammation; metabolic stress; metabolic syndrome; obesity.


Conflict of interest statement

The authors declare no conflict of interest. The funders had no role in the design of the study; in the collection, analyses, or interpretation of data; in the writing of the manuscript; or in the decision to publish the results.

Figures

Figure 1
Figure 1
ER stress promotes the metabolic stress-induced TNF-α mRNA/protein expression in monocytic cells. THP-1 cells were seeded (1 × 10⁶ cells/mL/well) in triplicate wells of 12-well plates and treated with different metabolic stress inducers including LPS (10 ng/mL), PA (200 μM), and OA (200 μM), in presence or absence of the ER stressor thapsigargin (TG, 1 μM), while control was treated with the vehicle (0.1% BSA) only, and the cells were incubated for 24 h. Total RNA was extracted from cells for measuring TNF-α gene expression using qRT-PCR and cell supernatants were used to detect levels of TNF-α secreted protein via ELISA as described in Section 4. Similar results were obtained from three independent experiments. Data (expressed as mean ± SEM) were analyzed using one-way ANOVA, Tukey’s multiple comparisons test, and p-values ≤ 0.05 were considered significant. The representative data show that the ER stress (TG treatment) increases: (A) TNF-α mRNA expression in monocytic cells that were treated with LPS (bars 2 vs. 6), PA (bars 3 vs. 7), and OA (bars 4 vs. 8); and (B) TNF-α secreted protein levels in response to treatments with LPS (bars 2 vs. 6), PA (bars 3 vs. 7), and OA (bars 4 vs. 8). p-values ≤ 0.0484. However, the difference between TNF-α protein induction by OA+TG co-stimulation and OA stimulation alone did not reach statistical significance (p = 0.0783).
Figure 2
Figure 2
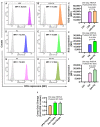
Metabolic and ER stresses induce the intracellular reactive oxygen species (ROS). THP-1 cells were plated (1 × 10⁶ cells/mL/well) in triplicate wells of 12-well plates and treated with LPS (10 ng/mL), PA (200 μM), and OA (200 μM), in presence or absence of the ER stressor thapsigargin (TG, 1 μM) while control was treated with vehicle (0.1% BSA) only, and the cells were incubated for 24 h. Intracellular ROS was measured using DCFH-DA assay and flow cytometry as described in Section 4. Similar results were obtained from three independent experiments. Data (expressed as mean ± SEM) were analyzed using one-way ANOVA, Tukey’s multiple comparisons test, and p-values ≤ 0.05 were considered significant. The representative data show that the ER stress (TG treatment) promotes the ROS in cells that are metabolically stressed from treatments involving: (AC) LPS, (DF) PA, and (GI) OA (p ≤ 0.0183). The maximum ROS induction was noted for (C) LPS+TG treatment (MFI: 41,392 ± 527.10), followed by (F) PA+TG treatment (MFI: 19,584 ± 200.90) and (I) OA+TG treatment (MFI: 17,844 ± 243.10). (J) The relative ROS induction by TG, comparing the normalized ratios, was the highest for PA (1.41 ± 0.01 fold increase), followed in order by OA (1.38 ± 0.08 fold increase), and LPS (1.08 ± 0.03 fold increase). Significant inductions by PA (** p = 0.007) and OA (* p = 0.011) were observed, compared with LPS.
Figure 3
Figure 3
Metabolic stress induces or promotes ER stress. THP-1 cells were dispensed (1 × 10⁶ cells/mL/well) in triplicate wells of 12-well plates and treated with LPS (10 ng/mL), PA (200 μM), and OA (200 μM), in presence or absence of ER stress inducer thapsigargin (TG, 1 μM) while control was treated with the vehicle (0.1% BSA) only, and the cells were incubated for 24 h. Total RNA was extracted and the gene expression of ER stress markers including CHOP, ATF6, and IRE1α was determined using qRT-PCR as described in Section 4. Similar results were obtained from three independent experiments. Data (expressed as mean ± SEM) were analyzed using one-way ANOVA, Tukey’s/Dunnett’s multiple comparisons test, and p-values ≤ 0.05 were considered significant. The representative data show, compared with control, the increased: (A) CHOP mRNA levels in cells treated with PA, TG, LPS+TG, PA+TG, and OA+TG; (B) ATF6 mRNA levels in cells treated with LPS, TG, LPS+TG, and PA+TG; and (C) IRE1α mRNA levels in cells treated with OA and PA+TG. Statistical significance is shown as * p < 0.05, ** p < 0.01, and **** p < 0.0001, compared with respective control (vehicle treatment).
Figure 4
Figure 4
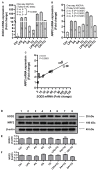
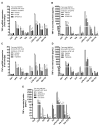
Metabolic and/or ER stress(es) activate(s) the antioxidant defense mechanisms. THP-1 cells were seeded (1 × 10⁶ cells/mL/well) in triplicate wells of 12-well plates and treated with LPS (10 ng/mL), PA (200 μM), and OA (200 μM), in presence or absence of the ER stress inducer thapsigargin (TG) (1 μM) while control (Ctrl) was treated with the vehicle (0.1% BSA) only, and the cells were incubated for 24 h. Total RNA was extracted and the gene expression of SOD2 and NRF2 was determined using qRT-PCR while SOD2 and NRF2 protein expression in cell lysates was assessed using Western blotting as described in Section 4. Similar results were obtained from two independent experiments. Data (expressed as mean ± SEM) were analyzed using one-way ANOVA, Tukey’s or Dunnett’s multiple comparisons test, as appropriate. All p-values ≤ 0.05 were considered significant. The representative data show that metabolic and/or ER stress(es) upregulate(s) the mRNA expression of (A) SOD2 and (B) NRF2 in monocytic cells (p < 0.0001); except NRF2 expression in response to OA+TG treatment (p = 0.5261). (C) Based on gene expression data, a strong agreement was found between SOD2 and NRF2 (r = 0.91, p ˂ 0.0001). (D) Immunoblots show SOD2 and NRF2 expression in response to metabolic and/or ER stress treatments in THP-1 cells. (E,F) Increased expression of SOD2 (p = 0.0006) and NRF2 (p = 0.0016) was induced by THP-1 cell treatment with PA+TG, as compared to treatment with PA alone. ** p < 0.01 and *** p < 0.001.
Figure 5
Figure 5
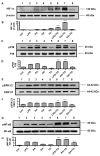
Metabolic and ER stresses co-induce stabilization of HIF-1α and phosphorylation of p38 MAPK/NFκB signaling proteins. THP-1 cells seeded at a cell density of 1 × 10⁶ cells/mL in triplicate wells of 12-well plates were treated with LPS (10 ng/mL for 30 min), PA (200 μM for 2 h), and OA (200 μM for 2 h), in presence and absence of ER stressor TG (1 μM for 24 h), while control was treated with vehicle (0.1% BSA) only. Cells were lysed in RIPA buffer for total protein extraction, resolved by 12% SDS-PAGE, and immunoblots were analyzed for the expression of HIF-1α, β-actin, phospho/total p38, phospho/total ERK1/2, and phospho/total NF-κB, as described in Section 4. Similar results were obtained from three independent experiments. Data (expressed as mean ± SEM) were analyzed using one-way ANOVA, Tukey’s multiple comparisons test, and p-values ≤ 0.05 were considered significant. The representative data show, compared with respective controls, increased levels of: (A,B) HIF-1α expression in cells treated with LPS+TG and PA+TG; (C,D) p38 phosphorylation in cells treated with LPS+TG and PA+TG; (E,F) ERK1/2 phosphorylation in cells treated with PA+TG; and (G,H) NF-κB phosphorylation in cells treated with LPS+TG, PA+TG, and OA+TG. Statistical significance is shown for differences, compared with respective treatment without TG. *** p < 0.001 and **** p < 0.0001.
Figure 6
Figure 6
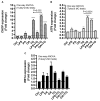
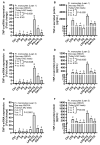
Inhibition of MAPK/NFκB-mediated signaling or ROS scavenging suppresses the TNF-α expression in THP-1 cells. The cells were plated at a cell density of 1 × 10⁶ cells/mL/well in triplicate wells of 12-well plates. Cells were pre-treated (for 2 h) with pharmacological inhibitors of MAPK (U0126 and SP600125) and NF-κB (NDGA and Triptolide) pathways, or incubated for 1 h in designated wells with allopurinol (100 μM), apocynin (100 μM), and curcumin (10 μM), followed by stimulation with LPS (10 ng/mL), PA (200 μM), and OA (200 μM), with or without ER stressor thapsigargin (TG, 1 μM). In stimulation control wells, cells were either left untreated (blank) or pre-treated (separately) with inhibitors/antioxidants, followed by stimulation of all cells using vehicle (0.1% BSA) only. In inhibitor/antioxidant control wells for each stimulation, cells were pre-treated with vehicle (0.1% BSA) and later stimulated likewise other cells that were pre-treated with pathway inhibitors or antioxidants. After 24 h incubation, total RNA was extracted for determining TNF-α mRNA expression via qRT-PCR and cell supernatants were analyzed for TNF-α secreted protein levels using ELISA as described in Section 4. Similar results were obtained from three independent experiments. Data (expressed as mean ± SEM) were analyzed using two-way ANOVA (Dunnett’s multiple comparisons test) and p-values ≤ 0.05 were considered significant. The representative data show that, compared with respective controls, inhibition of the MAPK and NF-κB pathways led to a significant suppression of TNF-α at the (A,B) transcriptional (mRNA) and (C,D) translational (protein) levels. However, inhibition of the NF-κB pathway (using NDGA and Triptolide) did not cause a significant reduction in TNF-α secretion in response to cell co-stimulation with OA+TG. (E) Similarly, THP-1 cell priming with antioxidants or ROS scavengers led to a significant suppression of TNF-α production by THP-1 cells. Statistical significance is shown as * p < 0.05, ** p < 0.01, *** p < 0.001, and **** p < 0.0001, compared with respective vehicle control.
Figure 7
Figure 7
Increased TNF-α expression in primary monocytes isolated from lean individuals, following co-stimulation with metabolic (lipotoxic) and ER stresses. Primary monocytes were isolated from the peripheral blood mononuclear cells (PBMCs) of three healthy lean individuals (BMI: 23.40 ± 0.35 kg/m2) and the cells were stimulated with LPS (10 ng/mL), PA (200 μM), and OA (200 μM), with or without ER stressor thapsigargin (TG) (1 μM), while cells treated with vehicle only represent control (Ctrl). TNF-α gene and secreted protein expression was determined using qRT-PCR and ELISA, respectively, as described in Section 4. Similar results were obtained from three independent experiments. Data (mean ± SEM) were analyzed using one-way ANOVA and group means were compared using Tukey’s multiple comparisons test. All p-values ≤ 0.05 were considered significant. The representative data show increased TNF-α mRNA and secreted protein expression in samples from: (A,B) lean 1; (C,D) lean 2; and (E,F) lean 3 blood donors.
Figure 8
Figure 8
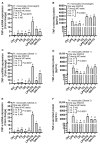
Increased TNF-α expression in primary monocytes isolated from overweight/obese individuals, following co-stimulation with metabolic (lipotoxic) and ER stresses. Primary monocytes were isolated from the peripheral blood mononuclear cells (PBMCs) of one overweight (BMI: 29.20 kg/m2) and two obese (BMI: 31.50 ± 0.1 kg/m2) individuals and monocytes were stimulated with LPS (10 ng/mL), PA (200 μM), and OA (200 μM), with or without ER stressor thapsigargin (TG) (1 μM), while cells treated with vehicle only represent control (Ctrl). TNF-α gene and secreted protein expression was determined using qRT-PCR and ELISA, respectively, as described in Section 4. Similar results were obtained from three independent experiments. Data (mean ± SEM) were analyzed using one-way ANOVA and group means were compared using Tukey’s multiple comparisons test. All p-values ≤ 0.05 were considered significant. The representative data show elevated TNF-α mRNA and secreted protein expression in: (A,B) overweight; (C,D) obese 1; and (E,F) obese 2 blood donors.
Figure 9
Figure 9
Metabolic/ER stresses upregulate CHOP mRNA expression in primary human monocytes from healthy lean and overweight/obese individuals. Primary monocytes were isolated from the peripheral blood samples from three healthy lean (BMI: 23.40 ± 0.35 kg/m2), one overweight (BMI: 29.20 kg/m2), and two obese (BMI: 31.50 ± 0.1 kg/m2) individuals. The cells plated in designated triplicate wells were stimulated with LPS (10 ng/mL), PA (200 μM), or OA (200 μM), in presence or absence of TG (1 μM) while control (Ctrl) wells were treated with vehicle (0.1% BSA) only. The cells were incubated for 24 h, total RNA was extracted and CHOP expression was determined using qRT-PCR as described in Section 4. Similar results were obtained from three independent experiments. Data (expressed as mean ± SEM) were analyzed using one-way ANOVA, Tukey’s multiple comparisons test, and p-values ≤ 0.05 were considered significant. The representative data show upregulated CHOP mRNA expression after co-stimulations with LPS+TG, PA+TG, or OA+TG, compared with respective controls without TG, in primary monocytes derived from blood of (A) lean and (B) overweight/obese individuals.
Figure 10
Figure 10
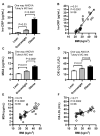
Individuals with obesity display increased expression of systemic inflammatory and oxidative stress biomarkers. Plasma samples were collected from lean (BMI: 21.69 ± 0.56 kg/m2), overweight (BMI: 27.71 ± 0.38 kg/m2), and obese (BMI: 39.51 ± 2.17 kg/m2) individuals (cohort 2), 12 each, and assessed the levels of high-sensitivity C-reactive protein (hs-CRP), malondialdehyde (MDA), and oxidized low-density lipoprotein (OX-LDL) using commercial kits, as described in Section 4. Similar results were obtained from three independent experiments. Data (expressed as mean ± SEM) were analyzed using one-way ANOVA and group means were compared using Tukey’s multiple comparisons test. Spearman correlation test was used to determine associations between variables. All p-values ≤ 0.05 were considered significant. (A) Increased hs-CRP levels are shown in obese, compared with lean and overweight counterparts (p < 0.0001). (B) hs-CRP levels were positively associated with BMI (r = 0.91, p ˂ 0.0001). (C) Elevated levels of MDA are shown in obese, compared with lean and overweight individuals (p < 0.0001). (D) Increased OX-LDL levels are shown in obese compared with lean and overweight counterparts (p ≤ 0.03). (E) MDA levels were positively correlated with BMI (r = 0.76, p ˂ 0.0001). (F) OX-LDL levels were positively associated with BMI (r = 0.77, p = 0.0002).
Figure 11
Figure 11
A schematic illustrating the cooperative mechanism between the ER and metabolic/lipotoxic stresses, leading to expression of TNF-α as well as markers representing ER stress (CHOP, ATF6) and antioxidant defense (SOD2, NRF2). ER: endoplasmic reticulum; LPS: lipopolysaccharide; PA: palmitate; OA: oleate; TG: thapsigargin; CHOP: C/EBP homologous protein; ATF6: activating transcription factor 6; SOD2: superoxide dismutase-2 (also known as MnSOD); NRF2: nuclear factor erythroid 2-related factor 2; HIF-1α: hypoxia-inducible factor 1-alpha; MAPKs: mitogen-activated protein kinases; NF-κB: nuclear factor kappa B. ROS: reactive oxygen species, e.g., superoxide (O2), hydrogen peroxide (H2O2), and hydroxyl radical (OH). The figure was created using BioRender.com. Increased expression is shown by arrows (formula image or formula image).

References

    1. Zelová H., Hošek J. TNF-α signalling and inflammation: Interactions between old acquaintances. Inflamm. Res. 2013;62:641–651. doi: 10.1007/s00011-013-0633-0. - DOI - PubMed
    1. Ross R. Atherosclerosis—An inflammatory disease. N. Engl. J. Med. 1999;340:115–126. doi: 10.1056/NEJM199901143400207. - DOI - PubMed
    1. Mukhopadhyay S., Hoidal J.R., Mukherjee T.K. Role of TNFalpha in pulmonary pathophysiology. Respir. Res. 2006;7:125. doi: 10.1186/1465-9921-7-125. - DOI - PMC - PubMed
    1. Zhang H., Park Y., Wu J., Chen X., Lee S., Yang J., Dellsperger K.C., Zhang C. Role of TNF-alpha in vascular dysfunction. Clin. Sci. 2009;116:219–230. doi: 10.1042/CS20080196. - DOI - PMC - PubMed
    1. Montgomery S.L., Bowers W.J. Tumor necrosis factor-alpha and the roles it plays in homeostatic and degenerative processes within the central nervous system. J. Neuroimmune Pharmacol. 2012;7:42–59. doi: 10.1007/s11481-011-9287-2. - DOI - PubMed