. 2023 Oct 18;24(20):15288.
doi: 10.3390/ijms242015288.

Side-Chain Immune Oxysterols Induce Neuroinflammation by Activating Microglia

Affiliations

Side-Chain Immune Oxysterols Induce Neuroinflammation by Activating Microglia

Yonghae Son et al. Int J Mol Sci. .

Abstract

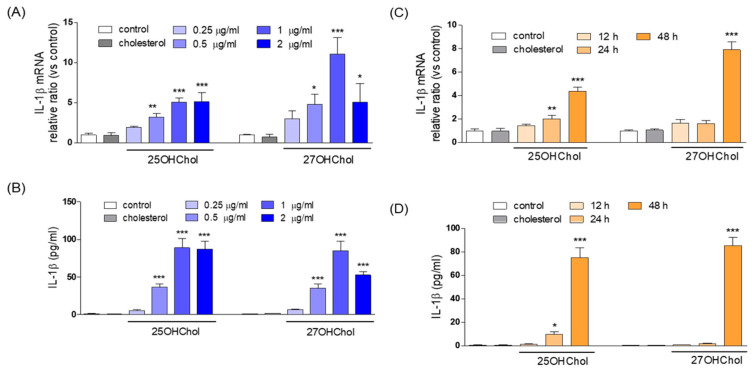
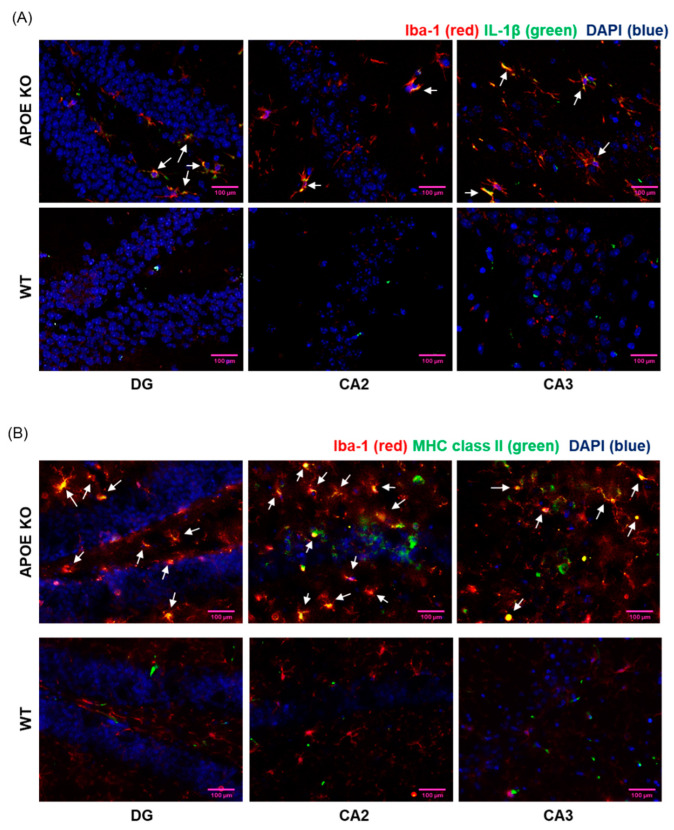
In individuals with Alzheimer's disease, the brain exhibits elevated levels of IL-1β and oxygenated cholesterol molecules (oxysterols). This study aimed to investigate the effects of side-chain oxysterols on IL-1β expression using HMC3 microglial cells and ApoE-deficient mice. Treatment of HMC3 cells with 25-hydroxycholesterol (25OHChol) and 27-hydroxycholesterol (27OHChol) led to increased IL-1β expression at the transcript and protein levels. Additionally, these oxysterols upregulated the surface expression of MHC II, a marker of activated microglia. Immunohistochemistry performed on the mice showed increased microglial expression of IL-1β and MHC II when fed a high-cholesterol diet. However, cholesterol and 24s-hydroxycholesterol did not increase IL-1β transcript levels or MHC II expression. The extent of IL-1β increase induced by 25OHChol and 27OHChol was comparable to that caused by oligomeric β-amyloid, and the IL-1β expression induced by the oxysterols was not impaired by polymyxin B, which inhibited lipopolysaccharide-induced IL-1β expression. Both oxysterols enhanced the phosphorylation of Akt, ERK, and Src, and inhibition of these kinase pathways with pharmacological inhibitors suppressed the expression of IL-1β and MHC II. The pharmacological agents chlorpromazine and cyclosporin A also impaired the oxysterol-induced expression of IL-1β and upregulation of MHC II. Overall, these findings suggest that dysregulated cholesterol metabolism leading to elevated levels of side-chain oxysterols, such as 25OHChol and 27OHChol, can activate microglia to secrete IL-1β through a mechanism amenable to pharmacologic intervention. The activation of microglia and subsequent neuroinflammation elicited by the immune oxysterols can contribute to the development of neurodegenerative diseases.

Keywords: immune oxysterol; interleukin-1β; microglia; neuroinflammation.


Conflict of interest statement

The authors declare no conflict of interest.

Figures

Figure 1
Figure 1
The effects of side chain oxysterols, Aβ1–42, and LPS on the microglial expression of IL-1β. HMC3 cells (1 × 10⁶ cells/dish) were treated for 48 h with cholesterol or the indicated oxysterols (1 μg/mL each). (A) IL-1β transcripts were detected by RT-PCR and levels of IL-1β transcripts were analyzed by qPCR. The y-axis values represent fold increases in IL-1β mRNA levels normalized to GAPDH levels relative to that of the untreated microglia (control). * p < 0.05 vs. control; *** p < 0.001 vs. control. (B) The concentrations of IL-1β secreted from cells to the culture medium were quantitatively detected by ELISA. *** p < 0.001 vs. control. (C) The cells were stimulated with 5 and 10 μM of Aβ1–42 or with 25OHChol or 27OHChol (1 μg/mL each) for 48 h. Using total RNA isolated from cells, IL-1β transcripts were detected by RT-PCR, and levels of IL-1β transcripts were assessed by qPCR. (D) The amounts of IL-1β released into culture media were quantitatively measured by ELISA. *** p < 0.001 vs. control; ** p < 0.01 vs. control. Data are expressed as the mean ± SD (n = 3 replicates for each group). (E) The cells were treated with the indicated oxysterols (1 μg/mL each) and LPS (100 ng/mL) in the absence or presence of polymyxin B (10 μg/mL) for 48 h. IL-1β transcripts were detected and assessed by RT-PCR and qPCR, respectively, and (F) the amounts of IL-1β secreted to culture media were measured by ELISA. *** p < 0.001 vs. control; ## p < 0.01 vs. LPS. Data are representative of three independent experiments and are expressed as mean ± SD (n = 3 replicates for each group).
Figure 2
Figure 2
Concentration and time-course effects of 25OHChol and 27OHChol on IL-1β expression. Microglia were treated with the indicated concentrations of 25OHChol and 27OHChol for 48 h. Levels of IL-1β transcripts were assessed by qPCR (A), and concentrations of IL-1β protein secreted to the medium were quantitatively detected by ELISA (B). *** p < 0.001 vs. control; ** p < 0.01 vs. control; and * p < 0.05 vs. control. Data are expressed as the mean ± SD (n = 3 replicates for each group). Following treatment of microglia with 25OHChol and 27OHChol (1 μg/mL each) for the indicated periods, levels of IL-1β transcripts and secreted IL-1β protein were measured by qPCR (C) and by ELISA (D), respectively. *** p < 0.001 vs. control; ** p < 0.01 vs. control; and * p < 0.05 vs. control. Data are expressed as the mean ± SD (n = 3 replicates for each group).
Figure 3
Figure 3
Effects of protein kinase inhibitors on IL-1β expression induced by the oxysterols. (A) Cell lysates were obtained after treatment of microglia with 25OHChol or 27OHChol (1 μg/mL) for the indicated periods. Following the determination of protein concentrations, an equal amount of protein was analyzed by Western blotting using Abs against phosphorylated and unphosphorylated forms of Akt, ERk1/2, and Src. Results are representative of three independent experiments. Microglia were treated with 25OHChol and 27OHChol for 48 h in the absence or presence of the indicated kinase inhibitors (10 μM each). Levels of IL-1β transcripts were assessed by qPCR (B), and the amounts of IL-1β protein released from cells were measured by ELISA (C). *** p < 0.001 vs. control; ### p < 0.001 vs. 25OHChol or 27OHChol; and ## p < 0.01 vs. 25OHChol. Data are expressed as the mean ± SD (n = 3 replicates for each group).
Figure 4
Figure 4
Enhanced MHC II expression on the microglial surface following treatment with side-chain oxysterols. HMC3 microglial cells were seeded on coverslips and treated for 48 h with cholesterol, 24sOHChol, 25OHCho1, and 27OHChol (1 μg/mL each). The cells were immunostained with a fluorescence-conjugated antibody against MHC II (green). The nuclei were stained with DAPI (blue). The fluorescence signal representing MHC II was visualized using a confocal microscope at a magnification of 200×. The data presented are representative of three independent experiments.
Figure 5
Figure 5
Microglial activation in the brain of ApoE-deficient mice fed HFD (n = 10). The brain sections prepared from wild-type (WT) and ApoE-deficient (ApoE-KO) mice were immunostained with fluorescence-conjugated antibodies. After staining the nuclei with DAPI (blue), the fluorescence was visualized by confocal microscopy. (A) The sections were labeled with antibodies against anti-Iba-1 (red) and anti-IL-1β (green). Co-localized regions are indicated by white arrows. (B) The sections were labeled with anti-Iba-1 (red) and anti-MHC II (green) antibodies. Co-localized images are indicated by white arrows. The images presented are representative of three samples, and the results are representative of three independent experiments. Scale bars represent 100 μm.
Figure 6
Figure 6
Impaired microglial expression of IL-1β by treatment with CsA and CPZ. Microglial cells (1 × 10⁶ cell/dish) were stimulated for 48 h with 1 μg/mL of the indicated oxysterol in the presence of CPZ (2 μM), CsA (50 nM), or Df (25 μg/mL). (A) Total RNA was isolated from the cells, and levels of IL-1β transcripts were measured by qPCR. (B) The amounts of secreted IL-1β in culture media were quantitatively detected by ELISA. *** p < 0.01 vs. control; ### p < 0.01 vs. oxysterols. After treatment of the cells for 48 h with 1 μg/mL of 25OHChol or 27OHChol in the presence of the indicated concentrations of CsA (C) and CPZ (D), IL-1β transcript levels were assessed by qPCR to calculate the IC50 values. The results are representative of three independent experiments.

Similar articles

Cited by

References

    1. Hughes T.M., Rosano C., Evans R.W., Kuller L.H. Brain cholesterol metabolism, oxysterols, and dementia. J. Alzheimers Dis. 2013;33:891–911. doi: 10.3233/JAD-2012-121585. - DOI - PMC - PubMed
    1. Bjorkhem I., Meaney S. Brain cholesterol: Long secret life behind a barrier. Arter. Thromb. Vasc. Biol. 2004;24:806–815. doi: 10.1161/01.ATV.0000120374.59826.1b. - DOI - PubMed
    1. Feringa F.M., van der Kant R. Cholesterol and Alzheimer’s Disease; From Risk Genes to Pathological Effects. Front. Aging Neurosci. 2021;13:690372. doi: 10.3389/fnagi.2021.690372. - DOI - PMC - PubMed
    1. Dai L., Zou L., Meng L., Qiang G., Yan M., Zhang Z. Cholesterol Metabolism in Neurodegenerative Diseases: Molecular Mechanisms and Therapeutic Targets. Mol. Neurobiol. 2021;58:2183–2201. doi: 10.1007/s12035-020-02232-6. - DOI - PubMed
    1. Bjorkhem I., Diczfalusy U. Oxysterols: Friends, foes, or just fellow passengers? Arter. Thromb. Vasc. Biol. 2002;22:734–742. doi: 10.1161/01.ATV.0000013312.32196.49. - DOI - PubMed