

A Therapeutic DNA Vaccine Targeting HPV16 E7 in Combination with Anti-PD-1/PD-L1 Enhanced Tumor Regression and Cytotoxic Immune Responses
- PMID: 37895145
- PMCID: PMC10607554
- DOI: 10.3390/ijms242015469
A Therapeutic DNA Vaccine Targeting HPV16 E7 in Combination with Anti-PD-1/PD-L1 Enhanced Tumor Regression and Cytotoxic Immune Responses
Abstract
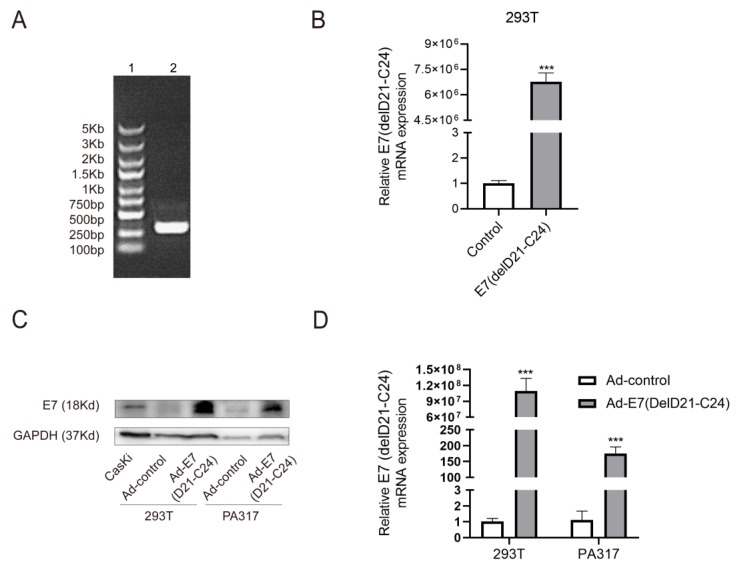
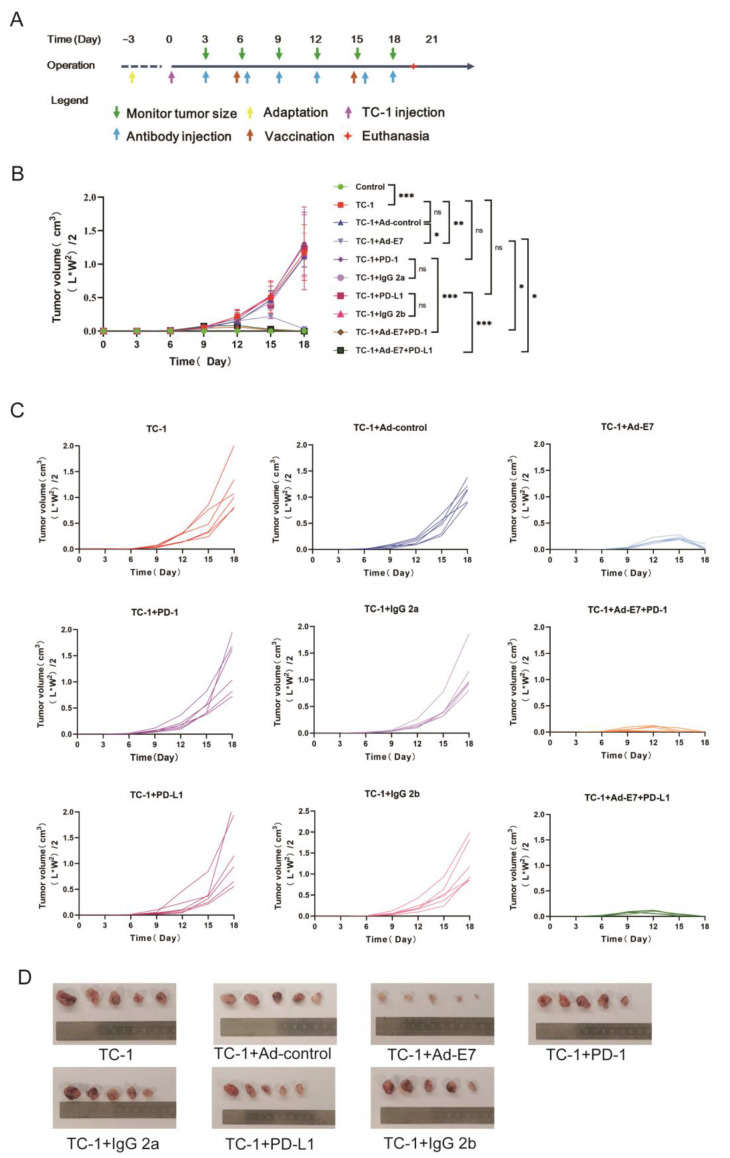
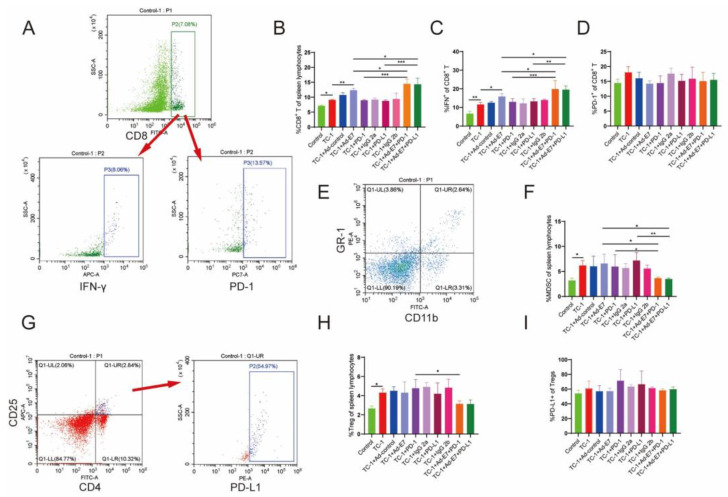
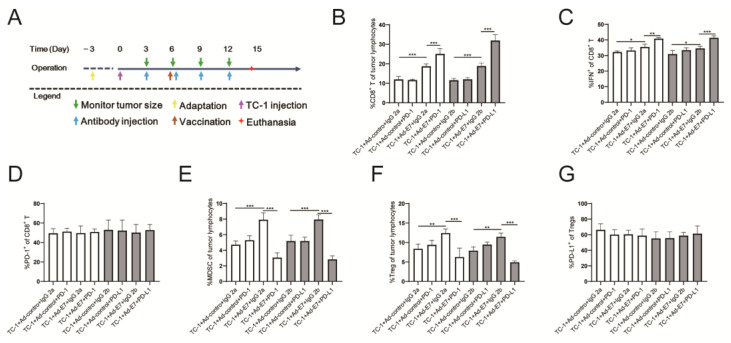
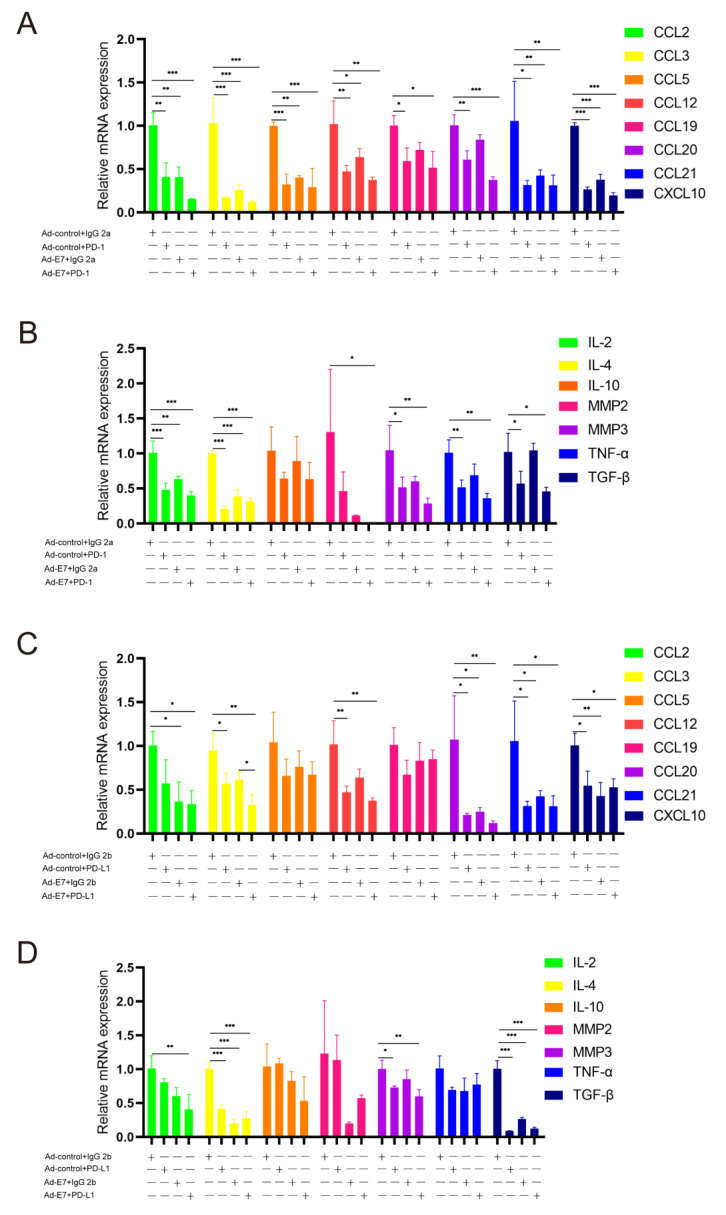
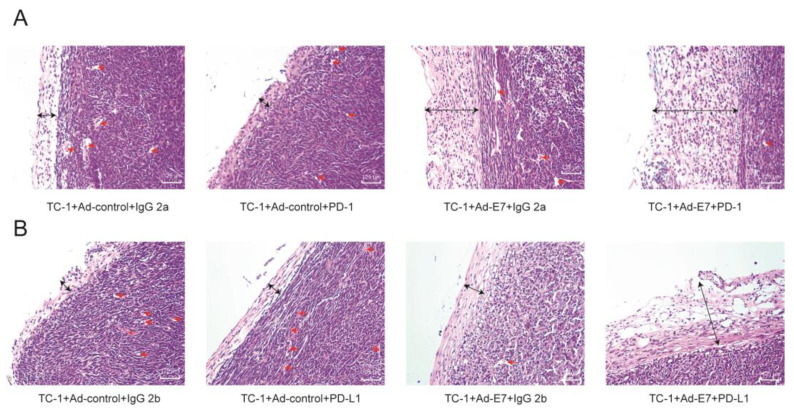
Persistent infection of high-risk human papillomavirus (HPV) and the expression of E6 and E7 oncoproteins are the main causes of cervical cancer. Several prophylactic HPV vaccines are used in the clinic, but these vaccines have limited efficacy in patients already infected with HPV. Since HPV E7 is vital for tumor-specific immunity, developing a vaccine against HPV E7 is an attractive strategy for cervical cancer treatment. Here, we constructed an HPV16 E7 mutant that loses the ability to bind pRb while still eliciting a robust immune response. In order to build a therapeutic DNA vaccine, the E7 mutant was packaged in an adenovirus vector (Ad-E7) for efficient expression and enhanced immunogenicity of the vaccine. Our results showed that the Ad-E7 vaccine effectively inhibited tumor growth and increased the proportion of interferon-gamma (IFN-γ)-secreting CD8+ T cells in the spleen, and tumor-infiltrating lymphocytes in a mouse cervical cancer model was achieved by injecting with HPV16-E6/E7-expressing TC-1 cells subcutaneously. Combining the Ad-E7 vaccine with the PD-1/PD-L1 antibody blockade significantly improved the control of TC-1 tumors. Combination therapy elicited stronger cytotoxic T lymphocyte (CTL) responses, and IFN-γ secretion downregulated the proportion of Tregs and MDSCs significantly. The expressions of cancer-promoting factors, such as TNF-α, were also significantly down-regulated in the case of combination therapy. In addition, combination therapy inhibited the number of capillaries in tumor tissues and increased the thickness of the tumor capsule. Thus, Ad-E7 vaccination, in combination with an immune checkpoint blockade, may benefit patients with HPV16-associated cervical cancer.
Keywords: E7; PD-1; cervical cancer; human papillomavirus; therapeutic vaccine.
Conflict of interest statement
The authors declare no conflict of interest.
Figures
Similar articles
-
Development of DNA Vaccine Targeting E6 and E7 Proteins of Human Papillomavirus 16 (HPV16) and HPV18 for Immunotherapy in Combination with Recombinant Vaccinia Boost and PD-1 Antibody.mBio. 2021 Jan 19;12(1):e03224-20. doi: 10.1128/mBio.03224-20. mBio. 2021. PMID: 33468698 Free PMC article.
-
PD-1 blockade synergizes with intratumoral vaccination of a therapeutic HPV protein vaccine and elicits regression of tumor in a preclinical model.Cancer Immunol Immunother. 2021 Apr;70(4):1049-1062. doi: 10.1007/s00262-020-02754-x. Epub 2020 Oct 27. Cancer Immunol Immunother. 2021. PMID: 33108473 Free PMC article.
-
Human papillomavirus type 16 (HPV-16) virus-like particle L1-specific CD8+ cytotoxic T lymphocytes (CTLs) are equally effective as E7-specific CD8+ CTLs in killing autologous HPV-16-positive tumor cells in cervical cancer patients: implications for L1 dendritic cell-based therapeutic vaccines.J Virol. 2009 Jul;83(13):6779-89. doi: 10.1128/JVI.02443-08. Epub 2009 Apr 22. J Virol. 2009. PMID: 19386711 Free PMC article.
-
Novel therapeutic strategies for targeting E6 and E7 oncoproteins in cervical cancer.Crit Rev Oncol Hematol. 2025 Jul;211:104721. doi: 10.1016/j.critrevonc.2025.104721. Epub 2025 Apr 9. Crit Rev Oncol Hematol. 2025. PMID: 40216282 Review.
-
Comparison of preclinical efficacy of immunotherapies against HPV-induced cancers.Expert Rev Vaccines. 2024 Jan-Dec;23(1):674-687. doi: 10.1080/14760584.2024.2374287. Epub 2024 Jul 8. Expert Rev Vaccines. 2024. PMID: 38978164 Review.
Cited by
-
Design and evaluation of a multi-epitope DNA vaccine against HPV16.Hum Vaccin Immunother. 2024 Dec 31;20(1):2352908. doi: 10.1080/21645515.2024.2352908. Epub 2024 May 23. Hum Vaccin Immunother. 2024. PMID: 38780076 Free PMC article.
-
The Past, Present, and Future of Cervical Cancer Vaccines.Vaccines (Basel). 2025 Feb 17;13(2):201. doi: 10.3390/vaccines13020201. Vaccines (Basel). 2025. PMID: 40006746 Free PMC article. Review.
-
HPV16 mutant E6/E7 construct is protective in mouse model.BMC Biotechnol. 2024 Sep 30;24(1):71. doi: 10.1186/s12896-024-00893-y. BMC Biotechnol. 2024. PMID: 39350162 Free PMC article.
-
Adenoviral Therapy for Cervical Cancer: From Targeted Modification to Immunotherapy.Anticancer Agents Med Chem. 2025;25(14):967-977. doi: 10.2174/0118715206338559241112060553. Anticancer Agents Med Chem. 2025. PMID: 39871567 Review.
-
Research progress on tumor-infiltrating lymphocyte therapy for cervical cancer.Front Immunol. 2025 May 19;16:1524842. doi: 10.3389/fimmu.2025.1524842. eCollection 2025. Front Immunol. 2025. PMID: 40458394 Free PMC article. Review.
References
-
- Huh W.K., Joura E.A., Giuliano A.R., Iversen O.E., de Andrade R.P., Ault K.A., Bartholomew D., Cestero R.M., Fedrizzi E.N., Hirschberg A.L., et al. Final efficacy, immunogenicity, and safety analyses of a nine-valent human papillomavirus vaccine in women aged 16–26 years: A randomised, double-blind trial. Lancet. 2017;390:2143–2159. doi: 10.1016/S0140-6736(17)31821-4. - DOI - PubMed
MeSH terms
Substances
Grants and funding
LinkOut - more resources
Full Text Sources
Medical
Research Materials
