. 2023 Sep 26;14(10):1868.
doi: 10.3390/genes14101868.

Comparative Benchmarking of Optical Genome Mapping and Chromosomal Microarray Reveals High Technological Concordance in CNV Identification and Additional Structural Variant Refinement

Affiliations

Comparative Benchmarking of Optical Genome Mapping and Chromosomal Microarray Reveals High Technological Concordance in CNV Identification and Additional Structural Variant Refinement

Hayk Barseghyan et al. Genes (Basel). .

Abstract

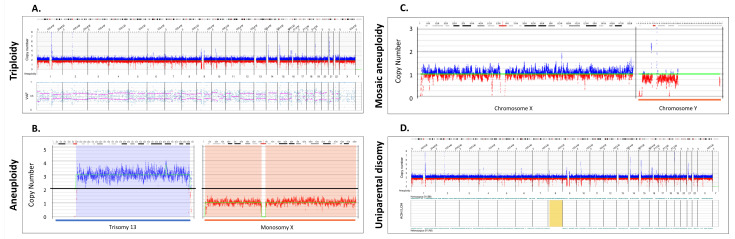
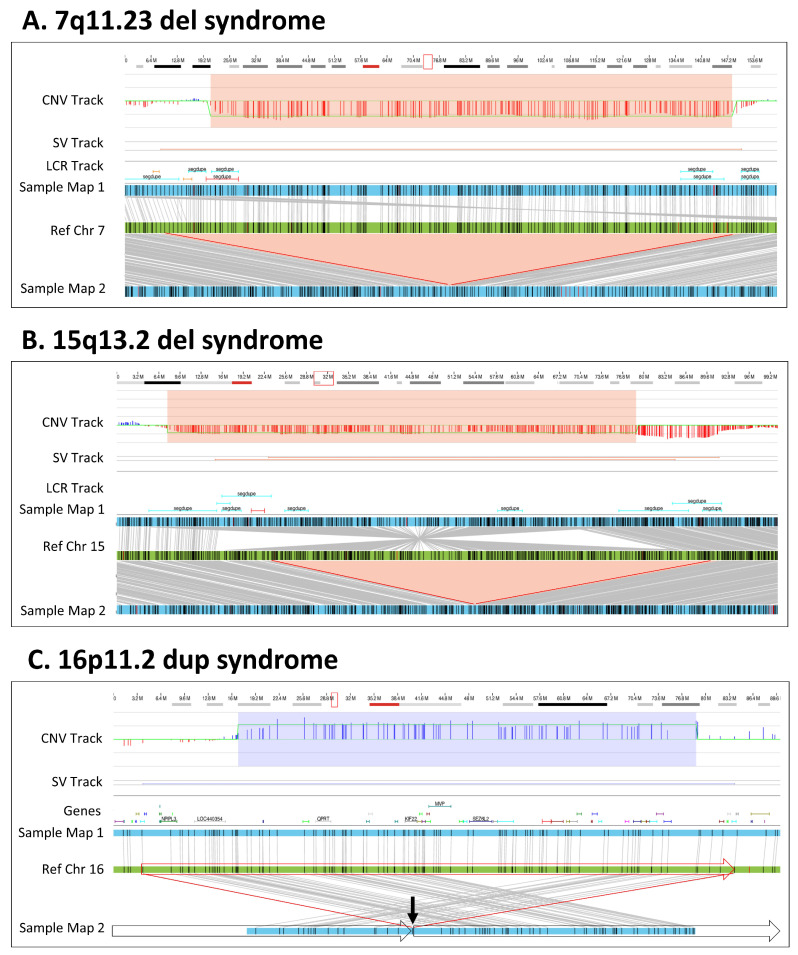
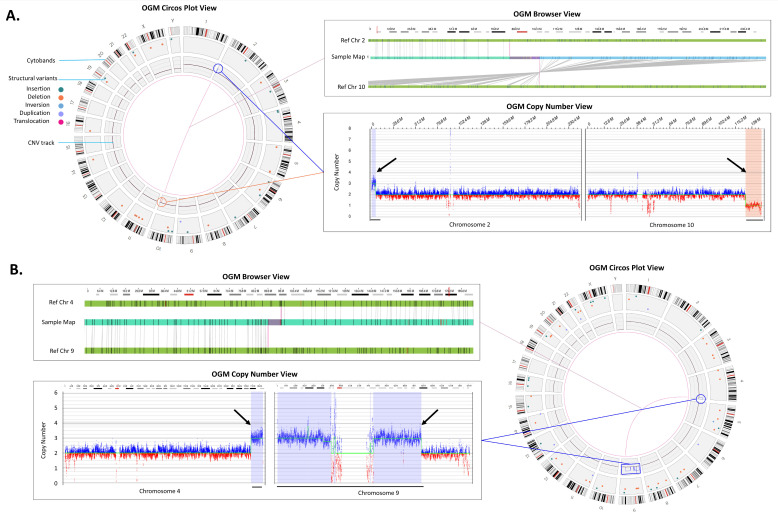
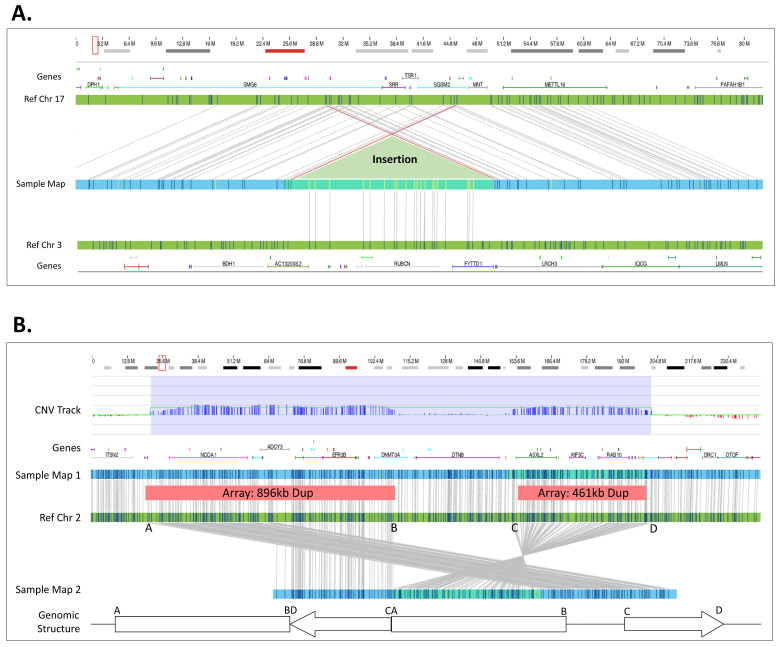
The recommended practice for individuals suspected of a genetic etiology for disorders including unexplained developmental delay/intellectual disability (DD/ID), autism spectrum disorders (ASD), and multiple congenital anomalies (MCA) involves a genetic testing workflow including chromosomal microarray (CMA), Fragile-X testing, karyotype analysis, and/or sequencing-based gene panels. Since genomic imbalances are often found to be causative, CMA is recommended as first tier testing for many indications. Optical genome mapping (OGM) is an emerging next generation cytogenomic technique that can detect not only copy number variants (CNVs), triploidy and absence of heterozygosity (AOH) like CMA, but can also define the location of duplications, and detect other structural variants (SVs), including balanced rearrangements and repeat expansions/contractions. This study compares OGM to CMA for clinically reported genomic variants, some of these samples also have structural characterization by fluorescence in situ hybridization (FISH). OGM was performed on IRB approved, de-identified specimens from 55 individuals with genomic abnormalities previously identified by CMA (61 clinically reported abnormalities). SVs identified by OGM were filtered by a control database to remove polymorphic variants and against an established gene list to prioritize clinically relevant findings before comparing with CMA and FISH results. OGM results showed 100% concordance with CMA findings for pathogenic variants and 98% concordant for all pathogenic/likely pathogenic/variants of uncertain significance (VUS), while also providing additional insight into the genomic structure of abnormalities that CMA was unable to provide. OGM demonstrates equivalent performance to CMA for CNV and AOH detection, enhanced by its ability to determine the structure of the genome. This work adds to an increasing body of evidence on the analytical validity and ability to detect clinically relevant abnormalities identified by CMA. Moreover, OGM identifies translocations, structures of duplications and complex CNVs intractable by CMA, yielding additional clinical utility.

Keywords: AOH; CMA; CNVs; OGM; SVs; Saphyr; absence of heterozygosity; aneuploidy; chromosomal microarray; optical genome mapping; triploidy.


Conflict of interest statement

A.W.C.P., B.C., A.C. and A.R.H. are employees at Bionano Genomics Inc. and own stock shares and options of Bionano Genomics Inc. M.S. is an employee at Bionano Laboratories and owns stock shares and options of Bionano Genomics Inc. H.B. is a former employee and owns Bionano stock shares and options.

Figures

Figure 1
Figure 1
Whole chromosomal abnormalities and absence of heterozygosity. (A) A triploid genome (69,XXX, Sample 51) showing CN profile and variant allele fraction profiles (VAF). OGM software (Bionano Access v.1.7) automatically quantifies VAF for all variants and constructs a plot depicting the genome wide distributions, shown in the bottom part of (A). In cases of a triplication the VAF are distributed differently compared to diploid chromosomes: VAF around 1 for variants present in 3 alleles, 0.67 for variants present in 2 alleles, and 0.33 for variants present in only 1 allele (VAF around 0.67 and 0.33 indicated by pink lines, see also Supplementary Figure S1A). (B) Copy number profile displaying two aneuploidies: trisomy 13 (Sample 48) and monosomy X (Sample 49). The Y axis represents the copy number measurement with the black line centered at two copies. Blue lines above the baseline represent gains and red losses. The cytobands for each of the chromosomes are displayed on the top. (C) Copy number profile displaying a mosaic loss of the Y chromosome (Sample 47). (D) AOH and CNV profiles displaying regions on chromosome 8 that do not have heterozygous variants indicating a potential uniparental disomy, highlighted in yellow (Sample 52).
Figure 2
Figure 2
Microdeletion/duplication syndromes. (A) A 1.9 Mbp heterozygous copy number loss in the 7q11.23 region. The red box in the cytoband on the top of the figure indicates the region of interest that is shown below. The deletion is captured by two OGM variant-calling algorithms—the copy number and the de novo assembly algorithms. In the top track, the copy number profile shows a one-copy drop. The bottom track shows that two assembled maps in blue align to the reference in green. The upper assembled Map 1 represents the reference allele, whereas the lower Map 2 captures the 1.9 Mbp deletion. Together the maps indicate that the deletion is heterozygous (Sample 8). (B) A 1.9 Mbp heterozygous copy number loss in the 15q13 region. The top track shows that the deletion is called by the copy number algorithm. The assembly pipeline shows that two distinct haplotype resolved alleles; one precisely shows the 1.9 Mbp deletion (Map 2) and the other (Map 1) carries an inversion with an additional 0.5 Mbp loss compared with the reference (Sample 15). (C) A 0.7 Mbp tandem duplication in 16p11.2. The copy number profile indicates a copy number of three. The de novo assembly delineates the structure and orientation of the duplication; the three copies occur on two haplotypes, with one copy on Map 1 and two copies in tandem order on Map 2. Due to the size of the duplication, the OGM molecules do not cover the entirety of the duplication. Instead, the map alignments show the head-to-tail fusion point indicated by the arrow and subsequent alignments on either side of the duplication. The genomic structure is shown with the boxed arrows around the sample Map 2 (Sample 38).
Figure 3
Figure 3
Translocations. (A) An unbalanced translocation detected between chromosomes 2 and 10. Left panel: Circos plot summary displaying SVs unique compared to the Bionano control database, sample (Sample 36). The translocation and the accompanying gain in 2p (blue line and circle) and loss in 10q (red line and circle) are shown via a line connection. Top right panel: The red box in the cytoband on the top indicates the region of interest that is shown below. The genome browser view details the alignment of the sample’s consensus map (light blue bar) with the reference consensus maps (light green bars) and provides the detail of the structural variation. Bottom right panel: The Y-axis represents the copy number level and X-axis gives the chromosome position, the CNV plot showing gain on chromosome 2 and loss on chromosome 10 (black arrows). (B) Rearrangements indicating the presence of a derivative chromosome (Sample 41). Top left panel shows a zoomed in view of a t(4;9) translocation. Bottom left panel shows copy number gains whose breakpoints coincide with the translocation breakpoints (black arrows). Combining both events (blue line and circle) in the circos plot on the right panel, we can infer that the gains and fusions between chromosomes 4 and 9 represent +der(9)t(4;9).
Figure 4
Figure 4
Insertion and complex structure. (A) The red box in the cytoband on the top of the figure indicates the region of interest that is shown below. A 151.3 kbp segment of 3q29 was duplicated and reinserted into 17p13.3. However, the insertion site shows additional complexity where 120.2 kbp of 17p13.3 around the insertion site is also duplicated (Sample 28). (B) Two duplications 896.3 kbp and a 461.2 kbp occur in proximity. The CNV track shows that the copy number algorithm detected the two duplications. The assembly assembled two different haplotypes: one with and one without the duplications. Based on the structure of Map 2, we deduce the duplications structure as depicted in the bottom (Sample 40).

References

    1. Online Mendelian Inheritance in Man, OMIM® McKusick-Nathans Institute of Genetic Medicine, Johns Hopkins University (Baltimore, MD) 2020. [(accessed on 1 August 2022)]. Available online: https://omim.org/
    1. Miller D.T., Adam M.P., Aradhya S., Biesecker L.G., Brothman A.R., Carter N.P., Church D.M., Crolla J.A., Eichler E.E., Epstein C.J., et al. Consensus Statement: Chromosomal Microarray Is a First-Tier Clinical Diagnostic Test for Individuals with Developmental Disabilities or Congenital Anomalies. Am. J. Hum. Genet. 2010;86:749–764. doi: 10.1016/j.ajhg.2010.04.006. - DOI - PMC - PubMed
    1. Manning M., Hudgins L. Array-Based Technology and Recommendations for Utilization in Medical Genetics Practice for Detection of Chromosomal Abnormalities. Genet. Med. 2010;12:742–745. doi: 10.1097/GIM.0b013e3181f8baad. - DOI - PMC - PubMed
    1. Shevell M., Ashwal S., Donley D., Flint J., Gingold M., Hirtz D., Majnemer A., Noetzel M., Sheth R.D. Practice Parameter: Evaluation of the Child with Global Developmental Delay [RETIRED]: Report of the Quality Standards Subcommittee of the American Academy of Neurology and The Practice Committee of the Child Neurology Society. Neurology. 2003;60:367–380. doi: 10.1212/01.WNL.0000031431.81555.16. - DOI - PubMed
    1. Moeschler J.B., Shevell M., Committee on Genetics. Moeschler J.B., Shevell M., Saul R.A., Chen E., Freedenberg D.L., Hamid R., Jones M.C., et al. Comprehensive Evaluation of the Child with Intellectual Disability or Global Developmental Delays. Pediatrics. 2014;134:e903–e918. doi: 10.1542/peds.2014-1839. - DOI - PMC - PubMed

Publication types