Review
. 2023 Sep 27;14(10):1879.
doi: 10.3390/genes14101879.

Tissue-Specific Tumour Suppressor and Oncogenic Activities of the Polycomb-like Protein MTF2

Affiliations
Review

Tissue-Specific Tumour Suppressor and Oncogenic Activities of the Polycomb-like Protein MTF2

Mzwanele Ngubo et al. Genes (Basel). .

Abstract

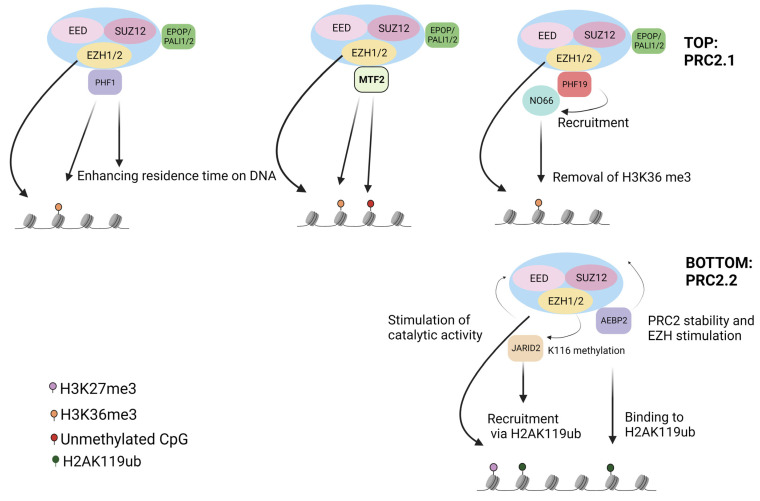
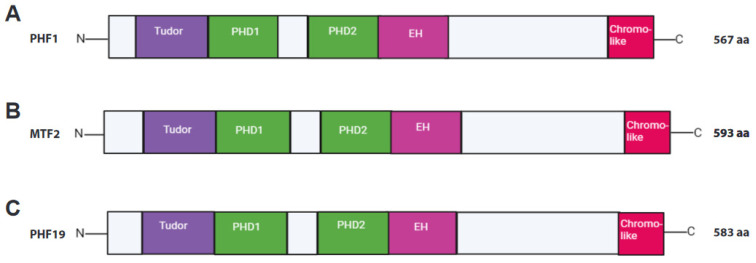
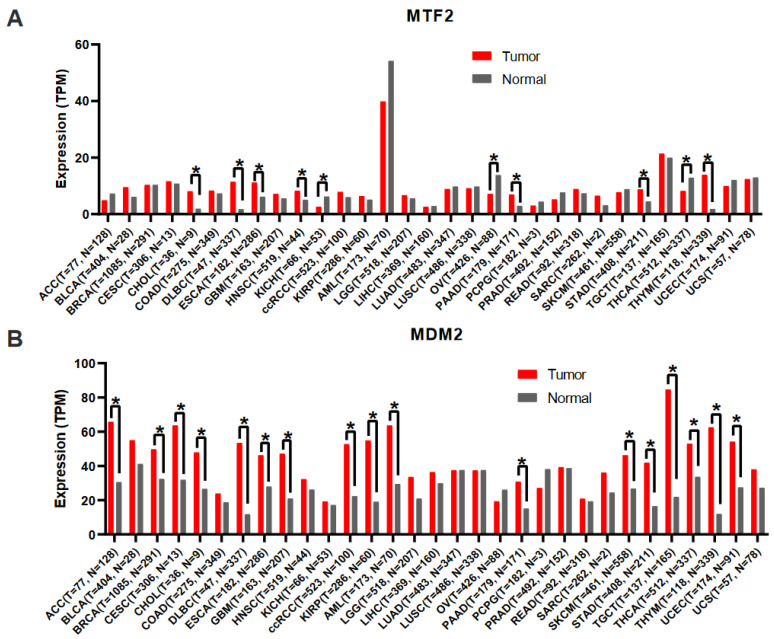
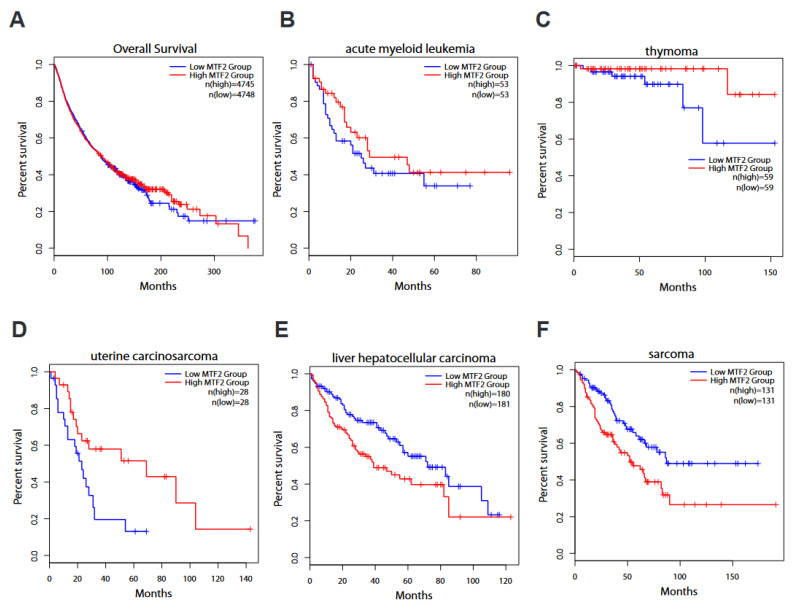
The Polycomb repressive complex 2 (PRC2) is a conserved chromatin-remodelling complex that catalyses the trimethylation of histone H3 lysine 27 (H3K27me3), a mark associated with gene silencing. PRC2 regulates chromatin structure and gene expression during organismal and tissue development and tissue homeostasis in the adult. PRC2 core subunits are associated with various accessory proteins that modulate its function and recruitment to target genes. The multimeric composition of accessory proteins results in two distinct variant complexes of PRC2, PRC2.1 and PRC2.2. Metal response element-binding transcription factor 2 (MTF2) is one of the Polycomb-like proteins (PCLs) that forms the PRC2.1 complex. MTF2 is highly conserved, and as an accessory subunit of PRC2, it has important roles in embryonic stem cell self-renewal and differentiation, development, and cancer progression. Here, we review the impact of MTF2 in PRC2 complex assembly, catalytic activity, and spatiotemporal function. The emerging paradoxical evidence suggesting that MTF2 has divergent roles as either a tumour suppressor or an oncogene in different tissues merits further investigations. Altogether, our review illuminates the context-dependent roles of MTF2 in Polycomb group (PcG) protein-mediated epigenetic regulation. Its impact on disease paves the way for a deeper understanding of epigenetic regulation and novel therapeutic strategies.

Keywords: MTF2; PHF1; PHF19; Polycomb repressive complex 2; Polycomb-like; cancer; development; epigenetics; oncogene; tumour suppressor.


Conflict of interest statement

The authors declare no conflict of interest.

Figures

Figure 1
Figure 1
An overview of PRC2 variants. Top (PRC2.1): PHF1 can associate with H3K36me3, recruit PRC2.1 to genomic regions containing high H3K36me3 levels, and also extend the residence time of PRC2.1 on chromatin. MTF2 recruits PRC2.1 to unmethylated CpG islands and also binds to H3K36me3 loci. PHF19 associates with H3K36me3 and recruits NO66, which demethylates H3K36me3, facilitating H3K27me3 deposition. EPOP has inhibitory effects on the complex by association with EloB/C to maintain low levels of transcription. PALI1/2 boosts the catalytic activity of EHZ1/2. Therefore, EPOP and PALI1/2 fine-tune the activity of PRC2 at target genes. Bottom (PRC2.2): JARID2 can recruit PRC2.2 by binding H2AK119ub and augment the catalytic activity of EZH1/2. JARID2 can also be methylated at K116 by EZH2, which mainly functions as a binding scaffold for EED, culminating in the stimulation of EZH2 catalytic activity. AEBP2 is a stabilising c-factor of PRC2.2 and can increase the catalytic activity of EZH1/2.
Figure 2
Figure 2
Overview of domain structure of PCLs. PCL protein domains are shown from N-C terminus, left to right, in: (A) PHF1 (PCL1), (B) MTF2 (PCL2), and (C) PHF19 (PCL3).
Figure 3
Figure 3
MTF2 and MDM2 transcript expression levels in normal versus tumour tissues. (A) MTF2 transcript and (B) MDM2 transcript levels are graphed across 31 tumours in comparison to their normal tissue counterparts. Both MTF2 and MDM2 display oncogenic activity in several cancer types. Low expression of MTF2 is associated with elevated MDM2 expression in ACC, AML, and THCA. ACC (adrenocortical carcinoma); BLCA (bladder urothelial carcinoma); BRCA (breast invasive carcinoma); CESC (cervical squamous cell carcinoma and endocervical adenocarcinoma); CHOL (cholangiocarcinoma); COAD (colon adenocarcinoma); DLBC (lymphoid neoplasm diffuse large B-cell lymphoma); ESCA (esophageal carcinoma); GBM (glioblastoma multiforme); HNSC (head and neck squamous cell carcinoma); KICH (kidney chromophobe); ccRCC (clear cell renal cell carcinoma); KIRP (kidney renal papillary cell carcinoma); AML (acute myeloid leukaemia); LGG (brain lower-grade glioma); LIHC (liver hepatocellular carcinoma); LUAD (lung adenocarcinoma); LUSC (lung squamous cell carcinoma); MESO (mesothelioma); OV (ovarian serous cystadenocarcinoma); PAAD (pancreatic adenocarcinoma); PCPG (pheochromocytoma and paraganglioma); PRAD (prostate adenocarcinoma); READ (rectum adenocarcinoma); SARC (sarcoma); SKCM (skin cutaneous melanoma); STAD (stomach adenocarcinoma); TGCT (testicular germ cell tumours); THCA (thyroid carcinoma); THYM (thymoma); UCEC (uterine corpus endometrial carcinoma); UCS (uterine carcinosarcoma). mRNA expression levels were obtained from TCGA data from the GEPIA2 (Gene Expression Profiling Interactive Analysis) web server [103]. Differentially expressed genes were determined based on Log2FoldChange = 0.58 and (*) q-value < 0.05. The bar plot represents the median expression of shown tumour type or normal tissue.
Figure 4
Figure 4
Kaplan–Meier survival rate based on MTF2 expression level. (A) Overall survival of patients with low MTF2 level (n = 4748) tends to be dire compared to their counterparts with high MTF2 (Logrank p = 0.71, n = 4745). (B) Elevated MTF2 expression in patients with acute myeloid leukaemia (AML) is concomitant with promising survival, although it does not reach a significant cut-off value (Logrank p = 0.26, n = 53). (C) Thymoma (THYM) patients with elevated MTF2 have a substantially favourable survival rate (Logrank p = 0.044, n = 59). (D) Uterine carcinosarcoma (UCS) patients survive longer when MTF2 is higher (Logrank p = 0.018, n = 28). (E) Liver hepatocellular carcinoma (LIHC) with elevated MTF2 results in dire survival rate (Logrank p = 0.0026, n (high) = 180, n (low) = 181). (F) Sarcoma (SARC)-inflicted patients with higher MTF2 levels demonstrate dismal prognosis (Logrank p = 0.002, n = 131). TCGA data from GEPIA2 web server were used for survival analyses.
Figure 5
Figure 5
MTF2 mutational analysis in cancer. (A) Identification of all detected mutations across the MTF2 gene. (B) Various types of mutations (missense, truncating, splice, multiple) are shown across all 32 cancer types. In all cancerous tissues, the MTF2 gene has not been affected by any mutations with the exception of UCEC (uterine corpus endometrial carcinoma), which shows several mutations such as missense types. (C) Overall survival of patients with mutated versus nonmutated MTF2 gene is similar (Logrank p = 0.757, n = 1080).
Figure 6
Figure 6
GO enrichment terms of divergent MTF2 expression levels in cancer. (A) Low abundance of MTF2 in AML dysregulates several pathways, including regulation of RNA metabolic process and DNA damage response (DDR). (B) Thymoma-inflicted patients with reduced MTF2 display dysregulated cell cycle and apoptosis, to name a few effects. (C) Affected functional pathways in UCS patients with reduced MTF2 are shown; no biological processes were affected similarly with either AML- or thymoma-diagnosed patients. (D,E) Elevated MTF2 transcript levels in LIHC and SARC are associated with enrichment of several pathways. Both tumours respond distinctly to increased MTF2, such that LIHC immune system-related pathways are enriched; in SARC, apoptosis and cell proliferation processes are affected. (F) Heatmap of Log2FoldChange exhibiting the list of differentially expressed genes in low-expressing MTF2 AML, THYM, and UCS samples. Most affected genes in MTF2-low AML are involved in DNA damage response process. PRKCD (which functions in nonhomologous end joining DNA repair) is the only commonly differentially affected gene. The Gene Ontology (GO) analysis was performed using the g:Profiler web server, and the cut-off value was set at adj. p-value < 0.05.

Similar articles

Cited by

References

    1. Cheng Y., He C., Wang M., Ma X., Mo F., Yang S., Han J., Wei X. Targeting epigenetic regulators for cancer therapy: Mechanisms and advances in clinical trials. Signal Transduct. Target. Ther. 2019;4:62. doi: 10.1038/s41392-019-0095-0. - DOI - PMC - PubMed
    1. Sharma S., Kelly T.K., Jones P.A. Epigenetics in cancer. Carcinogenesis. 2010;31:27–36. doi: 10.1093/carcin/bgp220. - DOI - PMC - PubMed
    1. Piunti A., Shilatifard A. The roles of Polycomb repressive complexes in mammalian development and cancer. Nat. Rev. Mol. Cell Biol. 2021;22:326–345. doi: 10.1038/s41580-021-00341-1. - DOI - PubMed
    1. Lewis E.B. A gene complex controlling segmentation in Drosophila. Nature. 1978;276:565–570. doi: 10.1038/276565a0. - DOI - PubMed
    1. Schuettengruber B., Bourbon H.M., Di Croce L., Cavalli G. Genome Regulation by Polycomb and Trithorax: 70 Years and Counting. Cell. 2017;171:34–57. doi: 10.1016/j.cell.2017.08.002. - DOI - PubMed

Publication types

Grants and funding

LinkOut - more resources