. 2023 Sep 27;16(10):1370.
doi: 10.3390/ph16101370.

Dapagliflozin/Hesperidin Combination Mitigates Lipopolysaccharide-Induced Alzheimer's Disease in Rats

Affiliations

Dapagliflozin/Hesperidin Combination Mitigates Lipopolysaccharide-Induced Alzheimer's Disease in Rats

Maaly A Abd Elmaaboud et al. Pharmaceuticals (Basel). .

Abstract

Alzheimer's disease (AD) is the most common form of neurodegenerative disorders worldwide. Its pathologic features include massive neuroinflammation with abnormal deposition of β-amyloid peptide in the cerebral tissues leading to degeneration of the brain neurons. Adverse effects associated with the traditional drugs used for the treatment of this pathological condition have directed the research efforts towards searching for alternative effective agents with minimal adverse effects. The aim of this study was to elucidate the potential ameliorative effects of dapagliflozin and/or hesperidin on Alzheimer's disease (AD) induced by lipopolysaccharide (LPS) injection in rats. In a rodent model of AD, the effect of dapagliflozin with or without hesperidin on the biochemical parameters and the behavioral tests as well as the histopathological parameters was determined. Each of dapagliflozin and hesperidin restored the behavioral tests to the reference values, augmented the antioxidant defense mechanisms, ameliorated the neuronal inflammatory responses, combatted the changes in Toll-like receptor-4 (TLR-4)/High-mobility group box 1 (HMGB1) protein signaling and receptors of advanced glycation end products (RAGE) levels, and restored the balance between the apoptotic signals and autophagy in the hippocampal tissues. Additionally, both agents exhibited an outstanding ability to combat LPS-induced perturbations in the histopathological and electron microscopic image of the brain tissues. These favorable effects were significantly encountered in the group treated with dapagliflozin/hesperidin combination when compared versus animals treated with either dapagliflozin or hesperidin. In conclusion, inhibition of the hippocampal HMGB1/TLR4/RAGE signaling, the pro-inflammatory axis, and apoptosis alongside augmentation of the antioxidant defenses and autophagy can be regarded as beneficial effects by which dapagliflozin/hesperidin combination may combat LPS-triggered AD.

Keywords: Alzheimer’s disease; apoptosis; autophagy; dapagliflozin; hesperidin; inflammatory cascade; lipopolysaccharide; oxidative stress; rats.


Conflict of interest statement

The authors declare no conflict of interest.

Figures

Figure 1
Figure 1
Effect of dapagliflozin and/or hesperidin on (A) the total number of rearing behaviors and (B) the locomotor activity in rats injected with lipopolysaccharide (LPS) (Mean ± SD); LPS (lipopolysaccharide), DMSO (dimethyl sulfoxide), DPF (dapagliflozin), and HSP (hesperidin).
Figure 2
Figure 2
Effect of dapagliflozin and/or hesperidin on (A) the discrimination index and (B) the sniffing time in rats injected with lipopolysaccharide (Mean ± SD). a p-value < 0.05 versus the control group; b p-value < 0.05 versus LPS-injected group; c p-value < 0.05 versus LPS rats treated with dapagliflozin; d p-value < 0.05 versus LPS rats treated with hesperidin. LPS (lipopolysaccharide), DMSO (dimethyl sulfoxide), DPF (dapagliflozin), and HSP (hesperidin).
Figure 3
Figure 3
Effect of dapagliflozin and/or hesperidin on Morris Water Maze test in rats injected with lipopolysaccharide (Mean ± SD). a p-value < 0.05 versus the control group; b p-value < 0.05 versus LPS-injected group; c p-value < 0.05 versus LPS rats treated with dapagliflozin; d p-value < 0.05 versus LPS rats treated with hesperidin. LPS (lipopolysaccharide), DMSO (dimethyl sulfoxide), DPF (dapagliflozin), and HSP (hesperidin).
Figure 4
Figure 4
Effect of dapagliflozin and/or hesperidin on (A) malondialdehyde, (B) total antioxidant capacity, (C) catalase, (D) superoxide dismutase, (E) paraoxonase-1, and (F) Nrf2 content of the hippocampal tissues of rats injected with lipopolysaccharide (LPS) (Mean ± SD). a p-value < 0.05 versus the control group; b p-value < 0.05 versus LPS-injected group; c p-value < 0.05 versus LPS rats treated with dapagliflozin; d p-value < 0.05 versus LPS rats treated with hesperidin. LPS (lipopolysaccharide), DMSO (dimethyl sulfoxide), DPF (dapagliflozin), and HSP (hesperidin).
Figure 5
Figure 5
Effect of dapagliflozin and/or hesperidin on (A) IL-1β, (B) IL8, and (C) IL-18 levels in the hippocampal tissues of rats injected with lipopolysaccharide (Mean ± SD). a p-value < 0.05 versus the control group; b p-value < 0.05 versus LPS-injected group; c p-value < 0.05 versus LPS rats treated with dapagliflozin; d p-value < 0.05 versus LPS rats treated with hesperidin. LPS (lipopolysaccharide), DMSO (dimethyl sulfoxide), DPF (dapagliflozin), and HSP (hesperidin).
Figure 6
Figure 6
Effect of dapagliflozin and/or hesperidin on (A) TGF-β1, (B) NF-κB, (C) MCP-1, and (D) NLRP3 inflammasome in the hippocampal tissues of rats injected with lipopolysaccharide (Mean ± SD). a p-value < 0.05 versus the control group; b p-value < 0.05 versus LPS-injected group; c p-value < 0.05 versus LPS rats treated with dapagliflozin; d p-value < 0.05 versus LPS rats treated with hesperidin. LPS (lipopolysaccharide), DMSO (dimethyl sulfoxide), DPF (dapagliflozin), and HSP (hesperidin).
Figure 7
Figure 7
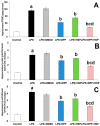
Effect of dapagliflozin and/or hesperidin on (A) TLR4, (B) HMGB1, and (C) RAGE in the hippocampal tissues of rats injected with lipopolysaccharide (Mean ± SD). a p-value < 0.05 versus the control group; b p-value < 0.05 versus LPS-injected group; c p-value < 0.05 versus LPS rats treated with dapagliflozin; d p-value < 0.05 versus LPS rats treated with hesperidin. LPS (lipopolysaccharide), DMSO (dimethyl sulfoxide), DPF (dapagliflozin), HSP (hesperidin).
Figure 8
Figure 8
Effect of dapagliflozin and/or hesperidin on (A) PI3K, (B) p-Akt/total Akt, and (C) p-mTOR/total m-TOR levels in the hippocampal tissues of rats injected with lipopolysaccharide (Mean ± SD). a p-value < 0.05 versus the control group; b p-value < 0.05 versus LPS-injected group; c p-value < 0.05 versus LPS rats treated with dapagliflozin; d p-value < 0.05 versus LPS rats treated with hesperidin. LPS (lipopolysaccharide), DMSO (dimethyl sulfoxide), DPF (dapagliflozin), and HSP (hesperidin).
Figure 9
Figure 9
Effect of dapagliflozin and/or hesperidin on (A) beclin-1 and (B) LC3-II in the hippocampal tissues of rats injected with lipopolysaccharide (Mean ± SD). a p-value < 0.05 versus the control group; b p-value < 0.05 versus LPS-injected group; c p-value < 0.05 versus LPS rats treated with dapagliflozin; d p-value < 0.05 versus LPS rats treated with hesperidin. LPS (lipopolysaccharide), DMSO (dimethyl sulfoxide), DPF (dapagliflozin), and HSP (hesperidin).
Figure 10
Figure 10
Effect of dapagliflozin and/or hesperidin on (A) caspase 3, (B) caspase 9, and (C) BCL-2 in the hippocampal tissues of rats injected with lipopolysaccharide (Mean ± SD). a p-value < 0.05 versus the control group; b p-value < 0.05 versus LPS-injected group; c p-value < 0.05 versus LPS rats treated with dapagliflozin; d p-value < 0.05 versus LPS rats treated with hesperidin. LPS (lipopolysaccharide), DMSO (dimethyl sulfoxide), DPF (dapagliflozin), and HSP (hesperidin).
Figure 11
Figure 11
Sections from the hippocampus stained with hematoxylin and eosin of (A) the control rats showing multiple tightly packed layers of pyramidal cells of different sizes with polygonal cell bodies, vesicular nuclei, and prominent nucleoli; (B) LPS-injected rats exhibiting significantly diminished pyramidal cell layer thickness with multiple dystrophic neurons showing apoptotic changes with shrunken hyperchromatic pyknotic nuclei and chromatin condensation (arrows); (C) LPS-injected rats treated with DMSO exhibiting large-sized dispersed multipolar neurons (arrows) with neurons of smaller size in between (arrow heads); (D) LPS-injected rats treated with dapagliflozin exhibiting moderate decline in the number of the nuclei that showed apoptotic changes with significantly increased number of the normal nuclei; (E) LPS-injected rats treated with hesperidin showing significantly decreased number of the apoptotic neurocytic nuclei with increased number of the normal nuclei; (F) LPS-injected rats treated with dapagliflozin/hesperidin combination exhibiting marked increase in the number of the normal neurons (arrows) with scanty apoptotic neurons in between (arrow head).
Figure 12
Figure 12
Sections from the frontal lobe stained with hematoxylin and eosin of (A) the control group exhibiting normal neurons with polygonal cell bodies, large vesicular nuclei, prominent nucleoli and normal distribution of Nissl’s granules (arrow), microglia (arrow head), and scattered macrophages (asterix); (B) LPS-injected rats exhibiting significant neurocytic dystrophy with shrunken hyperchromatic pyknotic nuclei with abundant chromatin condensation (thick arrows), massive infiltration with lymphocytes (thin arrows), vascular congestion (arrow head), and spongiform necrosis (asterix); (C) LPS-injected rats treated with DMSO showing significant dystrophy of the neurons, shrunken hyperchromatic nuclei (thick arrows), venous stasis (arrow head), lymphocytic infiltration (thin arrows), and scattered areas of spongiform necrosis (asterix); (D) LPS-injected rats treated with dapagliflozin exhibiting decreased number of the apoptotic neurons (arrows), increased near normal neurons with central large vesicular nuclei, and peripheral distribution of Nissl’s granules (arrow heads); (E) LPS-injected rats treated with hesperidin showing scanty apoptotic neurons (arrows), abundance of the apparently normal neurocytes, with peripherally placed Nissl’s granules (arrow heads); (F) LPS-injected rats treated with dapagliflozin/hesperidin combination showing marked decrease in the number of the neurons with dystrophic changes with shrunken hyperchromatic nuclei (arrow) and increased near normal neurons with central large vesicular nuclei, containing one or more nucleoli, and peripheral distribution of Nissl’s granules (arrow heads).
Figure 13
Figure 13
A photomicrograph of immunohistochemical staining of Ki-67 in the hippocampus of (A) the control rats exhibiting negative immunoreactivity of the pyramidal cells to Ki-67; (B,C) LPS-injected rats and LPS-injected rats treated with DMSO respectively showing strong positive nuclear immunoreactivity to Ki-67 (arrows); (D,E) LPS-injected rats treated with dapagliflozin and hesperidin, respectively, revealing moderate positive nuclear immunoreactivity to Ki-67 (arrows); (F) LPS-injected rats treated with dapagliflozin/hesperidin combination revealing weak positive immunoexpression of Ki-67 in the neurocytic nuclei (arrow) (Streptavidin biotin ×400).
Figure 14
Figure 14
A photomicrograph of immunohistochemical staining of Ki-67 in the frontal lobe of (A) the control rats showing negative immunoexpression of Ki-67 in the neurocytic nuclei; (B,C) LPS-injected rats and LPS-injected rats treated with DMSO, respectively, exhibiting strong positive nuclear immunoreactivity to Ki-67 (arrows); (D,E) LPS-injected rats treated with dapagliflozin and hesperidin respectively showing moderate nuclear immunostaining of Ki-67 (arrows); (F) LPS-injected rats treated with dapagliflozin/hesperidin combination showing mild immunoreactivity of the neurocytic nuclei to Ki-67 (arrows) (Streptavidin biotin ×200).
Figure 15
Figure 15
An electron micrograph of ultrathin sections in the cerebral cortex from (A) the control group revealing the pyramidal cell with large rounded regular nucleus (N) and prominent nucleolus (n). The cytoplasm shows normal mitochondria with normal cristae pattern (M), rough endoplasmic reticulum (arrow), and multiple free ribosomes (R) (TEM; ×1500 direct magnification); (B) the control group showing a myelinated axon with regular smooth contour of its myelin sheath (arrow) and an unmyelinated axon (arrow head). Normal-shaped mitochondria with normal cristae pattern (M) appear within their axoplasm (TEM; ×5000); (C) LPS-injected rats showing the pyramidal cell with markedly shrunken irregular nucleus with marked chromatin condensation (N). The cytoplasm shows swollen mitochondria with markedly destructed cristae (M), dilated rough endoplasmic reticulum (RER) (arrow) and scanty free ribosomes (R) (TEM; ×2000); (D) LPS-injected rats treated with DMSO exhibiting the pyramidal cell with markedly shrunken irregular nucleus, marked chromatin condensation (N) and the cytoplasm shows markedly dilated RER (arrow) and swollen mitochondria with disrupted cristae (M) (TEM; ×4000); (E) LPS-injected rats treated with dapagliflozin with the pyramidal cell nucleus regained its normal contour and chromatin distribution (N) with mildly dilated RER (Arrow) and scanty ribosomes (R) (TEM; ×2500); (F) LPS-injected rats treated with hesperidin in which the pyramidal cell nucleus regained its normal contour and chromatin distribution (N) with mildly dilated RER (arrow) and swollen mitochondria with mild disruption of the cristae (M) (TEM; ×4000 direct magnification); (G) LPS-injected rats treated with dapagliflozin/hesperidin combination showing the pyramidal cell with apical dendrites in which the nucleus regained its regular contour and chromatin distribution (N). The cytoplasm shows apparently normal mitochondria (M) and multiple free ribosomes (R) (TEM; ×1500).
Figure 16
Figure 16
Summary of the possible mechanisms by which dapagliflozin and/or hesperidin might combat the pathologic changes in the brain tissues elicited by lipopolysaccharide injection.

References

    1. Breijyeh Z., Karaman R. Comprehensive Review on Alzheimer’s Disease: Causes and Treatment. Molecules. 2020;25:5789. doi: 10.3390/molecules25245789. - DOI - PMC - PubMed
    1. Drummond E., Kavanagh T., Pires G., Marta-Ariza M., Kanshin E., Nayak S., Faustin A., Berdah V., Ueberheide B., Wisniewski T. The amyloid plaque proteome in early onset Alzheimer’s disease and Down syndrome. Acta Neuropathol. Commun. 2022;10:53. doi: 10.1186/s40478-022-01356-1. - DOI - PMC - PubMed
    1. Knopman D.S., Amieva H., Petersen R.C., Chételat G., Holtzman D.M., Hyman B.T., Nixon R.A., Jones D.T. Alzheimer disease. Nat. Rev. Dis. Prim. 2021;7:33. doi: 10.1038/s41572-021-00269-y. - DOI - PMC - PubMed
    1. Hoogmartens J., Cacace R., Van Broeckhoven C. Insight into the genetic etiology of Alzheimer’s disease: A comprehensive review of the role of rare variants. Alzheimer’s Dement. 2021;13:e12155. doi: 10.1002/dad2.12155. - DOI - PMC - PubMed
    1. Xie J., Van Hoecke L., Vandenbroucke R.E. The Impact of Systemic Inflammation on Alzheimer’s Disease Pathology. Front. Immunol. 2022;12:796867. doi: 10.3389/fimmu.2021.796867. - DOI - PMC - PubMed

LinkOut - more resources