

Evaluation of Morpho-Physiological and Yield-Associated Traits of Rice (Oryza sativa L.) Landraces Combined with Marker-Assisted Selection under High-Temperature Stress and Elevated Atmospheric CO2 Levels
- PMID: 37896118
- PMCID: PMC10610436
- DOI: 10.3390/plants12203655
Evaluation of Morpho-Physiological and Yield-Associated Traits of Rice (Oryza sativa L.) Landraces Combined with Marker-Assisted Selection under High-Temperature Stress and Elevated Atmospheric CO2 Levels
Abstract
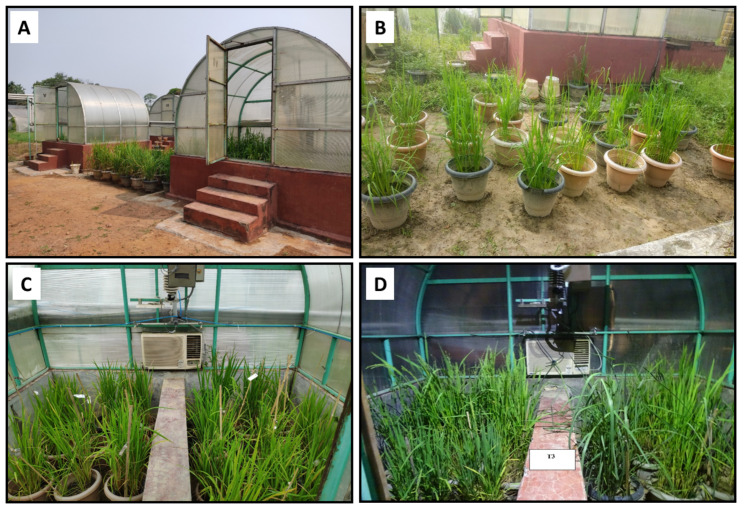
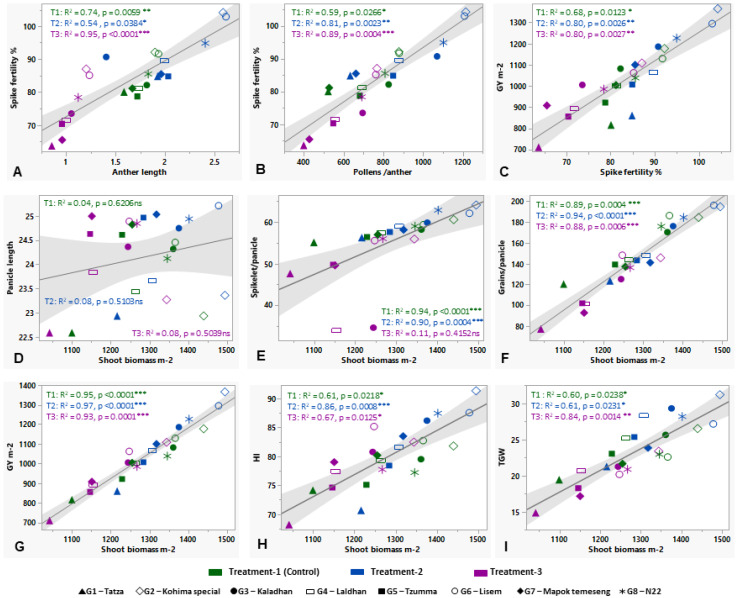
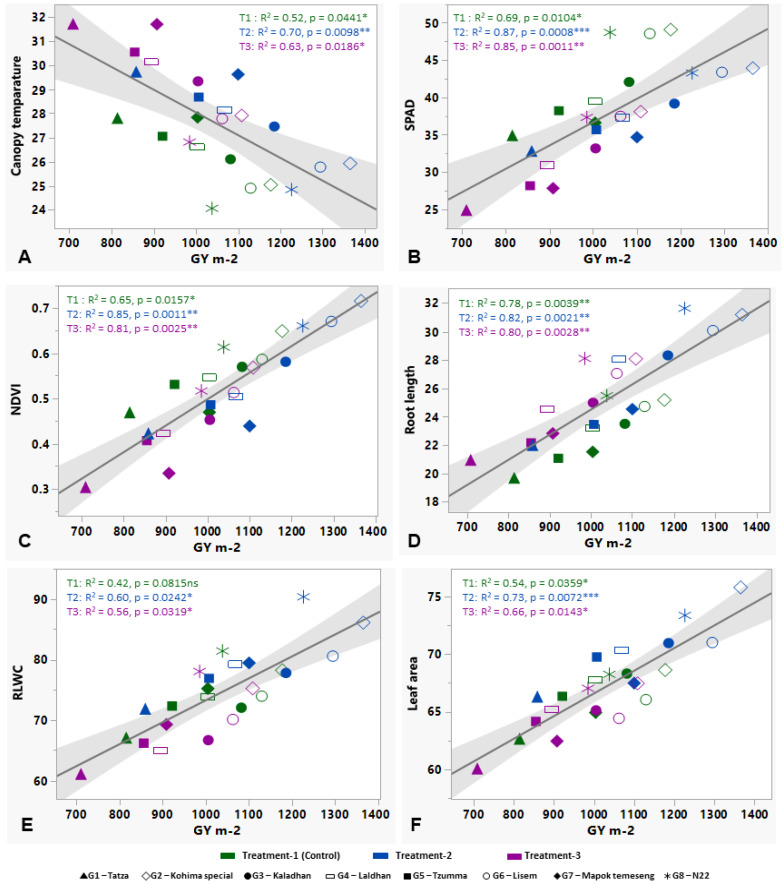
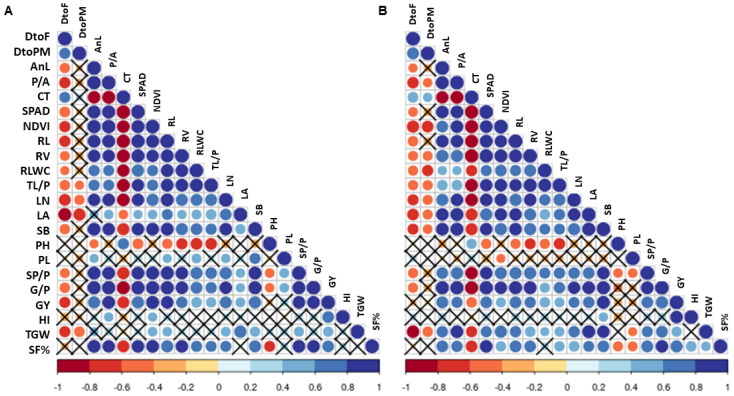
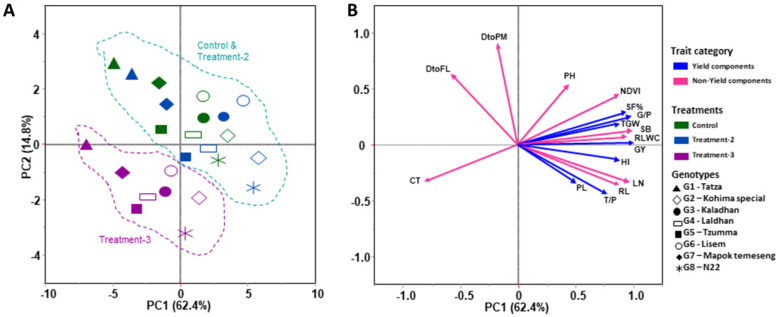
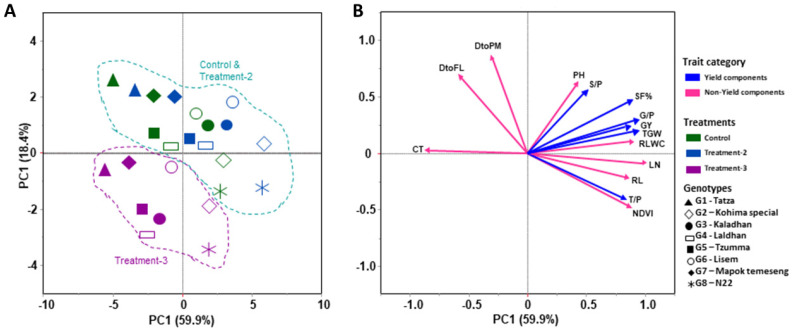
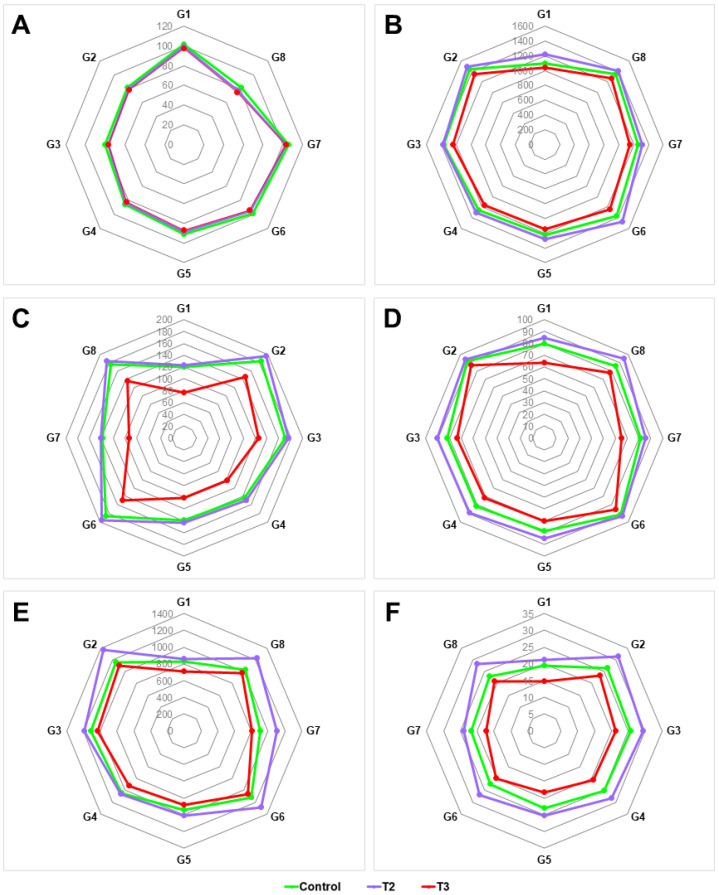
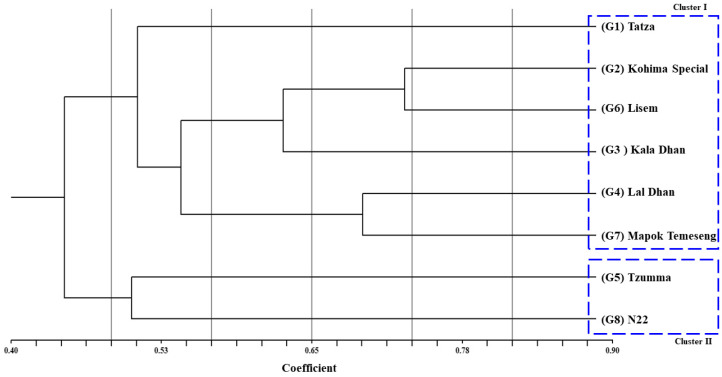
Rice (Oryza sativa L.) is an important cereal crop worldwide due to its long domestication history. North-Eastern India (NEI) is one of the origins of indica rice and contains various native landraces that can withstand climatic changes. The present study compared NEI rice landraces to a check variety for phenological, morpho-physiological, and yield-associated traits under high temperatures (HTs) and elevated CO2 (eCO2) levels using molecular markers. The first experiment tested 75 rice landraces for HT tolerance. Seven better-performing landraces and the check variety (N22) were evaluated for the above traits in bioreactors for two years (2019 and 2020) under control (T1) and two stress treatments [mild stress or T2 (eCO2 550 ppm + 4 °C more than ambient temperature) and severe stress or T3 (eCO2 750 ppm + 6 °C more than ambient temperature)]. The findings showed that moderate stress (T2) improved plant height (PH), leaf number (LN), leaf area (LA), spikelets panicle-1 (S/P), thousand-grain weight (TGW), harvest index (HI), and grain production. HT and eCO2 in T3 significantly decreased all genotypes' metrics, including grain yield (GY). Pollen traits are strongly and positively associated with spikelet fertility at maturity and GY under stress conditions. Shoot biomass positively affected yield-associated traits including S/P, TGW, HI, and GY. This study recorded an average reduction of 8.09% GY across two seasons in response to the conditions simulated in T3. Overall, two landraces-Kohima special and Lisem-were found to be more responsive compared to other the landraces as well as N22 under stress conditions, with a higher yield and biomass increment. SCoT-marker-assisted genotyping amplified 77 alleles, 55 of which were polymorphic, with polymorphism information content (PIC) values from 0.22 to 0.67. The study reveals genetic variation among the rice lines and supports Kohima Special and Lisem's close relationship. These two better-performing rice landraces are useful pre-breeding resources for future rice-breeding programs to increase stress tolerance, especially to HT and high eCO2 levels under changing climatic situations.
Keywords: North-East India; SCoT marker; climate change; elevated CO2; grain yield; high temperature; rice landrace.
Conflict of interest statement
The authors declare no conflict of interest.
Figures
Similar articles
-
Association mapping of drought tolerance and agronomic traits in rice (Oryza sativa L.) landraces.BMC Plant Biol. 2021 Oct 23;21(1):484. doi: 10.1186/s12870-021-03272-3. BMC Plant Biol. 2021. PMID: 34686134 Free PMC article.
-
SSR marker-based genetic diversity analysis and SNP haplotyping of genes associating abiotic and biotic stress tolerance, rice growth and development and yield across 93 rice landraces.Mol Biol Rep. 2021 Aug;48(8):5943-5953. doi: 10.1007/s11033-021-06595-4. Epub 2021 Jul 28. Mol Biol Rep. 2021. PMID: 34319545
-
Physiological characterization and allelic diversity of selected drought tolerant traditional rice (Oryza sativa L.) landraces of Koraput, India.Physiol Mol Biol Plants. 2018 Nov;24(6):1035-1046. doi: 10.1007/s12298-018-0606-4. Epub 2018 Sep 28. Physiol Mol Biol Plants. 2018. PMID: 30425421 Free PMC article.
-
Drought stress in rice: morpho-physiological and molecular responses and marker-assisted breeding.Front Plant Sci. 2023 Jul 18;14:1215371. doi: 10.3389/fpls.2023.1215371. eCollection 2023. Front Plant Sci. 2023. PMID: 37534289 Free PMC article. Review.
-
Marker-assisted selection for grain number and yield-related traits of rice (Oryza sativa L.).Physiol Mol Biol Plants. 2020 May;26(5):885-898. doi: 10.1007/s12298-020-00773-7. Epub 2020 Mar 27. Physiol Mol Biol Plants. 2020. PMID: 32377039 Free PMC article. Review.
Cited by
-
Genetic Diversity and Population Structure of Maize (Zea mays L.) Inbred Lines in Association with Phenotypic and Grain Qualitative Traits Using SSR Genotyping.Plants (Basel). 2024 Mar 13;13(6):823. doi: 10.3390/plants13060823. Plants (Basel). 2024. PMID: 38592835 Free PMC article.
References
-
- Chakraborty S., Pattanayak A., Mandal S., Das M., Roychowdhury R. Crop Improvement in the Era of Climate Change. IK International Publishing House; New Delhi, India: 2014. An Overview of Climate Change: Causes, Trends and Implications; pp. 1–29.
-
- Roychowdhury R. Crop Improvement in the Era of Climate Change. IK International Publishing House; New Delhi, India: 2014.
-
- Roychowdhury R., Choudhury S., Hasanuzzaman M., Srivastava S. Sustainable Agriculture in the Era of Climate Change. Springer; Berlin/Heidelberg, Germany: 2020.
-
- Song Y., Jiao W., Wang J., Wang L. Increased Global Vegetation Productivity despite Rising Atmospheric Dryness over the Last Two Decades. Earth’s Future. 2022;10:e2021EF002634. doi: 10.1029/2021EF002634. - DOI
LinkOut - more resources
Full Text Sources
