

Comprehensive Physiologically Based Pharmacokinetic Model to Assess Drug-Drug Interactions of Phenytoin
- PMID: 37896246
- PMCID: PMC10609929
- DOI: 10.3390/pharmaceutics15102486
Comprehensive Physiologically Based Pharmacokinetic Model to Assess Drug-Drug Interactions of Phenytoin
Abstract
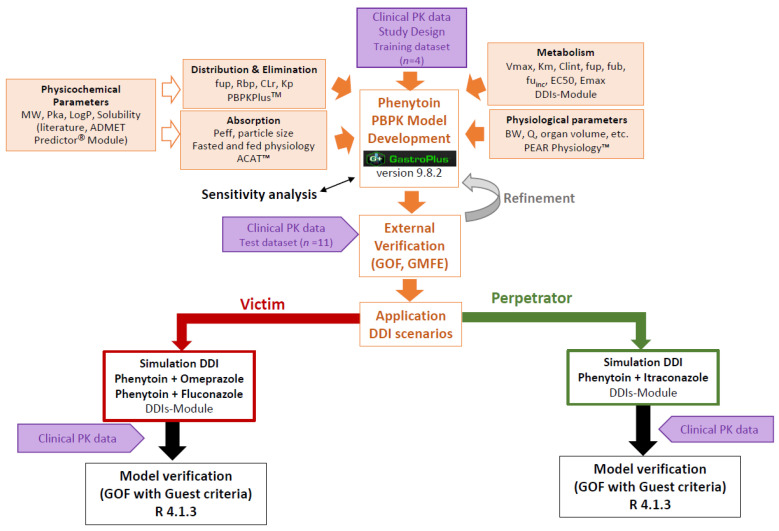
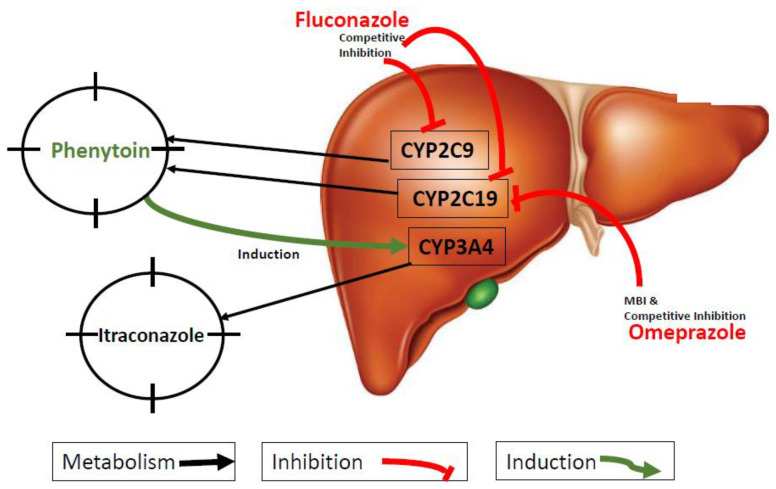
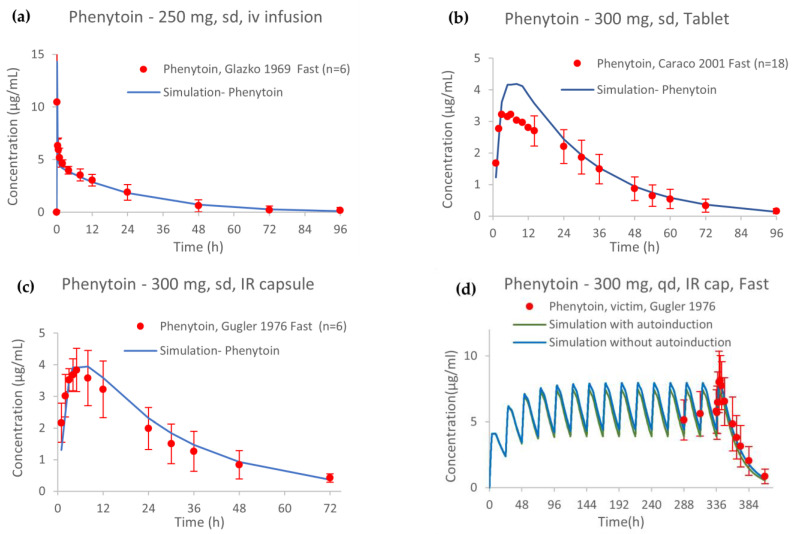
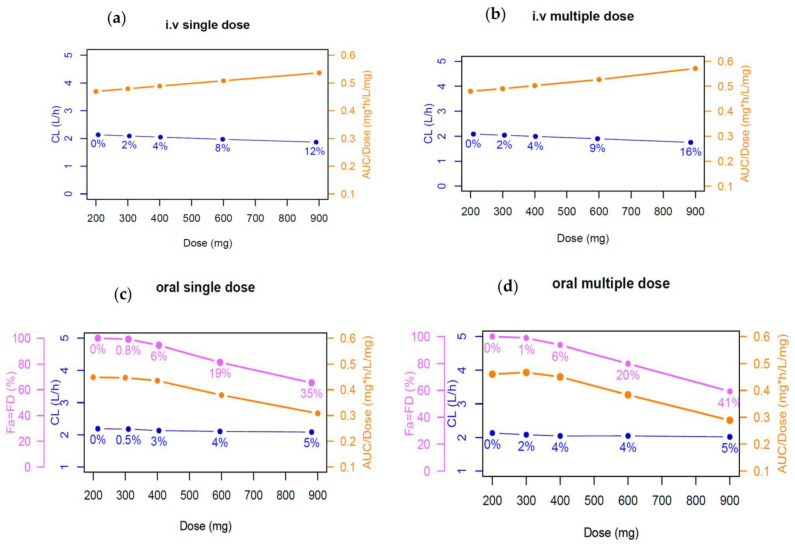
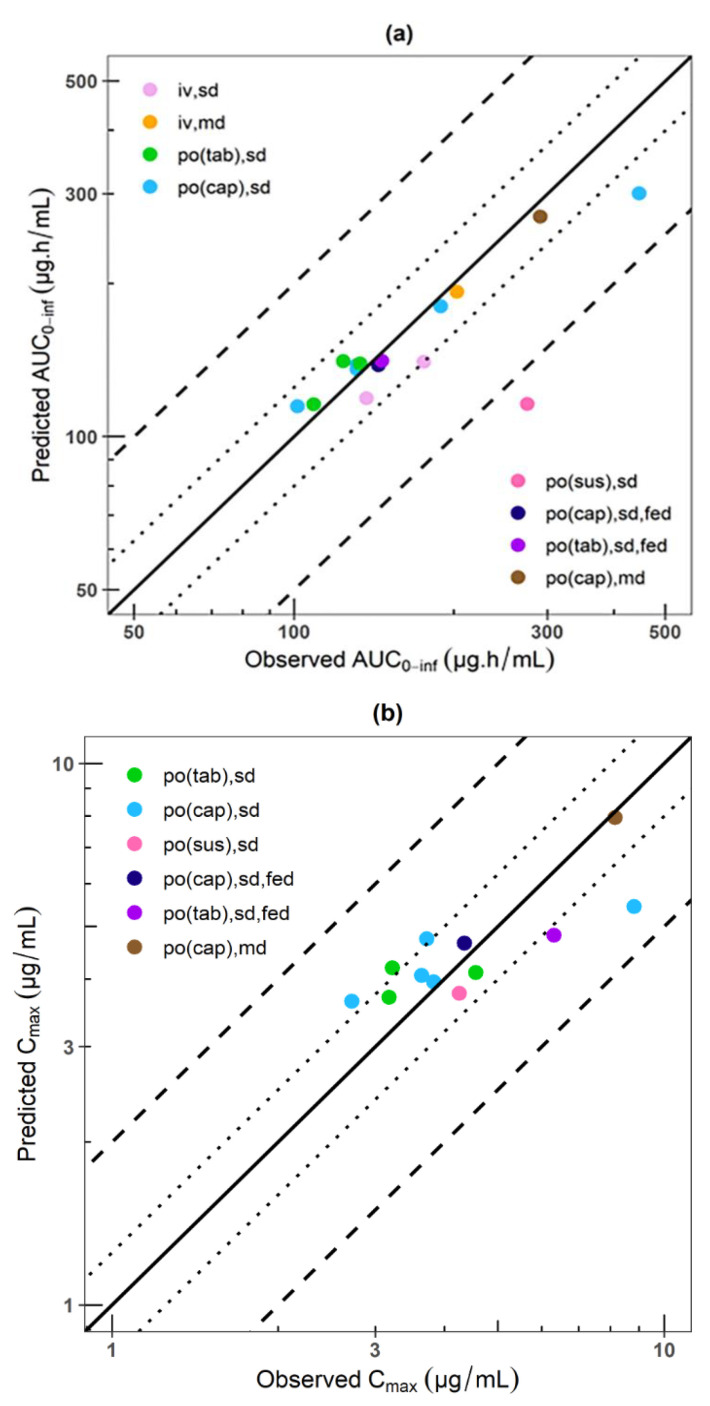
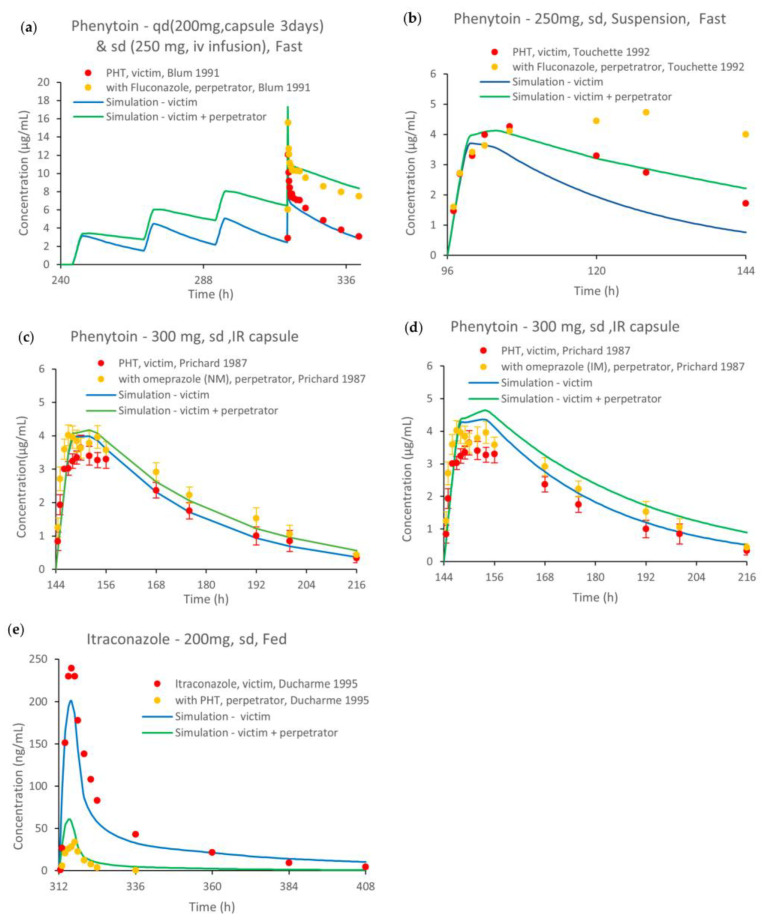
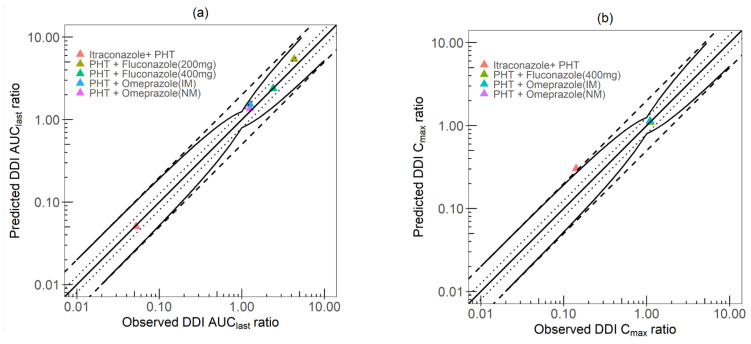
Regulatory agencies worldwide expect that clinical pharmacokinetic drug-drug interactions (DDIs) between an investigational new drug and other drugs should be conducted during drug development as part of an adequate assessment of the drug's safety and efficacy. However, it is neither time nor cost efficient to test all possible DDI scenarios clinically. Phenytoin is classified by the Food and Drug Administration as a strong clinical index inducer of CYP3A4, and a moderate sensitive substrate of CYP2C9. A physiologically based pharmacokinetic (PBPK) platform model was developed using GastroPlus® to assess DDIs with phenytoin acting as the victim (CYP2C9, CYP2C19) or perpetrator (CYP3A4). Pharmacokinetic data were obtained from 15 different studies in healthy subjects. The PBPK model of phenytoin explains the contribution of CYP2C9 and CYP2C19 to the formation of 5-(4'-hydroxyphenyl)-5-phenylhydantoin. Furthermore, it accurately recapitulated phenytoin exposure after single and multiple intravenous and oral doses/formulations ranging from 248 to 900 mg, the dose-dependent nonlinearity and the magnitude of the effect of food on phenytoin pharmacokinetics. Once developed and verified, the model was used to characterize and predict phenytoin DDIs with fluconazole, omeprazole and itraconazole, i.e., simulated/observed DDI AUC ratio ranging from 0.89 to 1.25. This study supports the utility of the PBPK approach in informing drug development.
Keywords: cytochrome P450 2C19 (CYP2C19); cytochrome P450 2C9 (CYP2C9); drug–drug interactions (DDIs); phenytoin; physiologically based pharmacokinetic modelling (PBPK).
Conflict of interest statement
All authors declare no conflict of interest that are directly relevant to the content of this manuscript. V.L. is an employee and holds stocks in Simulations Plus Inc.
Figures
Similar articles
-
Applying Physiologically Based Pharmacokinetic Modeling to Interpret Carbamazepine's Nonlinear Pharmacokinetics and Its Induction Potential on Cytochrome P450 3A4 and Cytochrome P450 2C9 Enzymes.Pharmaceutics. 2024 May 30;16(6):737. doi: 10.3390/pharmaceutics16060737. Pharmaceutics. 2024. PMID: 38931859 Free PMC article.
-
Drug-drug interaction (DDI) assessments of ruxolitinib, a dual substrate of CYP3A4 and CYP2C9, using a verified physiologically based pharmacokinetic (PBPK) model to support regulatory submissions.Drug Metab Pers Ther. 2019 May 30;34(2):/j/dmdi.2019.34.issue-2/dmpt-2018-0042/dmpt-2018-0042.xml. doi: 10.1515/dmpt-2018-0042. Drug Metab Pers Ther. 2019. PMID: 31145690
-
Physiologically Based Pharmacokinetic Modelling of Cytochrome P450 2C9-Related Tolbutamide Drug Interactions with Sulfaphenazole and Tasisulam.Eur J Drug Metab Pharmacokinet. 2018 Jun;43(3):355-367. doi: 10.1007/s13318-017-0447-5. Eur J Drug Metab Pharmacokinet. 2018. PMID: 29119333 Free PMC article.
-
Translational aspects of cytochrome P450-mediated drug-drug interactions: A case study with clopidogrel.Basic Clin Pharmacol Toxicol. 2022 Jan;130 Suppl 1:48-59. doi: 10.1111/bcpt.13647. Epub 2021 Sep 25. Basic Clin Pharmacol Toxicol. 2022. PMID: 34410044 Review.
-
Prediction of drug-drug interaction potential using physiologically based pharmacokinetic modeling.Arch Pharm Res. 2017 Dec;40(12):1356-1379. doi: 10.1007/s12272-017-0976-0. Epub 2017 Oct 27. Arch Pharm Res. 2017. PMID: 29079968 Review.
Cited by
-
Physiologically based pharmacokinetic modeling supports investigation of potential drug-drug interactions in the pre- and early post-hematopoietic stem cell transplantation stages.Front Pharmacol. 2025 May 2;16:1578643. doi: 10.3389/fphar.2025.1578643. eCollection 2025. Front Pharmacol. 2025. PMID: 40385481 Free PMC article.
-
Pharmacokinetics-Pharmacodynamics Modeling for Evaluating Drug-Drug Interactions in Polypharmacy: Development and Challenges.Clin Pharmacokinet. 2024 Jul;63(7):919-944. doi: 10.1007/s40262-024-01391-2. Epub 2024 Jun 18. Clin Pharmacokinet. 2024. PMID: 38888813 Review.
-
Applying Physiologically Based Pharmacokinetic Modeling to Interpret Carbamazepine's Nonlinear Pharmacokinetics and Its Induction Potential on Cytochrome P450 3A4 and Cytochrome P450 2C9 Enzymes.Pharmaceutics. 2024 May 30;16(6):737. doi: 10.3390/pharmaceutics16060737. Pharmaceutics. 2024. PMID: 38931859 Free PMC article.
References
-
- Shebley M., Sandhu P., Emami Riedmaier A., Jamei M., Narayanan R., Patel A., Peters S.A., Reddy V.P., Zheng M., de Zwart L., et al. Physiologically Based Pharmacokinetic Model Qualification and Reporting Procedures for Regulatory Submissions: A Consortium Perspective. Clin. Pharmacol. Ther. 2018;104:88–110. doi: 10.1002/cpt.1013. - DOI - PMC - PubMed
-
- Talati R., Scholle J.M., Phung O.J., Baker W.L., Baker E.L., Ashaye A., Kluger J., Quercia R., Mather J., Giovenale S., et al. Effectiveness and Safety of Antiepileptic Medications in Patients with Epilepsy. 40th ed. Agency for Healthcare Research and Quality (US); Rockville, MD, USA: 2011. - PubMed
LinkOut - more resources
Full Text Sources
