

Predictive Potential of Cmax Bioequivalence in Pilot Bioavailability/Bioequivalence Studies, through the Alternative ƒ2 Similarity Factor Method
- PMID: 37896259
- PMCID: PMC10610255
- DOI: 10.3390/pharmaceutics15102498
Predictive Potential of Cmax Bioequivalence in Pilot Bioavailability/Bioequivalence Studies, through the Alternative ƒ2 Similarity Factor Method
Abstract
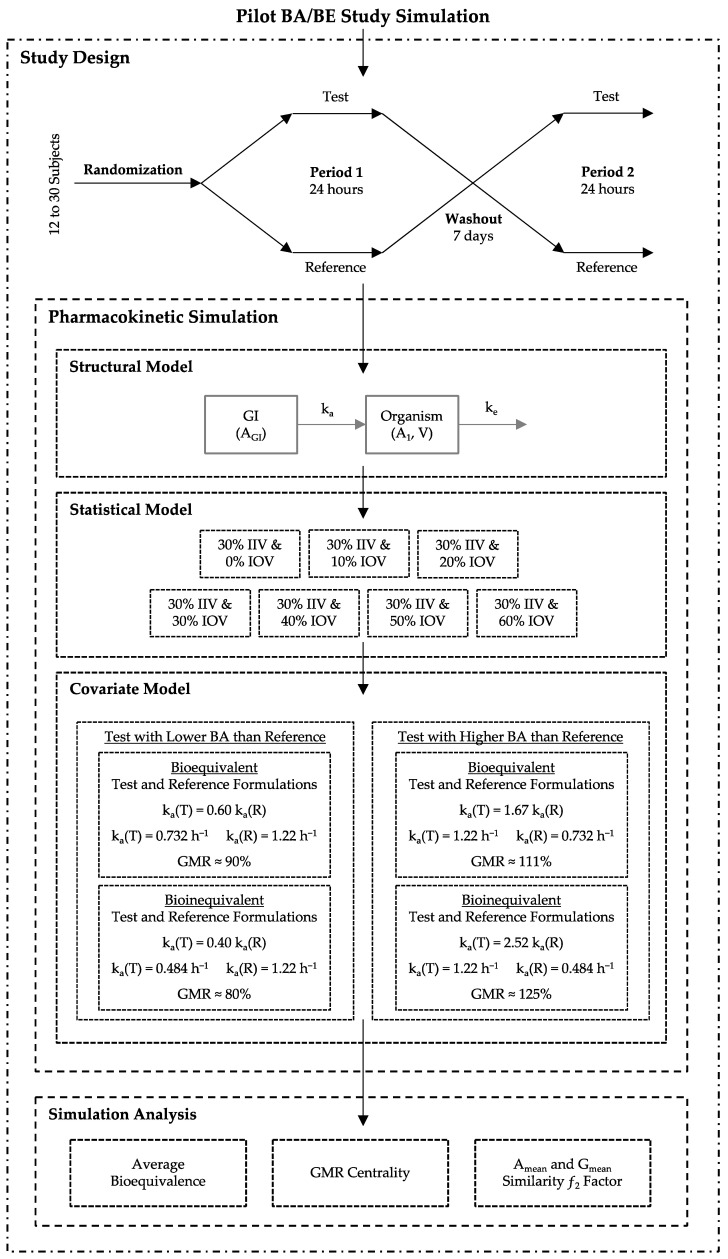
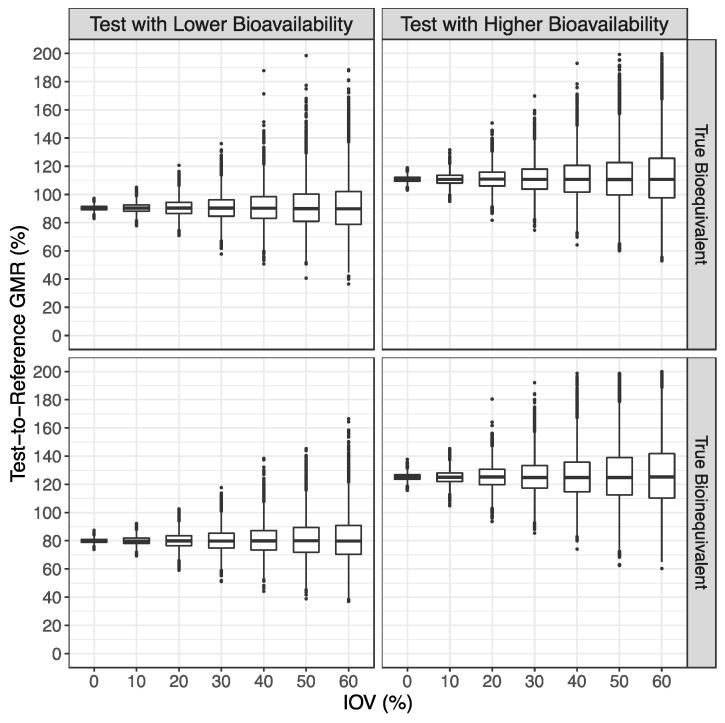
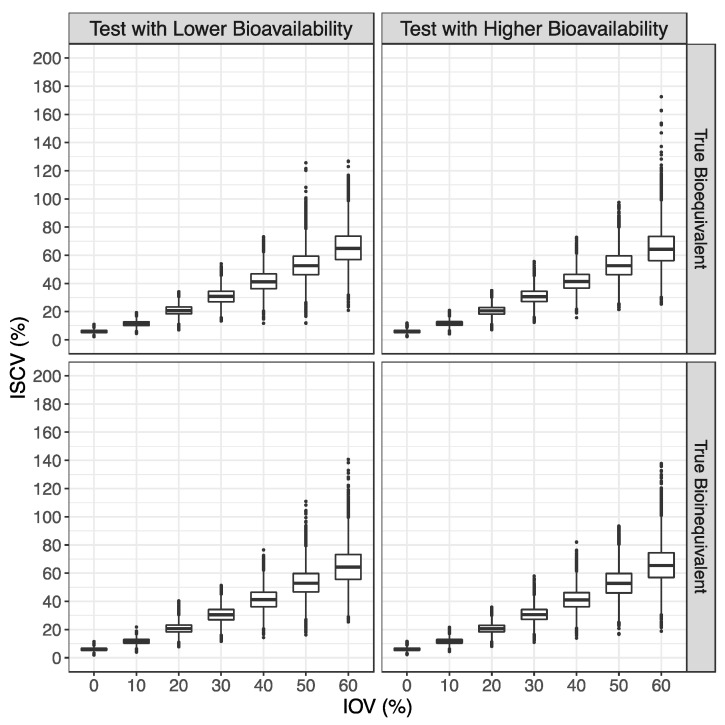
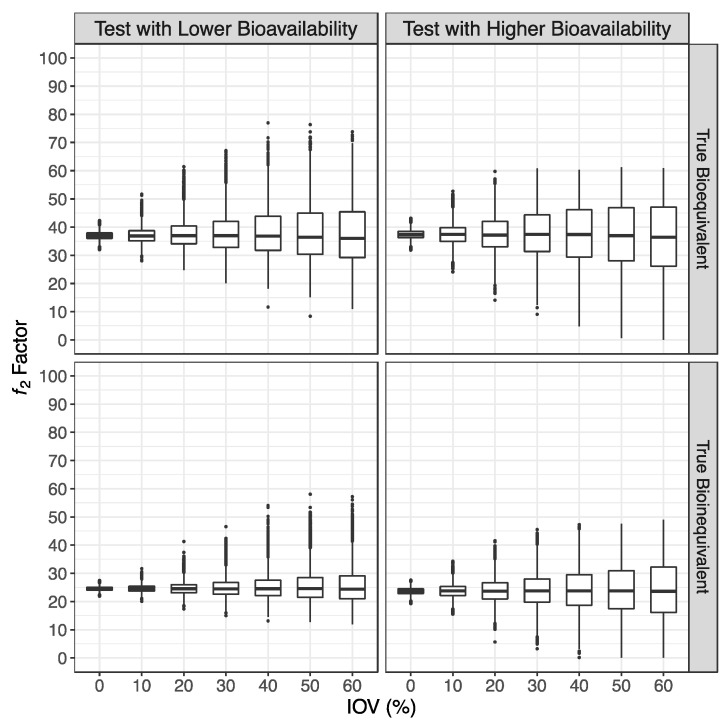
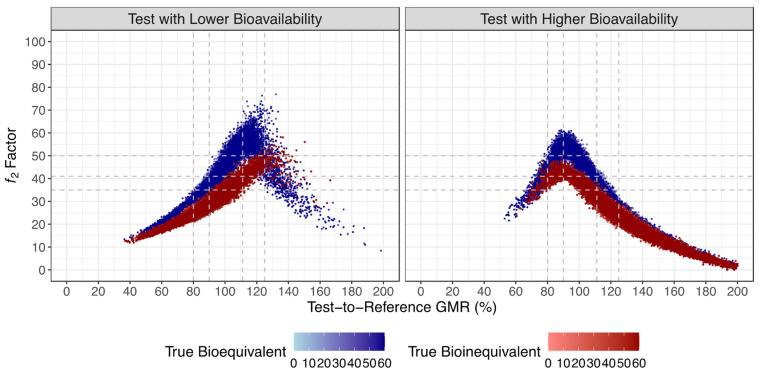
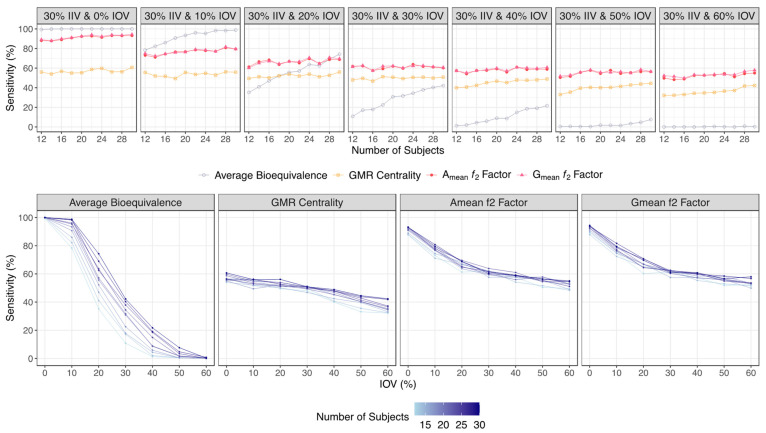
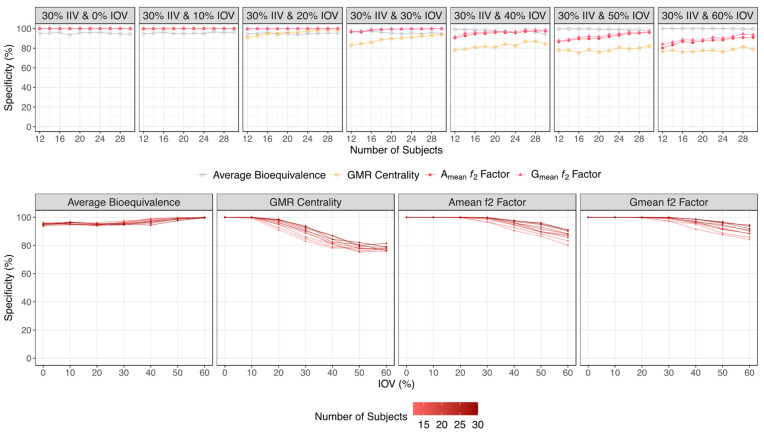
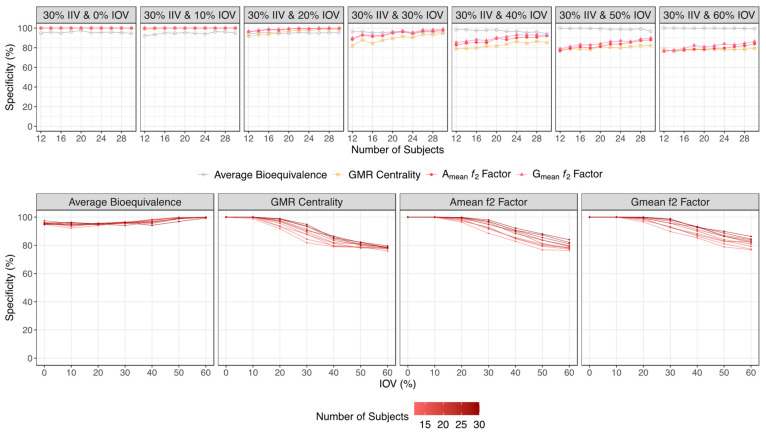
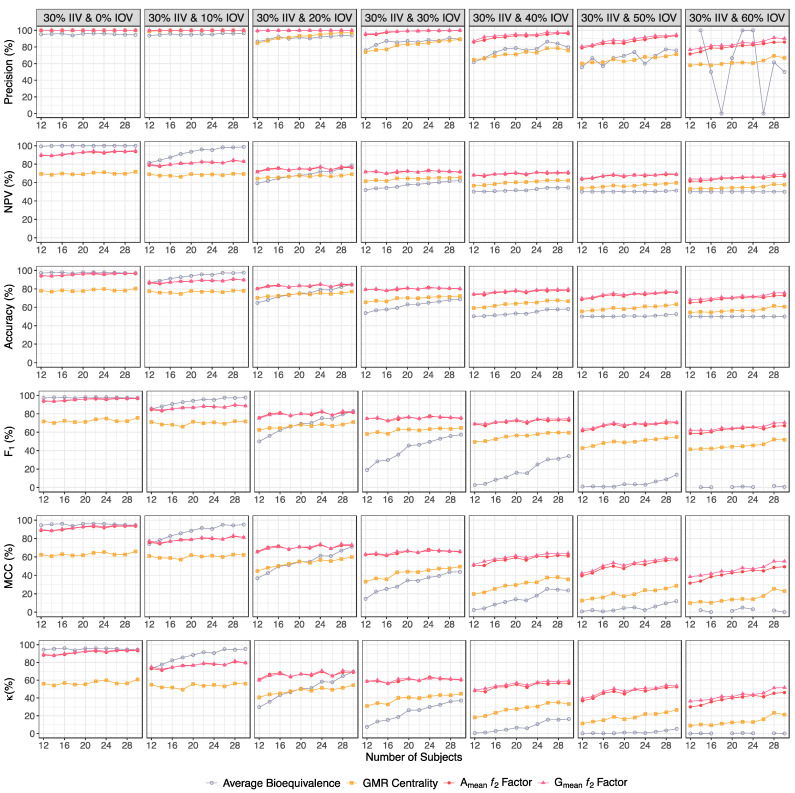
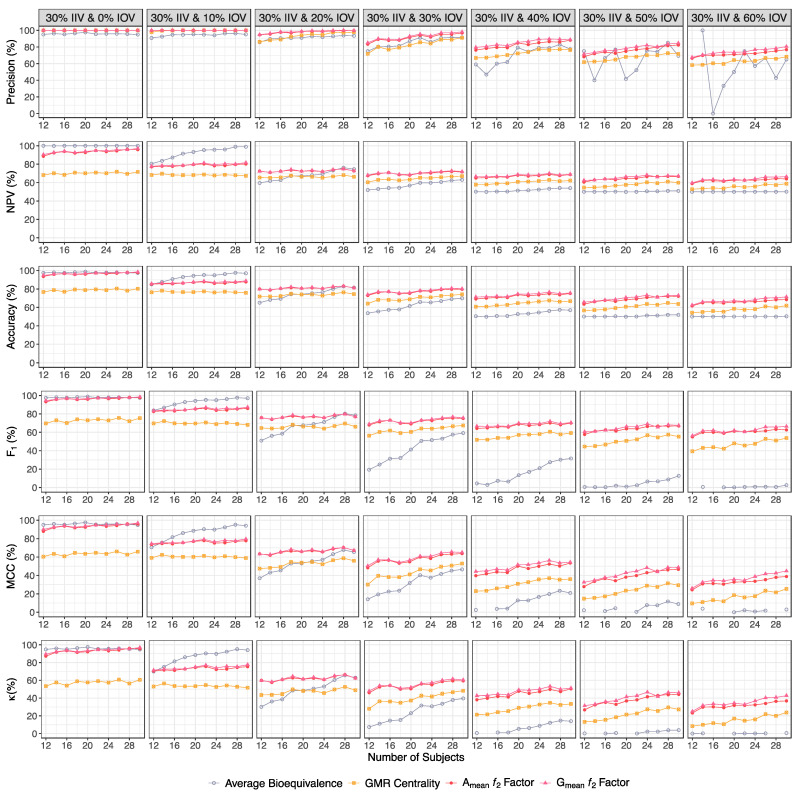
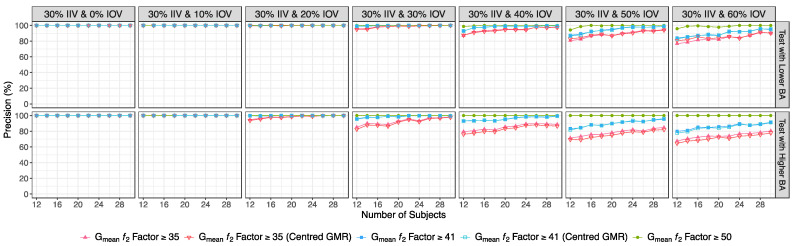
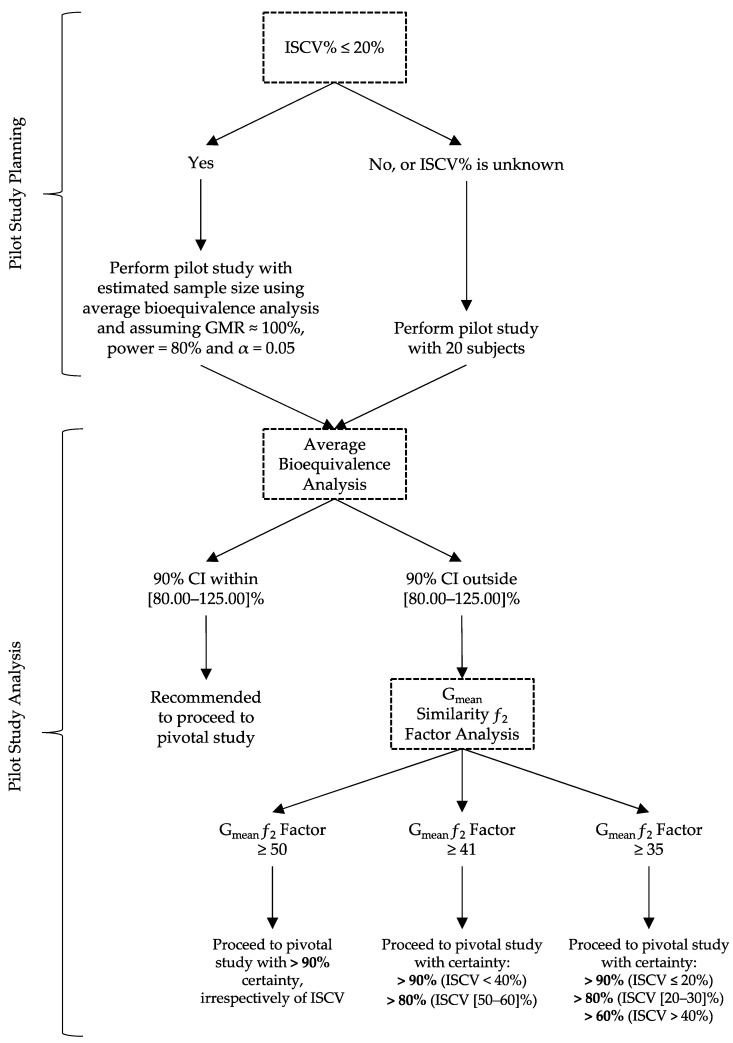
Pilot bioavailability/bioequivalence (BA/BE) studies are downsized trials that can be conducted prior to the definitive pivotal trial. In these trials, 12 to 18 subjects are usually enrolled, although, in principle, a sample size is not formally calculated. In a previous work, authors recommended the use of an alternative approach to the average bioequivalence methodology to evaluate pilot studies' data, using the geometric mean (Gmean) ƒ2 factor with a cut off of 35, which has shown to be an appropriate method to assess the potential bioequivalence for the maximum observed concentration (Cmax) metric under the assumptions of a true Test-to-Reference Geometric Mean Ratio (GMR) of 100% and an inter-occasion variability (IOV) in the range of 10% to 45%. In this work, the authors evaluated the proposed ƒ2 factor in comparison with the standard average bioequivalence in more extreme scenarios, using a true GMR of 90% or 111% for truly bioequivalent formulations, and 80% or 125% for truly bioinequivalent formulations, in order to better derive conclusions on the potential of this analysis method. Several scenarios of pilot BA/BE crossover studies were simulated through population pharmacokinetic modelling, accounting for different IOV levels. A redefined decision tree is proposed, suggesting a fixed sample size of 20 subjects for pilot studies in the case of intra-subject coefficient of variation (ISCV%) > 20% or unknown variability, and suggesting the assessment of study results through the average bioequivalence analysis, and additionally through Gmean ƒ2 factor method in the case of the 90% confidence interval (CI) for GMR is outside the regulatory acceptance bioequivalence interval of [80.00-125.00]%. Using this alternative approach, the certainty levels to proceed with pivotal studies, depending on Gmean ƒ2 values and variability scenarios tested (20-60% IOV), were assessed, which is expected to be helpful in terms of the decision to proceed with pivotal bioequivalence studies.
Keywords: bioequivalence; generic medicinal products; modelling and simulation; pharmacokinetic simulation; pharmacokinetics; pilot studies; ƒ2 factor.
Conflict of interest statement
The authors declare no conflict of interest. The company had no role in the design of the study; in the collection, analyses, or interpretation of data; in the writing of the manuscript, and in the decision to publish the results.
Figures

Similar articles
-
Unveiling the Potential of Cmaxf2 Factor Applied to Pilot Bioavailability/Bioequivalence Studies-A Case Study with Pazopanib Drug Products.Pharmaceutics. 2024 Dec 11;16(12):1579. doi: 10.3390/pharmaceutics16121579. Pharmaceutics. 2024. PMID: 39771558 Free PMC article.
-
Alternative Analysis Approaches for the Assessment of Pilot Bioavailability/Bioequivalence Studies.Pharmaceutics. 2023 May 7;15(5):1430. doi: 10.3390/pharmaceutics15051430. Pharmaceutics. 2023. PMID: 37242672 Free PMC article.
-
Quantitative assessment of the switchability of generic products.Eur J Pharm Sci. 2013 Nov 20;50(3-4):476-83. doi: 10.1016/j.ejps.2013.08.023. Epub 2013 Aug 24. Eur J Pharm Sci. 2013. PMID: 23981332
-
The bioequivalence of highly variable drugs and drug products.Int J Clin Pharmacol Ther. 2005 Oct;43(10):485-98. doi: 10.5414/cpp43485. Int J Clin Pharmacol Ther. 2005. PMID: 16240706 Review.
-
Comparison of average and population bioequivalence approach.Int J Clin Pharmacol Ther. 2002 Sep;40(9):431-8. doi: 10.5414/cpp40431. Int J Clin Pharmacol Ther. 2002. PMID: 12358161 Review.
Cited by
-
Unveiling the Potential of Cmaxf2 Factor Applied to Pilot Bioavailability/Bioequivalence Studies-A Case Study with Pazopanib Drug Products.Pharmaceutics. 2024 Dec 11;16(12):1579. doi: 10.3390/pharmaceutics16121579. Pharmaceutics. 2024. PMID: 39771558 Free PMC article.
References
-
- European Medicines Agency (EMA) Guideline on the Investigation of Bioequivalence (CPMP/EWP/QWP/1401/98 Rev. 1/ Corr **). London. Jan 20, 2010. [(accessed on 29 August 2023)]. Available online: https://www.ema.europa.eu/en/documents/scientific-guideline/guideline-in....
-
- U.S. Food and Drug Administration (FDA) Guidance for Industry: Bioequivalence Studies with Pharmacokinetic Endpoints for Drugs Submitted under an ANDA. Draft Guidance. August 2021. [(accessed on 29 August 2023)]; Available online: https://www.fda.gov/media/87219/download.
LinkOut - more resources
Full Text Sources
Research Materials
Miscellaneous
