. 2023 Sep 28;15(10):2017.
doi: 10.3390/v15102017.

CovidShiny: An Integrated Web Tool for SARS-CoV-2 Mutation Profiling and Molecular Diagnosis Assay Evaluation In Silico

Affiliations

CovidShiny: An Integrated Web Tool for SARS-CoV-2 Mutation Profiling and Molecular Diagnosis Assay Evaluation In Silico

Shaoqian Ma et al. Viruses. .

Abstract

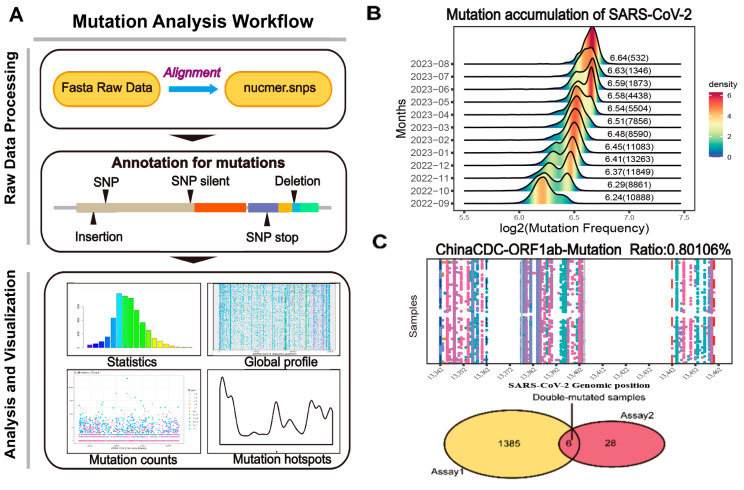
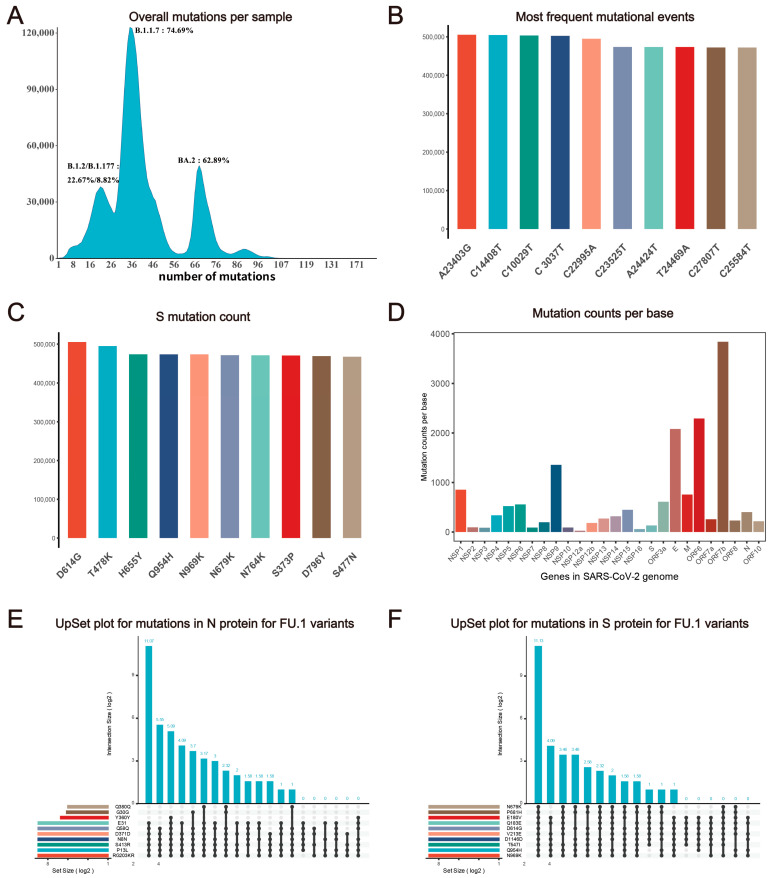
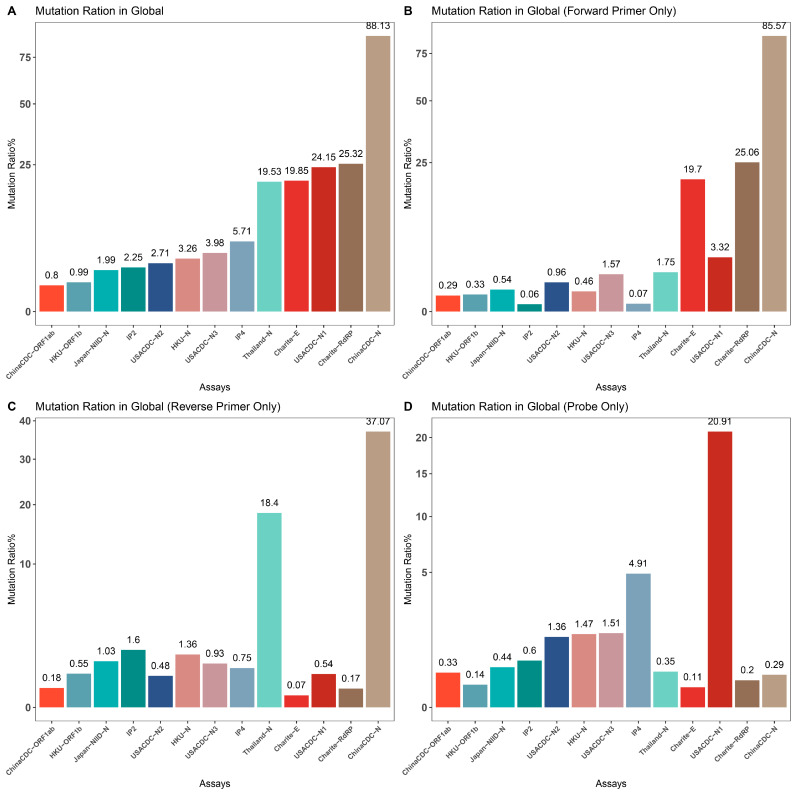
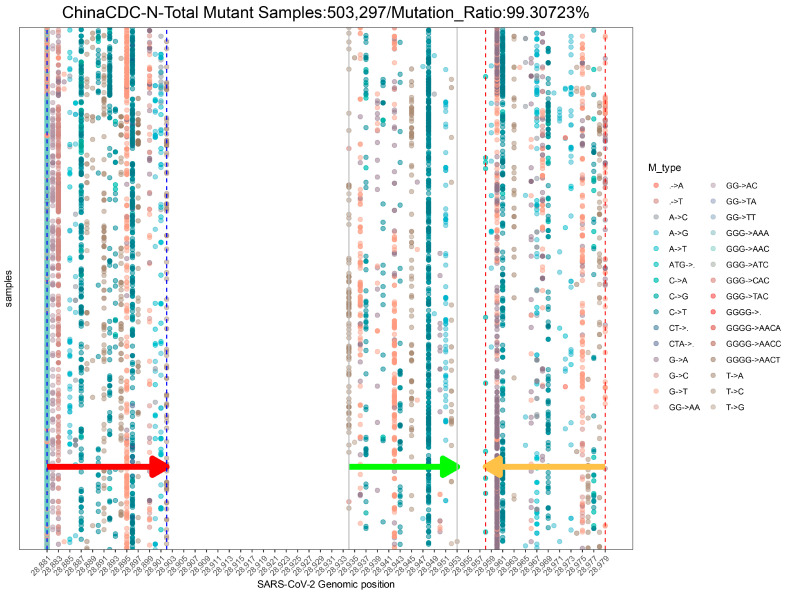
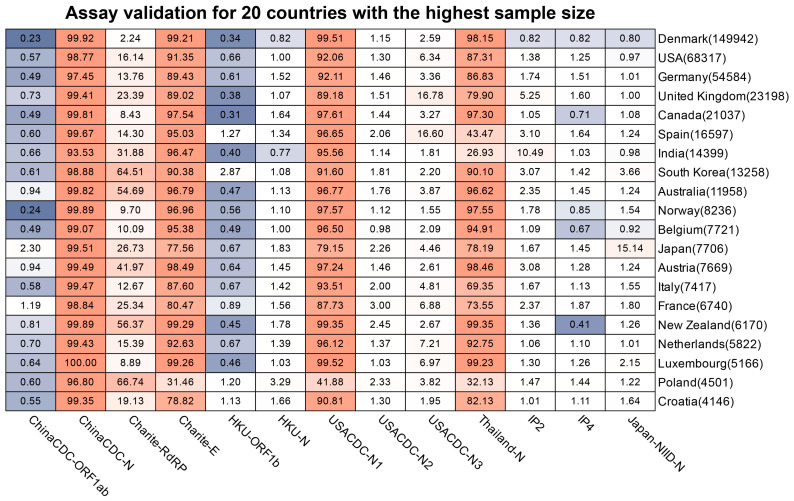
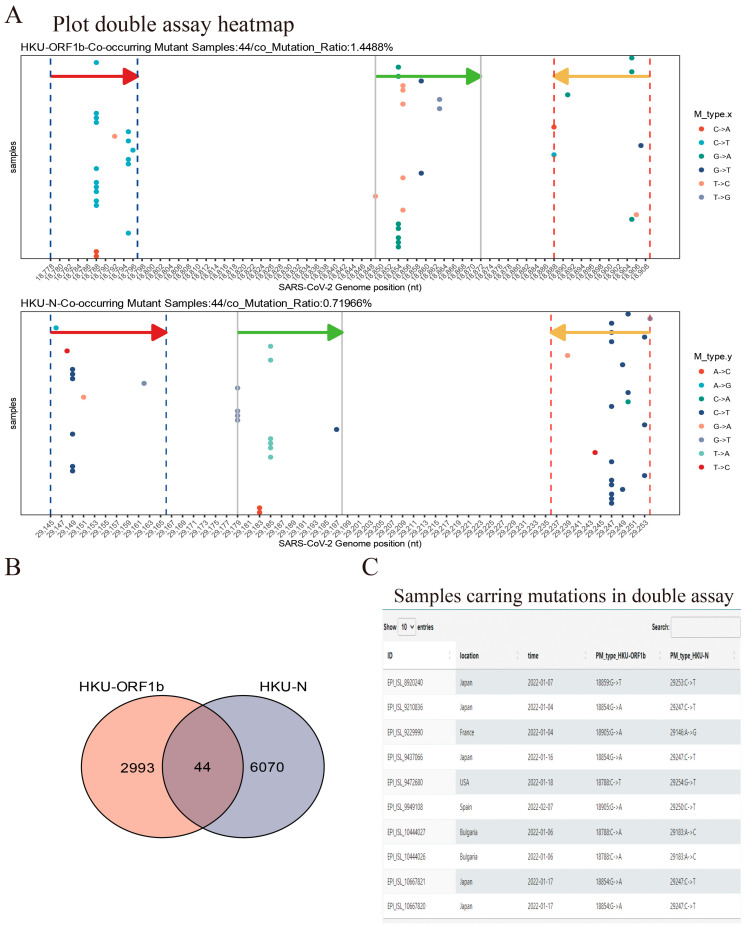
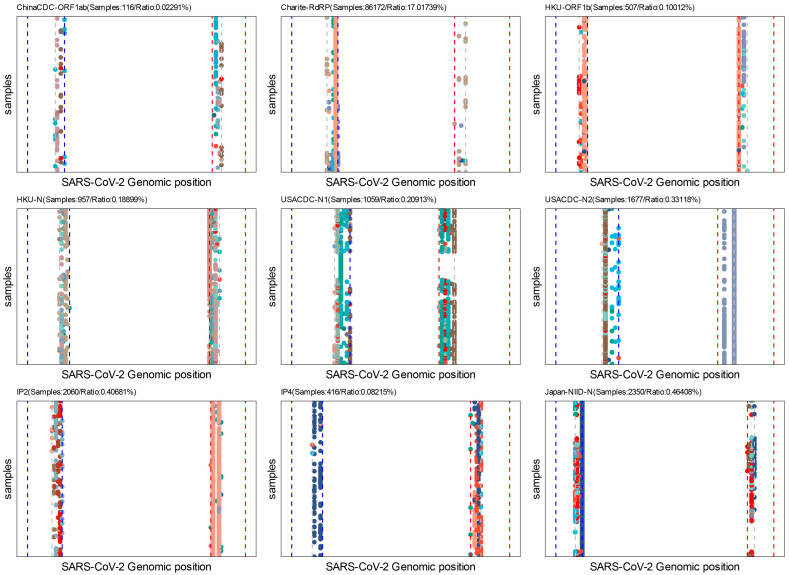
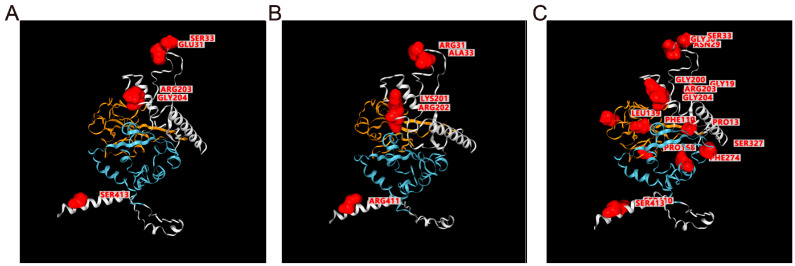
The coronavirus disease 2019 (COVID-19) pandemic is still ongoing, with severe acute respiratory syndrome coronavirus 2 (SARS-CoV-2) continuing to evolve and accumulate mutations. While various bioinformatics tools have been developed for SARS-CoV-2, a well-curated mutation-tracking database integrated with in silico evaluation for molecular diagnostic assays is currently unavailable. To address this, we introduce CovidShiny, a web tool that integrates mutation profiling, in silico evaluation, and data download capabilities for genomic sequence-based SARS-CoV-2 assays and data download. It offers a feasible framework for surveilling the mutation of SARS-CoV-2 and evaluating the coverage of the molecular diagnostic assay for SARS-CoV-2. With CovidShiny, we examined the dynamic mutation pattern of SARS-CoV-2 and evaluated the coverage of commonly used assays on a large scale. Based on our in silico analysis, we stress the importance of using multiple target molecular diagnostic assays for SARS-CoV-2 to avoid potential false-negative results caused by viral mutations. Overall, CovidShiny is a valuable tool for SARS-CoV-2 mutation surveillance and in silico assay design and evaluation.

Keywords: SARS-CoV-2; assay evaluation; integrated web tool; mutation analysis.


Conflict of interest statement

The authors declare no conflict of interest.

Figures

Figure 1
Figure 1
The framework of CovidShiny. (A) Mutation analysis workflow of CovidShiny. After alignment with the query sequence with the reference sequence, the output contains the position of all mutations of SARS-CoV-2. Mutation annotation includes identifying mutational events (SNP, insertion, deletion, etc.). (B) The density ridgeline plot of mutation-frequency accumulation since September 2022. The number shown beside the ridge is the log2 transformed average mutation counts of SARS-CoV-2 in a month (with a total sample number per month in brackets). (C) RT-PCR assay validation. With primers binding sites and the total number of virus samples available, assays are evaluated according to their potential in detecting coverage in large-sized SARS-CoV-2 samples, since assays targeting regions with continuing-mutating patterns may lead to confusing results. Samples carrying double mutations in double-assay are also presented in CovidShiny.
Figure 2
Figure 2
Statistics description of SARS-CoV-2 mutation features. (A) Distribution of mutation counts per sample. The x-axis represents the number of mutations and the y-axis represents the number of samples with a corresponding mutation number. Variants with the largest sample number in peaks and their percentage are labeled around each peak. (B) Frequency of top 10 nucleotide variant types globally. (C) The frequency of mutational events shows the top 10 popular variants in SARS-CoV-2 spike protein. (D) Average mutation counts per base in genes. (E) UpsetR plot of mutations (N protein of all FU.1 variant samples; only the top 10 mutations are shown). (F) UpsetR plot of mutations (S protein of all FU.1 variant samples; only the top 10 mutations are shown).
Figure 3
Figure 3
Mutation ratio for the demo assays. We calculated the mutation rate in primers and probe binding regions for popular assays and summarized them for comparison. (A) Overall mutation rate for primer and probe binding regions for each assay. (B) Mutation rate for forward primer binding region for each assay. (C) Mutation rate for reverse primer binding region for each assay. (D) Mutation rate for probe binding region for each assay.
Figure 4
Figure 4
The demo mutation profile in the genomic binding sites of ChinaCDC-N primers and probe globally. This profile uses samples collected from 1 January 2022 to 26 June 2023. Only the top 30 mutation types with the highest occurrence frequency are shown in this profile. The arrows indicate the location and direction of primers or probes (red arrow: forward primer; green arrow: probe; orange arrow: reverse primer).
Figure 5
Figure 5
Mutation ratio of commonly used assays across the countries and regions. We selected countries and regions with the highest sample size that was submitted after 1 January 2022, to draw the heatmap. The red color indicates the severity of mutations in the assay (for the related country). The blue color indicates the less severity of mutations in the assay (for the related country). The number in the bracket next to the country is the total of the samples available.
Figure 6
Figure 6
Demo for Double-assay module usage. (A) Samples submitted after 1 January 2022 show mutations occurring in both HKU-ORF1b and HKU-N primers/probe binding sites. The arrows indicate the location and direction of primers or probes (red arrow: forward primer; green arrow: probe; orange arrow: reverse primer). (B) Sample counts that contained a mutation in the target site for both assays; 44 samples shown in (A) have mutations in both assays—target sites in this case. (C) The information table of double-mutated samples is available for download (10 queries are shown).
Figure 7
Figure 7
Batch assay analysis for the last five nucleotides of primers. Each point in the figure represents a single mutation in the binding sites of the last five nucleotides of forward or reverse primers. Only samples submitted after 1 January 2022 are used in these analyses. Colors indicate different variation types (A- > G, G- > C, etc.). The blue dash line indicates the forward primer and the red dash line indicates the reverse primer; the grey dash line indicates the start of the last five nucleotides for primers.
Figure 8
Figure 8
Structures and mutation labels for SARS-CoV-2 S protein. (A) Nucleocapsid protein structures of original variants (NC_045512.2) predicted by I-TASSER, mutation position for BA.2.75 variants are labeled and highlighted in this view for comparison with (B). (B) Nucleocapsid protein structures of BA.2.75 variants based on homology modeling using SWISS-MODEL. The mutation position is labeled in red in this view. (C) Mutation labels for BF.7 variants based on structures of original variants; note that this view only labeled positions for mutations without any difference in structure. For all structure views, the blue region is the C terminal domain (CTD), and the orange region is the N terminal domain (NTD). The mutated position is marked red.

Similar articles

References

    1. WHO Coronavirus (COVID-19) Dashboard. [(accessed on 18 July 2023)]. Available online: https://covid19.who.int/
    1. Davis-Gardner M.E., Lai L., Wali B., Samaha H., Solis D., Lee M., Porter-Morrison A., Hentenaar I.T., Yamamoto F., Godbole S., et al. mRNA bivalent booster enhances neutralization against BA.2.75.2 and BQ.1.1. bioRxiv. 2022 doi: 10.1101/2022.10.31.514636. - DOI - PMC - PubMed
    1. Kurhade C., Zou J., Xia H., Liu M., Chang H.C., Ren P., Xie X., Shi P.Y. Low neutralization of SARS-CoV-2 Omicron BA.2.75.2, BQ.1.1 and XBB.1 by parental mRNA vaccine or a BA.5 bivalent booster. Nat. Med. 2023;29:344–347. doi: 10.1038/s41591-022-02162-x. - DOI - PubMed
    1. Miller J., Hachmann N.P., Collier A.-r.Y., Lasrado N., Mazurek C.R., Patio R.C., Powers O., Surve N., Theiler J., Korber B., et al. Substantial Neutralization Escape by SARS-CoV-2 Omicron Variants BQ.1.1 and XBB.1. N. Engl. J. Med. 2023;388:662–664. doi: 10.1056/NEJMc2214314. - DOI - PMC - PubMed
    1. Planas D., Bruel T., Staropoli I., Guivel-Benhassine F., Porrot F., Maes P., Grzelak L., Prot M., Mougari S., Planchais C., et al. Resistance of Omicron subvariants BA.2.75.2, BA.4.6 and BQ.1.1 to neutralizing antibodies. bioRxiv. 2022 doi: 10.1038/s41467-023-36561-6. - DOI - PMC - PubMed

Publication types