. 2023 Oct 8;15(10):2065.
doi: 10.3390/v15102065.

Serological and Molecular Epidemiology of Chikungunya Virus Infection in Vietnam, 2017-2019

Affiliations

Serological and Molecular Epidemiology of Chikungunya Virus Infection in Vietnam, 2017-2019

Thanh Vu Nguyen et al. Viruses. .

Abstract

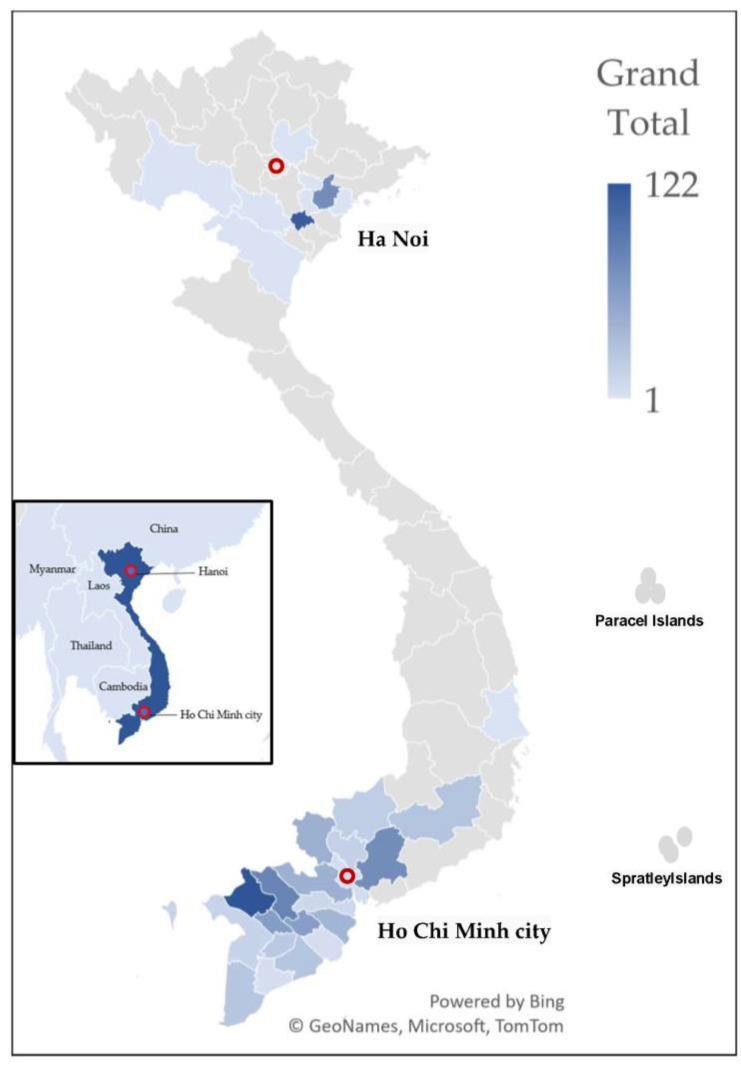
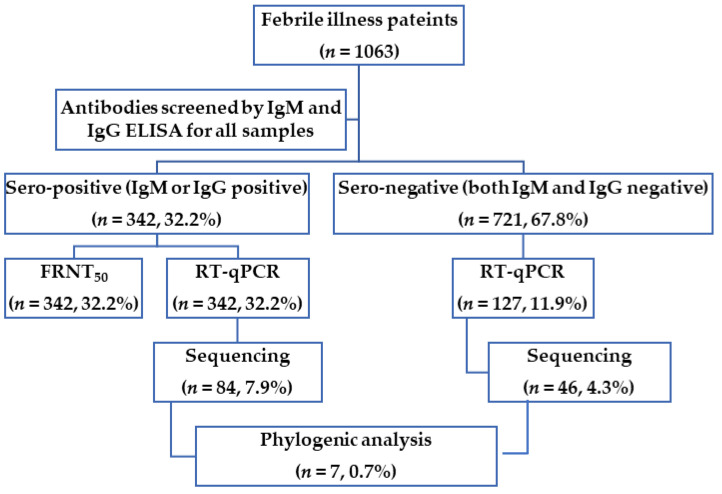
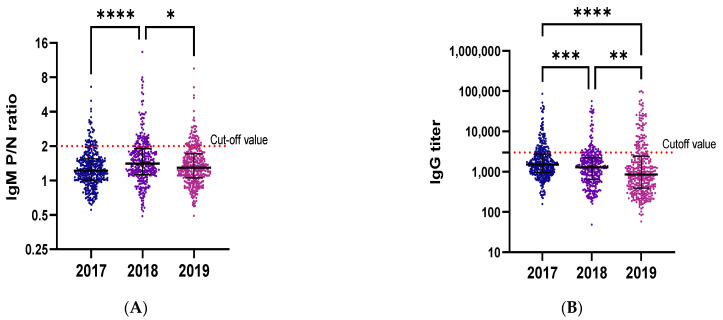
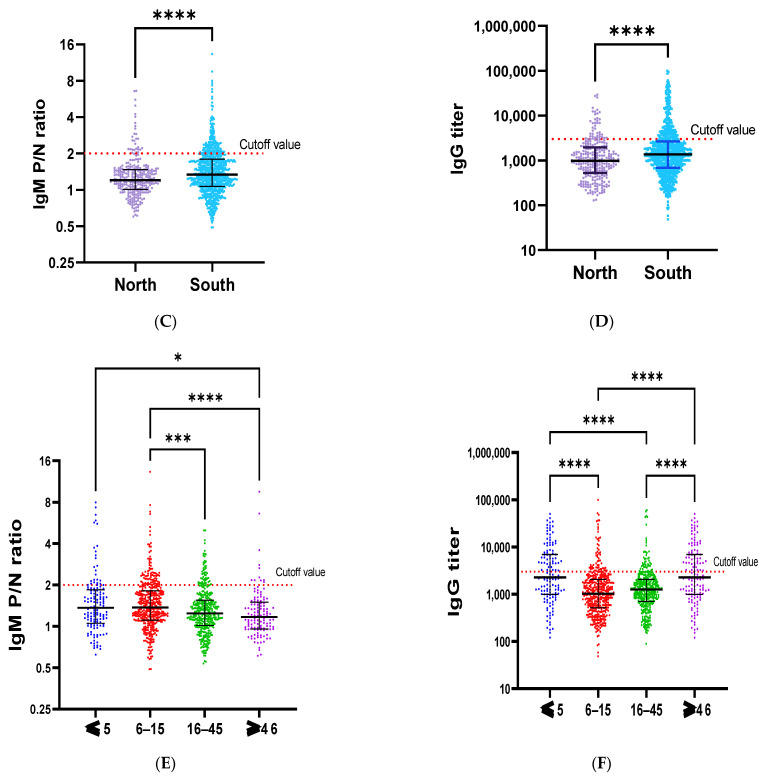
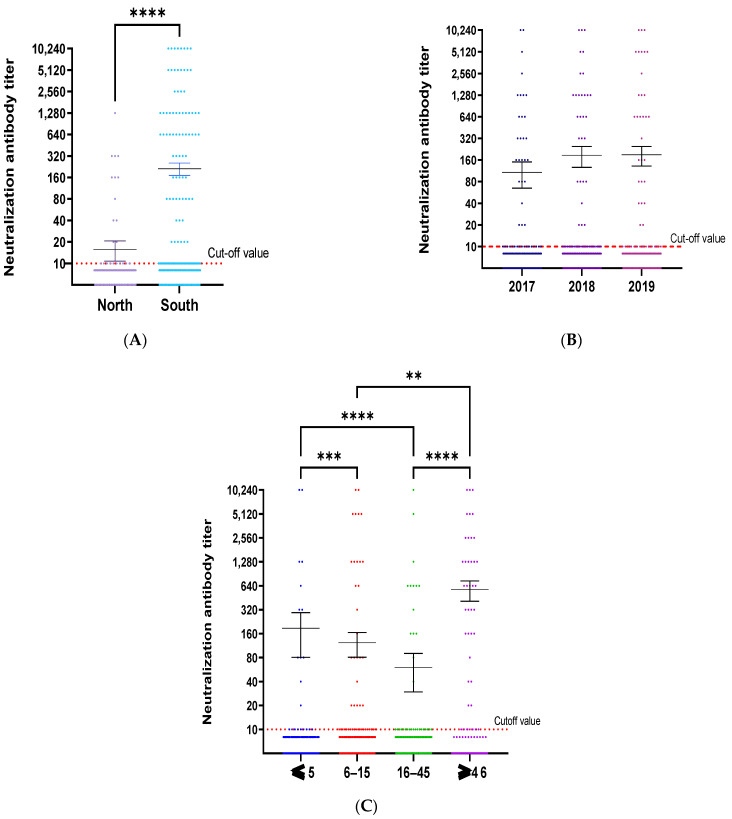
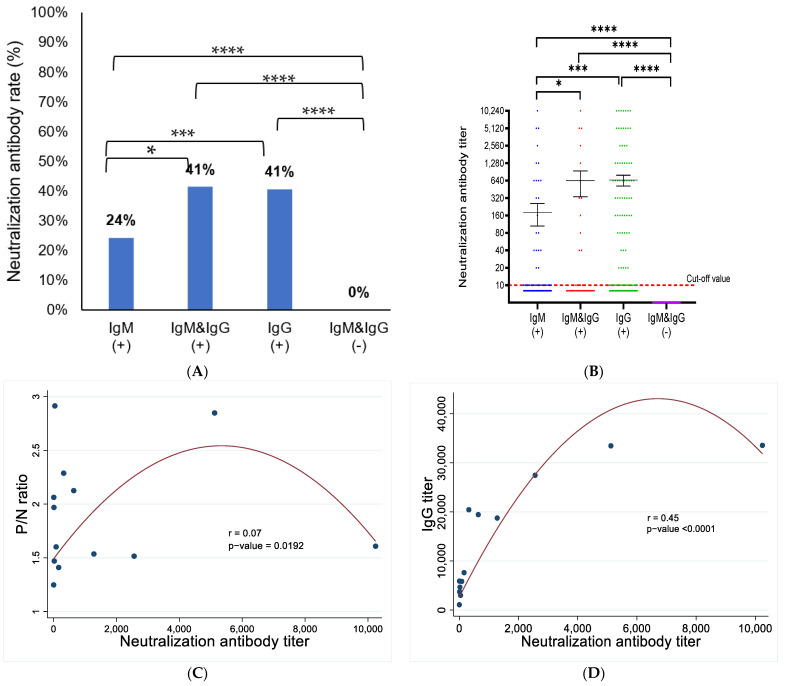
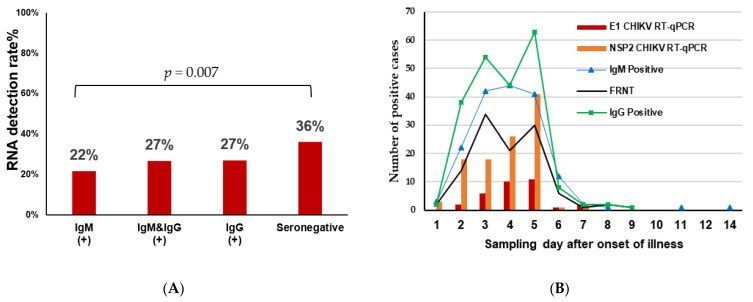
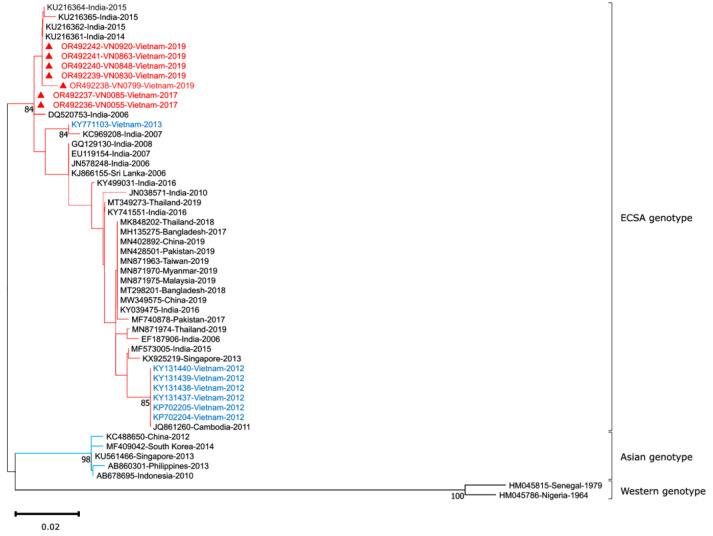
Chikungunya fever is an acute febrile illness caused by the chikungunya virus (CHIKV), which is transmitted by Aedes mosquitoes. Since 1965, only a few studies with limited scope have been conducted on CHIKV in Vietnam. Thus, this study aimed to determine the seroprevalence and molecular epidemiology of CHIKV infection among febrile patients in Vietnam from 2017 to 2019. A total of 1063 serum samples from 31 provinces were collected and tested for anti-CHIKV IgM and IgG ELISA. The 50% focus reduction neutralization test (FRNT50) was used to confirm CHIKV-neutralizing antibodies. Quantitative real-time RT-PCR (RT-qPCR) was performed to confirm the presence of the CHIKV genome. The results showed that 15.9% (169/1063) of the patients had anti-CHIKV IgM antibodies, 20.1% (214/1063) had anti-CHIKV IgG antibodies, 10.4% (111/1063) had CHIKV-neutralizing antibodies, and 27.7% (130/469) of the samples were positive in RT-qPCR analysis. The E1 CHIKV genome sequences were detected among the positive RT-qPCR samples. Our identified sequences belonged to the East/Central/South/African (ECSA) genotype, which has been prevalent in Vietnam previously, suggesting CHIKV has been maintained and is endemic in Vietnam. This study demonstrates a high prevalence of CHIKV infection in Vietnam and calls for an annual surveillance program to understand its impact.

Keywords: Vietnam; chikungunya; molecular epidemiology; seroprevalence.


Conflict of interest statement

The authors declare no conflict of interest.

Figures

Figure 1
Figure 1
Sample distribution map. The inset map depicts the location of Vietnam and neighboring countries. This map illustrates the geographical distribution of serum samples collected from febrile patients in 21 southern provinces and 10 northern Vietnamese provinces. Dark blue indicates provinces with higher sample collection, and light blue represents with lower sample collection. The number of samples ranged from 1 to 122, with a median of 23.
Figure 2
Figure 2
Flowchart and analyses performed in this study. The graph shows the research flowchart and the number of serum samples used for major tests and analysis in this study.
Figure 3
Figure 3
Distribution of IgM P/N ratios and IgG titers over the years, across regions, and age groups. Distribution of the IgM P/N ratio and IgG titer was investigated over the years (A,B), across the regions (C,D), and across age groups (E,F). The P/N ratio is the ratio of the optical density (OD) of the sample to the OD of the negative control. The cutoff value is the red dot line with P/N ratio of 2 for IgM, and titer of 3000 for IgG. The samples with a titer or P/N ratio higher than the cutoff value were considered as positive. p value is defined as follows * p ≤ 0.05; ** p ≤ 0.01; t *** p < 0.001 and **** p < 0.0001.
Figure 3
Figure 3
Distribution of IgM P/N ratios and IgG titers over the years, across regions, and age groups. Distribution of the IgM P/N ratio and IgG titer was investigated over the years (A,B), across the regions (C,D), and across age groups (E,F). The P/N ratio is the ratio of the optical density (OD) of the sample to the OD of the negative control. The cutoff value is the red dot line with P/N ratio of 2 for IgM, and titer of 3000 for IgG. The samples with a titer or P/N ratio higher than the cutoff value were considered as positive. p value is defined as follows * p ≤ 0.05; ** p ≤ 0.01; t *** p < 0.001 and **** p < 0.0001.
Figure 4
Figure 4
Neutralization titer distribution by regions, years and age groups. The distribution of neutralization titer by regions (A), years (B), and age groups (C) is shown. The cutoff value was defined as the red dot line corresponding to a value of 10 for neutralization antibody titer. The sample with a titer higher than the cutoff value was considered as positive. The mean of CHIKV-neutralizing antibodies was compared by regions, years, and age groups using the Kruskal–Wallis test, with the Dunn-Bonferroni correction method for multiple comparison tests. p value was defined as follows ** p ≤ 0.01; *** p < 0.001 and **** p < 0.0001.
Figure 5
Figure 5
Presence of CHIVK neutralizing antibodies in seropositive groups. The presence of NAbs was compared between groups of patients that were positive for IgM and/or IgG, using the Chi-square test for each pair of groups (A). The mean of the NAbs was compared between groups of patients that were positive for IgM and/or IgG, using the Kruskal–Wallis test, with the Dunn-Bonferroni correction method for multiple comparison tests (B). The Pearson correlation coefficient was used to assess the correlation between NAbs titer and the P/N ratio of IgM (C) and the correlation between NAbs titer and IgG titer (D). p value was defined as follows * p ≤ 0.05; *** p < 0.001; **** p < 0.0001.
Figure 6
Figure 6
Comparison of CHIKV RNA presence in seroprevalence groups based on real-time PCR test results. The rates of RNA detection in seropositive and seronegative groups were compared pairwise using the Chi-square test (A). The relationship between the antibody and RNA detection time is depicted based on the days from the onset of symptoms (B).
Figure 7
Figure 7
Evolutionary analysis by the maximum likelihood method. The evolutionary history of CHIKV was inferred using the maximum likelihood (ML) method and the Tamura–Nei model with 1000 bootstrap replications. Bootstrap confidence values are displayed at the branch nodes. The initial trees for the heuristic search were obtained automatically by applying the Neighbor–Join and BioNJ algorithms to a matrix of pairwise distances estimated using the Tamura–Nei model, and then selecting the topology with the superior log likelihood value. The rate variation model allows for some sites to be evolutionarily invariable. This analysis involved 51 nucleotide sequences, including partial E1 sequences from seven CHIKV isolates in this study, along with selected sequences from the GenBank database. The final dataset included 294 positions. Evolutionary analyses were conducted in MEGA 11. The three main CHIKV genotypes are highlighted in different colors, with isolates from the current study indicated by red triangles and red text. The sequences with blue text were CHIKV sequences from previous studies conducted in Vietnam.

References

    1. David M., Knine P.M.H. Fields Virology. Lippincott Williams & Wilkins; Philadelphia, PA, USA: 2013.
    1. Caglioti C., Lalle E., Castilletti C., Carletti F., Capobianchi M.R., Bordi L. Chikungunya Virus Infection: An Overview. New Microbiol. 2013;36:211–227. - PubMed
    1. Suhrbier A. Rheumatic Manifestations of Chikungunya: Emerging Concepts and Interventions. Nat. Rev. Rheumatol. 2019;15:597–611. doi: 10.1038/s41584-019-0276-9. - DOI - PubMed
    1. Seyler T., Hutin Y., Ramanchandran V., Ramakrishnan R., Manickam P., Murhekar M. Estimating the Burden of Disease and the Economic Cost Attributable to Chikungunya, Andhra Pradesh, India, 2005–2006. Trans. R. Soc. Trop. Med. Hyg. 2010;104:133–138. doi: 10.1016/j.trstmh.2009.07.014. - DOI - PubMed
    1. WHO . Guidelines on Clinical Management of Chikungunya Fever. WHO; New Delhi, India: 2008.

Publication types