. 2023 Oct 15;11(10):1596.
doi: 10.3390/vaccines11101596.

A Single-Dose Intramuscular Immunization of Pigs with Lipid Nanoparticle DNA Vaccines Based on the Hemagglutinin Antigen Confers Complete Protection against Challenge Infection with the Homologous Influenza Virus Strain

Affiliations

A Single-Dose Intramuscular Immunization of Pigs with Lipid Nanoparticle DNA Vaccines Based on the Hemagglutinin Antigen Confers Complete Protection against Challenge Infection with the Homologous Influenza Virus Strain

The N Nguyen et al. Vaccines (Basel). .

Abstract

The Influenza A virus of swine (IAV-S) is highly prevalent and causes significant economic losses to swine producers. Due to the highly variable and rapidly evolving nature of the virus, it is critical to develop a safe and versatile vaccine platform that allows for frequent updates of the vaccine immunogens to cope with the emergence of new viral strains. The main objective of this study was to assess the feasibility of using lipid nanoparticles (LNPs) as nanocarriers for delivering DNA plasmid encoding the viral hemagglutinin (HA) gene in pigs. The intramuscular administration of a single dose of the LNP-DNA vaccines resulted in robust systemic and mucosal responses in pigs. Importantly, the vaccinated pigs were fully protected against challenge infection with the homologous IAV-S strain, with only 1 out of 12 vaccinated pigs shedding a low amount of viral genomic RNA in its nasal cavity. No gross or microscopic lesions were observed in the lungs of the vaccinated pigs at necropsy. Thus, the LNP-DNA vaccines are highly effective in protecting pigs against the homologous IAV-S strain and can serve as a promising platform for the rapid development of IAV-S vaccines.

Keywords: DNA vaccine; lipid nanoparticles; swine influenza virus; vaccine platform.


Conflict of interest statement

H.L.X.V., T.N.N., and S.S. have filed a patent application entitled “Methods and Compositions for Vaccine Development and Delivery”. The other authors declare no conflicts of interest.

Figures

Figure 1
Figure 1
Physical characterization of the LNP-DNA vaccines and in vitro transfection efficiency. (A) Particle diameter determination via nanoparticle tracking analysis (NTA). (B) Polydispersity index. (C) Zeta potential. (D) Encapsulation efficiency (EE%). (E) Transfection efficiency in HEK-293T cells. Scale bar = 200 μm.
Figure 2
Figure 2
Systemic and mucosal antibody responses following vaccination. (A) Anti-HA IgG titers in plasma samples collected on various days post-vaccination. Data are expressed as the log10 of the reciprocal of the highest plasma dilution at which anti-HA antibodies were observed. The samples were initially diluted at 1:100 and samples with undetectable antibodies at this dilution were considered negative and assigned a value of 1 log10. (B) Hemagglutinin inhibition (HI) antibody titers measured against the H3N2 TX98 virus. Data are expressed as the reciprocal of the highest plasma dilution at which HI was observed. The samples were initially diluted at 1:10, and samples with undetectable HI activity at this dilution were considered negative and assigned a value of 5. (C) Anti-NP antibody levels were measured using a commercial ELISA kit. Data are presented as the sample-to-negative (S/N) ratio. The horizontal dotted line at S/N of 0.6 is the assay cutoff. Samples with S/N greater than 0.6 were considered negative. (D) HA-specific IgA and IgG in BALF collected at necropsy. Data are presented as optical density values at 405 nm. * p ≤ 0.05, *** p ≤ 0.001, **** p ≤ 0.0001.
Figure 3
Figure 3
Virus-specific IFN-γ-secreting cell responses following vaccination. Data are expressed as the IFN-γ-secreting cells (IFN-γ-SC) per 106 PBMC cells. Data were analyzed via one-way ANOVA, followed by Tukey’s multiple comparisons test. *** p ≤ 0.001.
Figure 4
Figure 4
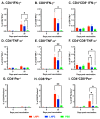
Characterization of the T-cell responses. PBMCs were stimulated with the H3N2 TX98 virus at an MOI of 2. The cells were then stained with antibodies against surface markers (CD3ε, CD4α, and CD8α), followed by staining with antibodies against three intracellular cytokines (IFN-γ, TNF-α, and perforin). (AC) Frequency of cells expressing IFN-α. (DF) Frequency of cells expressing TNF-α. (GI) Frequency of cells expressing perforin (Per). Data were analyzed via the Kruskal–Wallis test, followed by Dunn’s multiple comparisons test. * p ≤ 0.05,** p ≤ 0.01.
Figure 5
Figure 5
Viral shedding after challenge infection with H3N2 TX98. (A) Viral RNA in nasal swabs as determined via RT-PCR. Data are presented as log10 viral RNA copies per 100 μL sample. (B) Area under the curve of the nasal viral loads in each pig during the five days post-challenge infection with H3N2 TX98. (C) Viral RNA in bronchoalveolar lavage fluid (BALF) collected on day 5 post-challenge infection. **** p ≤ 0.0001.
Figure 6
Figure 6
Lung pathology and presence of virus-infected cells in tissue samples. (A) Representative photos of lungs taken during necropsy. Black arrows indicate areas of the lungs with typical consolidation caused by IAV-S. The graph indicates the percentage of lung consolidation calculated based on the weighted proportions of each lobe to the total lung volume. (B) Representative images (10×) of lung sections stained with H&E and the composite microscopic lesion scores. (C) Representative images (5×) of lung sections stained with ISH to detect viral NP mRNA transcript and the composite ISH scores. (D) Representative images (5×) of tracheal sections stained with ISH to detect viral NP mRNA transcript and the composite ISH scores. Scale bar = 100 μm. * p ≤ 0.05, ** p ≤ 0.01, **** p ≤ 0.0001.

Similar articles

Cited by

References

    1. Vincent A.L., Lager K.M., Anderson T.K. A brief introduction to influenza A virus in swine. Methods Mol. Biol. 2014;1161:243–258. doi: 10.1007/978-1-4939-0758-8_20. - DOI - PubMed
    1. Anderson T.K., Macken C.A., Lewis N.S., Scheuermann R.H., Van Reeth K., Brown I.H., Swenson S.L., Simon G., Saito T., Berhane Y., et al. A Phylogeny-Based Global Nomenclature System and Automated Annotation Tool for H1 Hemagglutinin Genes from Swine Influenza A Viruses. mSphere. 2016;1:e00275-16. doi: 10.1128/mSphere.00275-16. - DOI - PMC - PubMed
    1. Anderson T.K., Chang J., Arendsee Z.W., Venkatesh D., Souza C.K., Kimble J.B., Lewis N.S., Davis C.T., Vincent A.L. Swine Influenza A Viruses and the Tangled Relationship with Humans. Cold Spring Harb. Perspect. Med. 2021;11:a038737. doi: 10.1101/cshperspect.a038737. - DOI - PMC - PubMed
    1. Sandbulte M.R., Spickler A.R., Zaabel P.K., Roth J.A. Optimal Use of Vaccines for Control of Influenza A Virus in Swine. Vaccines. 2015;3:22–73. doi: 10.3390/vaccines3010022. - DOI - PMC - PubMed
    1. Venkatesh D., Anderson T.K., Kimble J.B., Chang J., Lopes S., Souza C.K., Pekosz A., Shaw-Saliba K., Rothman R.E., Chen K.F., et al. Antigenic Characterization and Pandemic Risk Assessment of North American H1 Influenza A Viruses Circulating in Swine. Microbiol. Spectr. 2022;10:e0178122. doi: 10.1128/spectrum.01781-22. - DOI - PMC - PubMed

LinkOut - more resources