. 2023 Dec:64:101314.
doi: 10.1016/j.dcn.2023.101314. Epub 2023 Oct 14.

Structural and functional connectome relationships in early childhood

Affiliations

Structural and functional connectome relationships in early childhood

Yoonmi Hong et al. Dev Cogn Neurosci. 2023 Dec.

Abstract

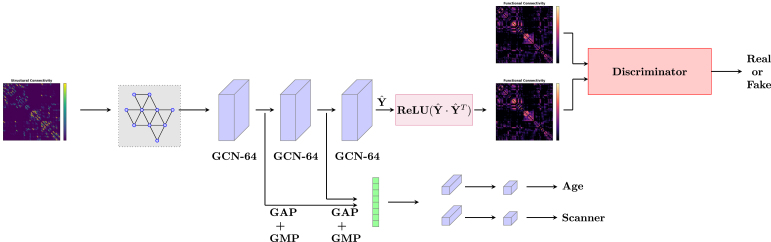
There is strong evidence that the functional connectome is highly related to the white matter connectome in older children and adults, though little is known about structure-function relationships in early childhood. We investigated the development of cortical structure-function coupling in children longitudinally scanned at 1, 2, 4, and 6 years of age (N = 360) and in a comparison sample of adults (N = 89). We also applied a novel graph convolutional neural network-based deep learning model with a new loss function to better capture inter-subject heterogeneity and predict an individual's functional connectivity from the corresponding structural connectivity. We found regional patterns of structure-function coupling in early childhood that were consistent with adult patterns. In addition, our deep learning model improved the prediction of individual functional connectivity from its structural counterpart compared to existing models.

Keywords: Functional connectome; Graph convolutional neural network; Structural connectome; Structure-function coupling.


Conflict of interest statement

Declaration of competing interest The authors declare that they have no known competing financial interests or personal relationships that could have appeared to influence the work reported in this paper.

Figures

Fig. 1
Fig. 1
Schematic overview Structural connectivity (SC) and functional connectivity (FC) matrices were generated from dMRI and rs-fMRI data, respectively. Relationships between structure and function were investigated by computing S–F coupling and participation coefficients from regional profile vectors of the connectivity matrices. Group-averaged regional coupling and participation coefficients were visualized, and their correlations were investigated. For individual-level analysis, each individual’s FC was predicted from its SC using our proposed deep learning prediction model.
Fig. 2
Fig. 2
Overview of the prediction model based on graph convolutional neural network. Our framework consists of a generator and a discriminator, where a generator predicts a target FC and a discriminator classifies real FC and generated FC. GCN-n denotes GCN layer with n output features. To ensure the symmetry and non-negativity of FC, the output of the last layer is multiplied by its transposed matrix, followed by ReLU activation. We concatenate the latent feature vectors from global average pooling (GAP) and global max pooling (GMP), and apply multi-layer perceptrons for age and scanner classification tasks.
Fig. 3
Fig. 3
Group-averaged structural connectivity (SC) and functional connectivity (FC) matrices at ages 1, 2, 4, and 6. Group-averaged SC matrices are highly stable across the ages, while FC matrices change across the ages, especially from age 2 to 4. Note that the scan paradigm was changed from sleep to movie-watching from age 2 to 4. Note that the display range of the colormap was set to be maximized for the visualization purposes.
Fig. 4
Fig. 4
Average regional structure-function coupling computed at ages 1, 2, 4, and 6 from EBDS and HCP dataset. Frontal lobes and medial parietal and occipital lobes showed relatively strong structure-function coupling, and lateral temporal and parietal regions showed relatively weaker coupling. Note that the scan paradigm was changed from sleep to movie-watching from age 2 to 4.
Fig. 5
Fig. 5
Developmental changes of regional structure-function coupling LS means from age 1 to 6 (N=30). Between age 1 and 6 years, most cortical regions experience a significant decrease in S–F coupling (n=40), while 19 regions had a significant increase, and 19 regions had no change.
Fig. 6
Fig. 6
Participation coefficients for structure (A) and function (B) at each age along with their correlations with S–F coupling. Regions with a high PC exhibit diverse inter-modular connectivity, having relatively low S–F coupling. On the other hand, regions with a lower PC (more localized or segregated connectivity) have relatively high S–F coupling. The significance of correlations was assessed by non-parametric permutation testing (p values are denoted as pspin) (Alexander-Bloch et al., 2018). Note that the scan paradigm was changed from sleep to movie-watching from age 2 to 4.
Fig. 7
Fig. 7
Representative individual prediction results and prediction correlations from each age. Our methods can predict FC which is close to the ground-truth FC with higher prediction correlation compared to Sarwar’s method.
Fig. 8
Fig. 8
Age classification (a) and scanner classification results (b). F1 scores for the age classification and the scanner classification are 0.75 and 0.94, respectively.
Fig. 9
Fig. 9
Ablation study: the proposed method shows superior performance compared to the results without correlation loss or without adversarial loss in terms of MAE and Pearson’s correlation. The results without Siamese loss or regularization show improved MAE and correlation; however, their inter-subject correlation error is greater than the proposed method. In summary, our proposed method yields prediction results with good inter-subject variability at the cost of a slight reduction of prediction accuracy. denotes 0.0001<p0.001 and denotes p0.0001.

References

    1. Alexander-Bloch A.F., Shou H., Liu S., Satterthwaite T.D., Glahn D.C., Shinohara R.T., Vandekar S.N., Raznahan A. On testing for spatial correspondence between maps of human brain structure and function. Neuroimage. 2018;178:540–551. - PMC - PubMed
    1. Avants B.B., Epstein C.L., Grossman M., Gee J.C. Symmetric diffeomorphic image registration with cross-correlation: evaluating automated labeling of elderly and neurodegenerative brain. Med. Image Anal. 2008;12(1):26–41. - PMC - PubMed
    1. Bagonis M., Cornea E., Girault J.B., Stephens R.L., Kim S., Prieto J.C., Styner M., Gilmore J.H. Early childhood development of node centrality in the white matter connectome and its relationship to IQ at 6 years. Biol. Psychiatry Cogn. Neurosci. Neuroimaging. 2022 - PMC - PubMed
    1. Ball G., Aljabar P., Zebari S., Tusor N., Arichi T., Merchant N., Robinson E.C., Ogundipe E., Rueckert D., Edwards A.D., et al. Rich-club organization of the newborn human brain. Proc. Natl. Acad. Sci. 2014;111(20):7456–7461. - PMC - PubMed
    1. Battaglia P.W., Hamrick J.B., Bapst V., Sanchez-Gonzalez A., Zambaldi V., Malinowski M., Tacchetti A., Raposo D., Santoro A., Faulkner R., et al. 2018. Relational inductive biases, deep learning, and graph networks. arXiv preprint arXiv:1806.01261.

Publication types

LinkOut - more resources