. 2023 Nov:97:104848.
doi: 10.1016/j.ebiom.2023.104848. Epub 2023 Oct 27.

Complementary structural and functional abnormalities to localise epileptogenic tissue

Affiliations

Complementary structural and functional abnormalities to localise epileptogenic tissue

Jonathan J Horsley et al. EBioMedicine. 2023 Nov.

Abstract

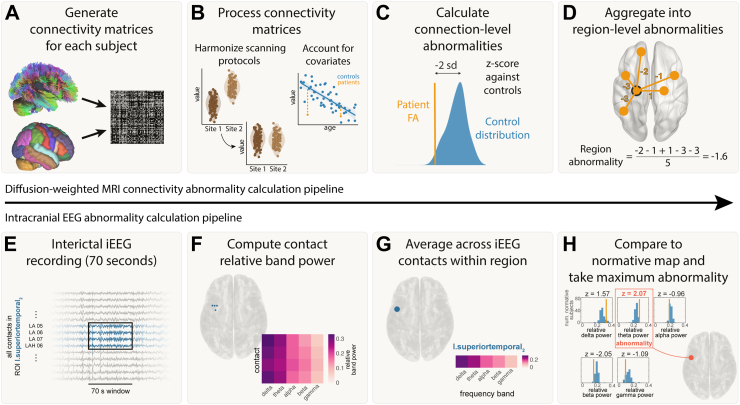
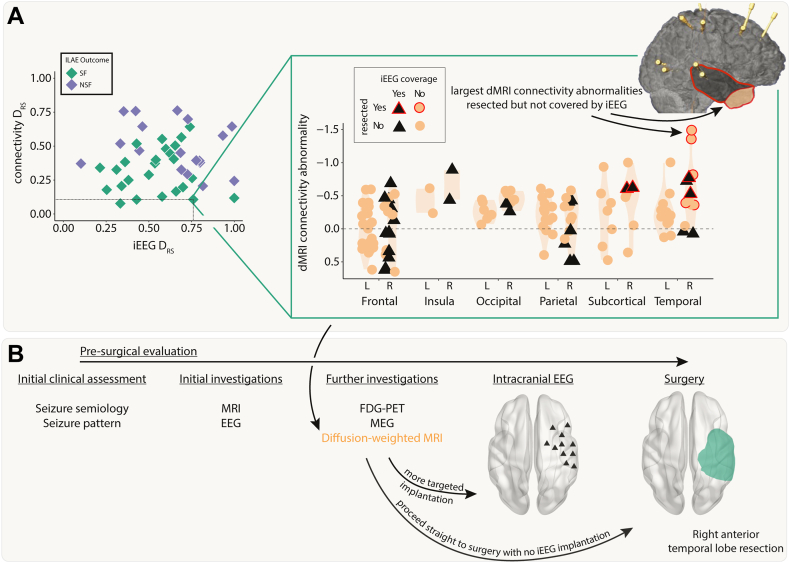
Background: When investigating suitability for epilepsy surgery, people with drug-refractory focal epilepsy may have intracranial EEG (iEEG) electrodes implanted to localise seizure onset. Diffusion-weighted magnetic resonance imaging (dMRI) may be acquired to identify key white matter tracts for surgical avoidance. Here, we investigate whether structural connectivity abnormalities, inferred from dMRI, may be used in conjunction with functional iEEG abnormalities to aid localisation of the epileptogenic zone (EZ), improving surgical outcomes in epilepsy.

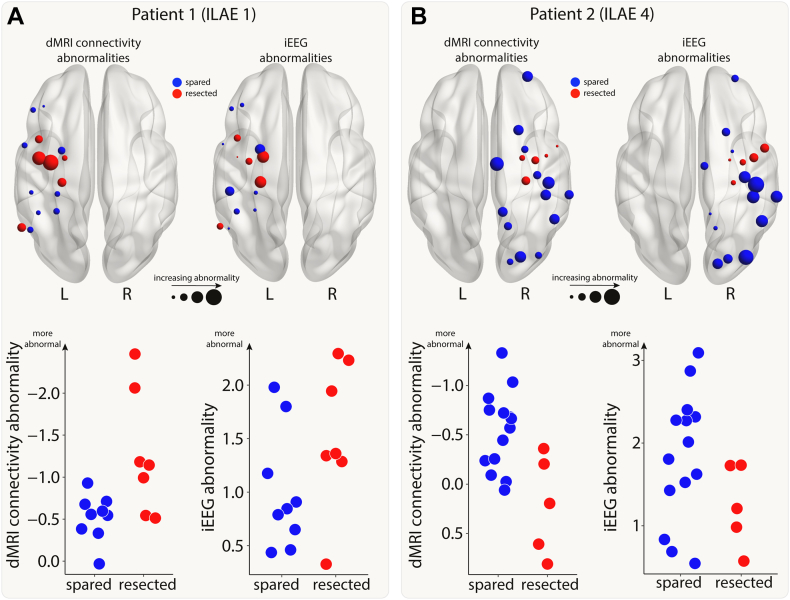
Methods: We retrospectively investigated data from 43 patients (42% female) with epilepsy who had surgery following iEEG. Twenty-five patients (58%) were free from disabling seizures (ILAE 1 or 2) at one year. Interictal iEEG functional, and dMRI structural connectivity abnormalities were quantified by comparison to a normative map and healthy controls. We explored whether the resection of maximal abnormalities related to improved surgical outcomes, in both modalities individually and concurrently. Additionally, we suggest how connectivity abnormalities may inform the placement of iEEG electrodes pre-surgically using a patient case study.

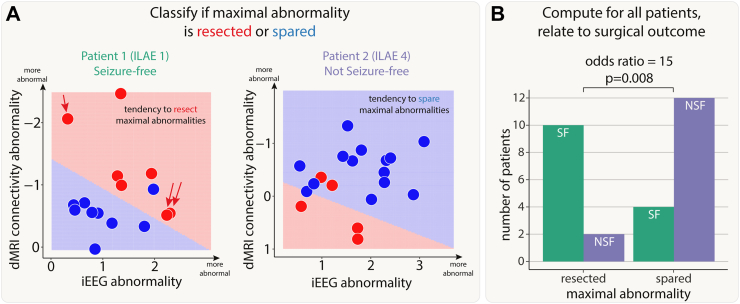
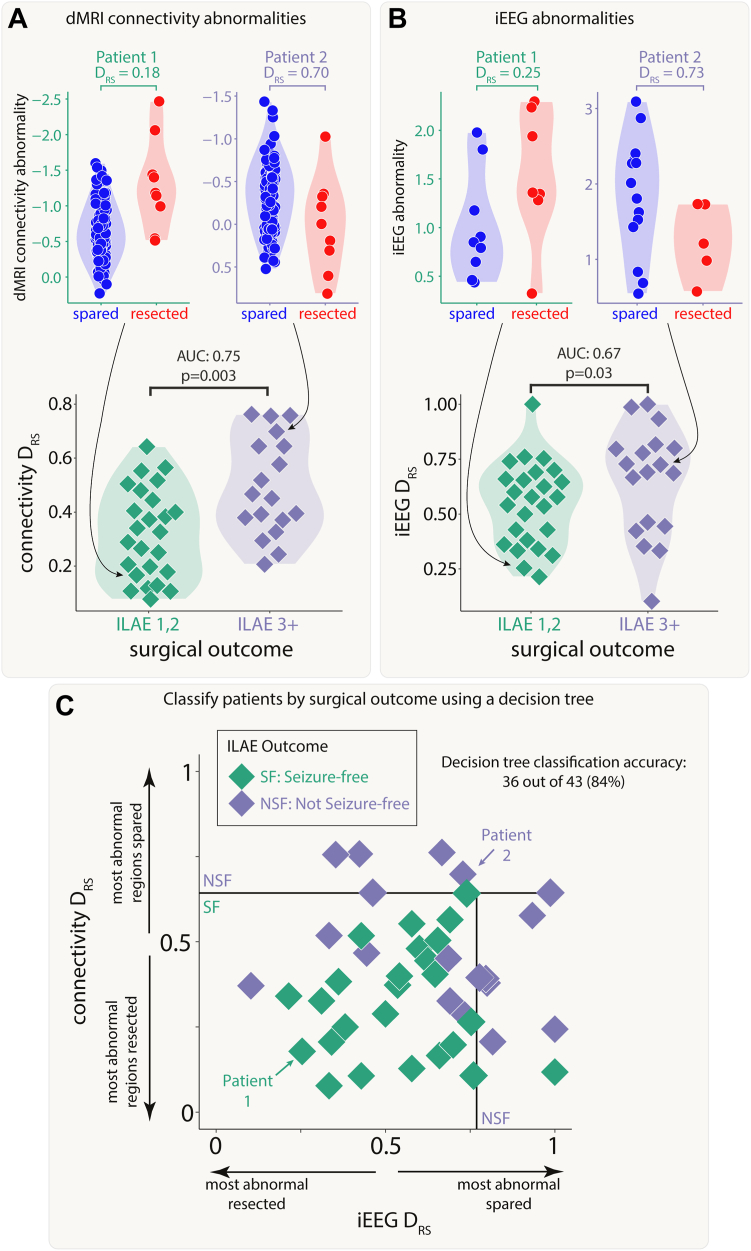
Findings: Seizure freedom was 15 times more likely in patients with resection of maximal connectivity and iEEG abnormalities (p = 0.008). Both modalities separately distinguished patient surgical outcome groups and when used simultaneously, a decision tree correctly separated 36 of 43 (84%) patients.

Interpretation: Our results suggest that both connectivity and iEEG abnormalities may localise epileptogenic tissue, and that these two modalities may provide complementary information in pre-surgical evaluations.

Funding: This research was funded by UKRI, CDT in Cloud Computing for Big Data, NIH, MRC, Wellcome Trust and Epilepsy Research UK.

Keywords: Diffusion-weighted MRI; Epilepsy; Intracranial EEG; Machine learning; Multi-modal analysis; Surgical prediction.


Conflict of interest statement

Declaration of interests J.H. received support for attending meetings and/or travel from the Centre for Doctoral Training in Cloud Computing for Big Data (EP/L015358/1). R.T. received consulting fees from Angelini, Jazz. RT received payment or honoraria for lectures, presentations, speakers bureaus, manuscript writing or educational events from Angelini, Bial, Biocodex, Eisai, Jazz, LivaNova, Neuraxpharm, Sanofi, Takeda, UCB Pharma and Zogenix. RT Participated on a Data Safety Monitoring Board or Advisory Board for Angelini, LivaNova, Sanofi, UCB. RT has a Leadership or fiduciary role in other board, society, committee or advocacy group, paid or unpaid as Treasurer British Branch ILAE; Trustee of Epilepsy Research UK. MW received royalties or licenses from Vitaflo. MW received consulting fees from Ambrosetti and EpilepsyGtx. MW received payment or honoraria for lectures, presentations, speakers bureaus, manuscript writing or educational events from Angelini and UCB Pharma. MW has the following patents (planned, issued or pending) WO2018229254A1 EP3116508A1 US10301263B2 WO2023152318A1 CA3058047A1 EP2642990B1 CA3064329A1. MW has a leadership or fiduciary role in other board, society, committee or advocacy group, paid or unpaid at Epilepsy Research UK, and the International League against Epilepsy. PT received funding for a PhD studentship from Epilepsy Research UK.

Figures

Fig. 1
Fig. 1
Abnormality calculation pipeline. Connectivity pipeline is shown in panels A–D and iEEG abnormality pipeline is shown in panels E–H. A) Connectivity matrices were generated for each patient using average FA between each pair of regions for the Lausanne-60 brain atlas. B) Connectivity matrices were harmonized across the two sites using ComBat. Known biological effects, age and sex, were regressed out. C) Each connection in each patient was z-scored against healthy controls to get connection abnormalities. D) Connection abnormalities involving each region were averaged (mean) to obtain region-level connectivity abnormalities. E) For each patient, 70s of interictal iEEG recording were analysed. F) The relative band power was calculated for five frequency bands for each electrode contact. G) The relative band power was computed for each region by averaging contacts assigned to that region. H) iEEG abnormalities were calculated for a region by z-scoring the relative band power in each frequency band to a normative map and taking the maximum abnormality.
Fig. 2
Fig. 2
Connectivity and iEEG abnormalities in two example patients. The brain plots show connectivity (left) and iEEG abnormalities (right) for the regions implanted with iEEG electrodes in two example patients (Panel A: good outcome; Panel B: poor outcome). Regions are coloured depending on whether they were resected (red) or spared (blue) in surgery. Increasing point size relates to increasing abnormality. The same information is shown on plots with the x-axis indicating whether a region was resected or spared and the y-axis indicating abnormality size.
Fig. 3
Fig. 3
Patients with resection of maximal abnormalities were more likely to be seizure-free. A) The iEEG and connectivity abnormalities from two example patients. Each point is either a resected (red) or spared (blue) region. Abnormalities were not correlated in all patients. For example, Patient 1 had some high-connectivity and low-iEEG abnormalities (single red arrow), and some low-connectivity and high-iEEG abnormalities (double red arrows). Within each patient, a SVM separated the regions into resected and spared zones based on the size of abnormalities. If the top right of the plot was in the resected (red) zone, then that patient had maximal abnormalities resected. The SVM successfully separated the abnormalities into two zones in 28 out of 43 patients. B) For these patients, surgical outcome was related to resection of maximal abnormalities.
Fig. 4
Fig. 4
Connectivity and iEEG abnormality distribution in resected versus spared tissue explains post-surgical seizure freedom. Both A) connectivity DRS and B) iEEG DRS were used to separate patients based on surgical outcome. The top plots in each panel show regional abnormalities, indicated with circular points, in example patients. The bottom plots in each panel show patient DRS values, indicated with diamond points. C) A decision tree was fit to both DRS values simultaneously to classify patient outcome, achieving an accuracy of 84%.
Fig. 5
Fig. 5
Incorporating dMRI into pre-surgical evaluations–a case study. A) The connectivity abnormalities are shown for an example patient (iEEG DRS = 0.76, connectivity DRS = 0.11). Regions with a black triangle indicate that the region was sampled by iEEG implantation and a red outline indicates that region was resected in surgery. Despite a relatively widespread implantation, the regions with the largest connectivity abnormalities were not implanted, but were resected. This patient was seizure-free following surgery. B) Incorporating connectivity abnormalities from diffusion-weighted imaging into the pre-surgical evaluation may allow for more targeted iEEG implantation or avoiding the need for implantation altogether.

Update of

References

    1. Wiebe S. Brain surgery for epilepsy. Lancet. 2003;362:s48–s49. doi: 10.1016/S0140-6736(03)15075-1. - DOI - PubMed
    1. Rosenow F., Luders H. Presurgical evaluation of epilepsy. Brain. 2001;124:1683–1700. doi: 10.1093/brain/124.9.1683. - DOI - PubMed
    1. Bell M.L., Rao S., So E.L., et al. Epilepsy surgery outcomes in temporal lobe epilepsy with a normal MRI. Epilepsia. 2009;50:2053–2060. doi: 10.1111/j.1528-1167.2009.02079.x. - DOI - PMC - PubMed
    1. Duncan J.S., Winston G.P., Koepp M.J., Ourselin S. Brain imaging in the assessment for epilepsy surgery. Lancet Neurol. 2016;15:420–433. doi: 10.1016/S1474-4422(15)00383-X. - DOI - PMC - PubMed
    1. Whelan C.D., Altmann A., Botía J.A., et al. Structural brain abnormalities in the common epilepsies assessed in a worldwide ENIGMA study. Brain. 2018;141:391–408. doi: 10.1093/brain/awx341. - DOI - PMC - PubMed