. 2024 Jan 3;112(1):41-55.e3.
doi: 10.1016/j.neuron.2023.09.032. Epub 2023 Oct 28.

Mapping of neuronal and glial primary cilia contactome and connectome in the human cerebral cortex

Affiliations

Mapping of neuronal and glial primary cilia contactome and connectome in the human cerebral cortex

Jun Yao Wu et al. Neuron. .

Abstract

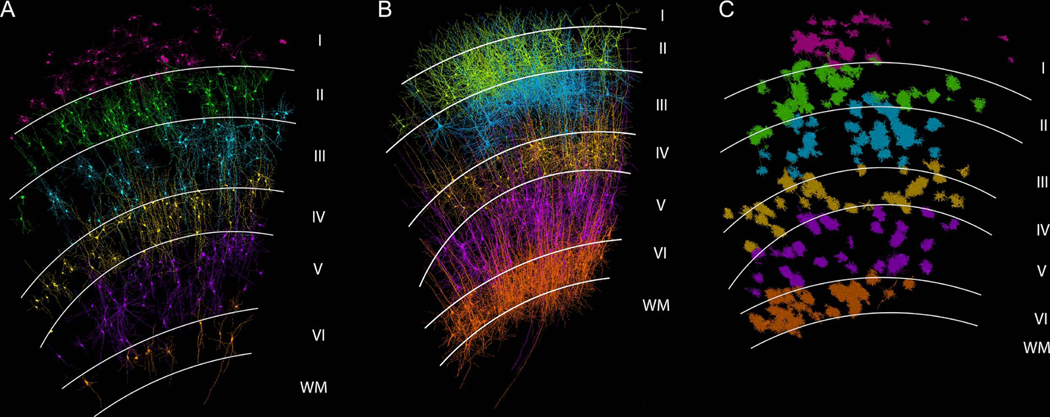
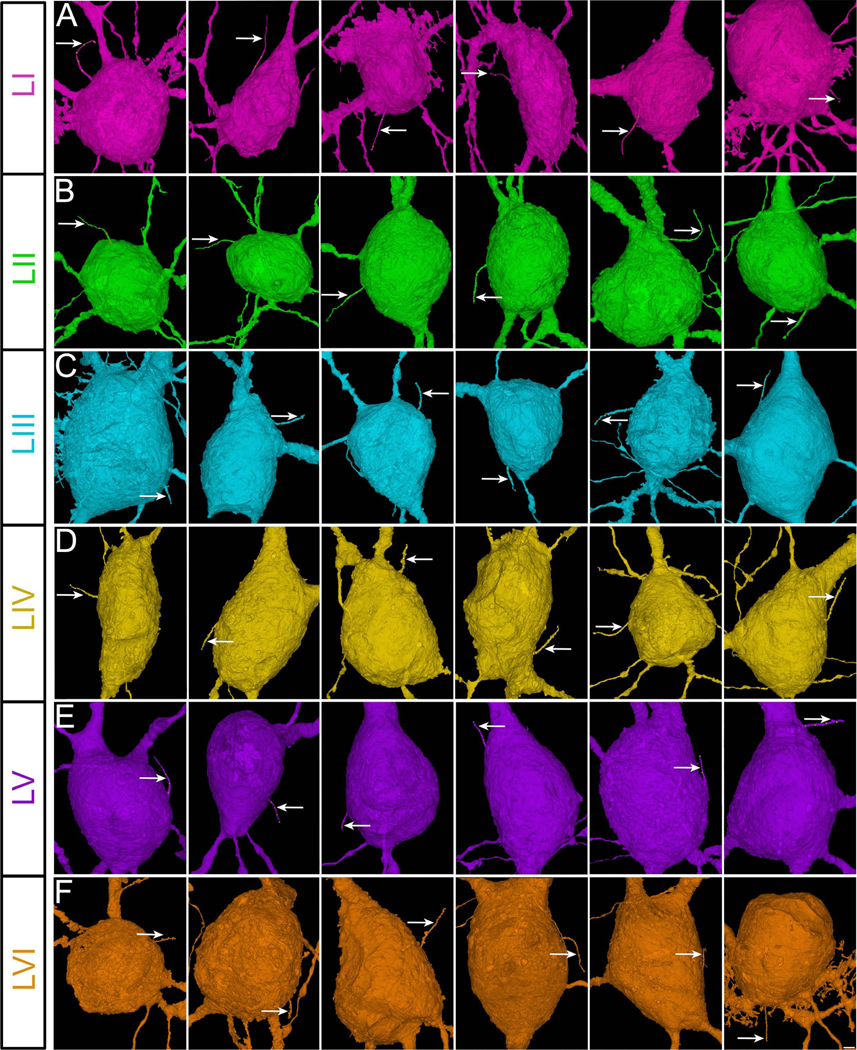
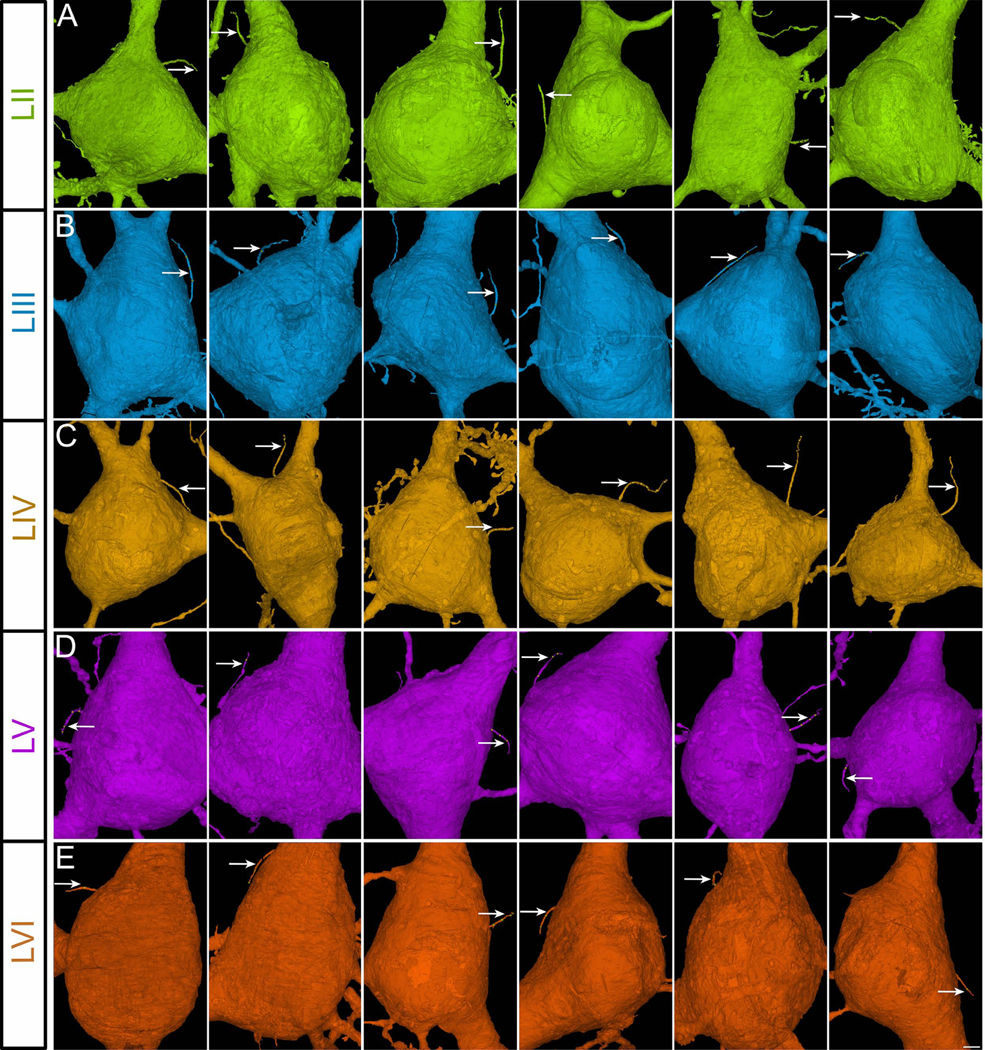
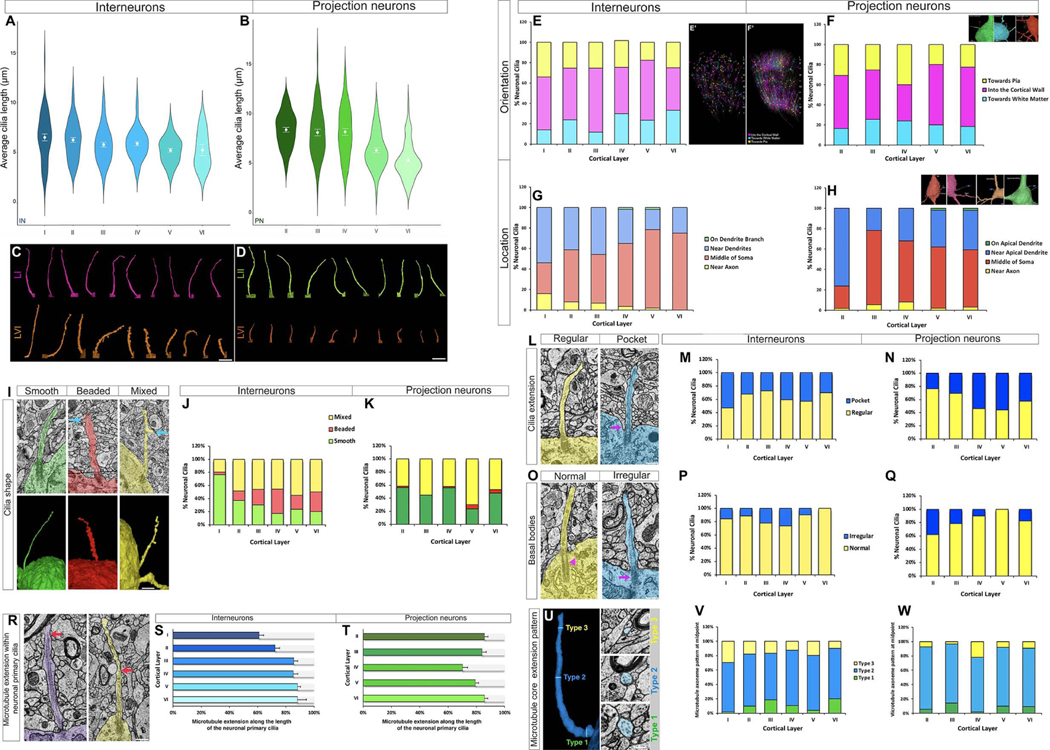
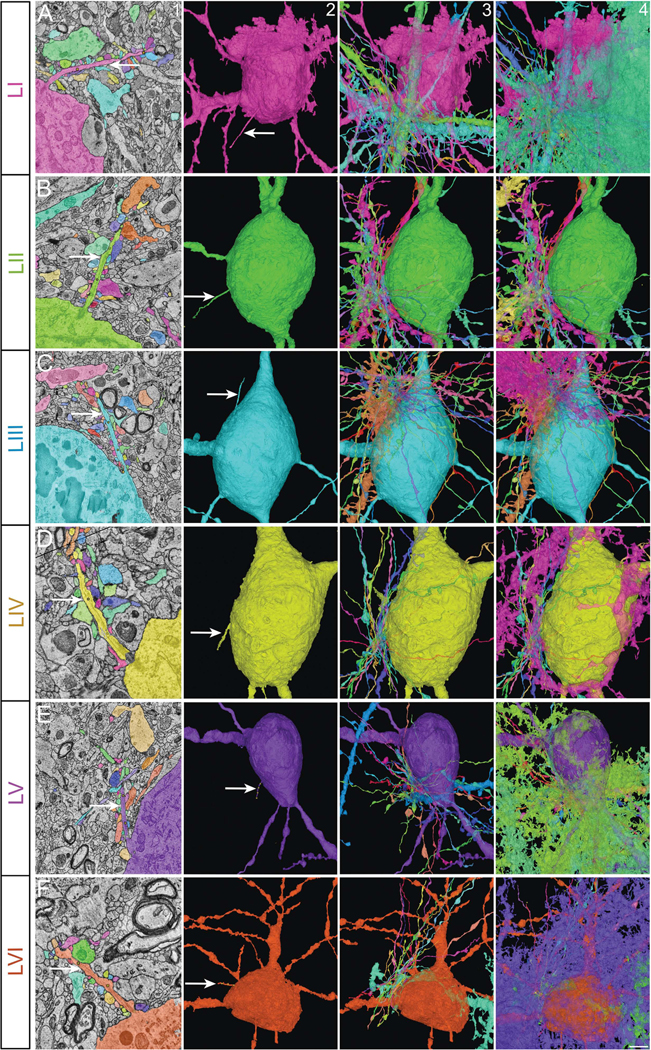
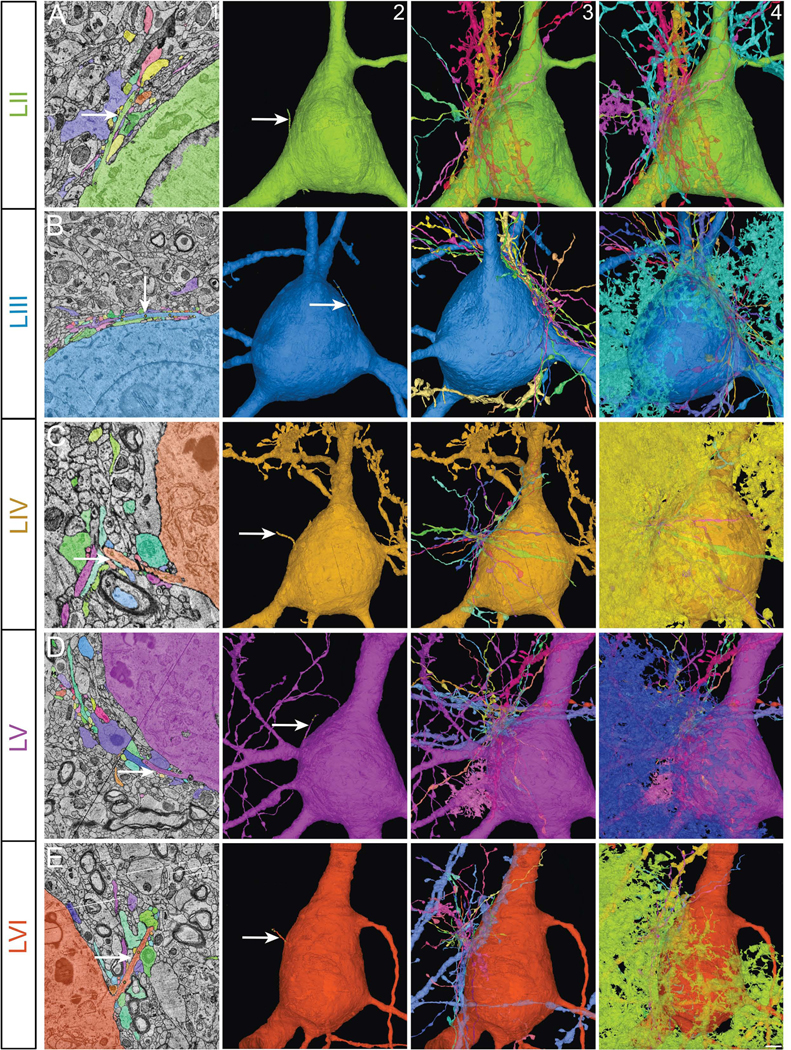
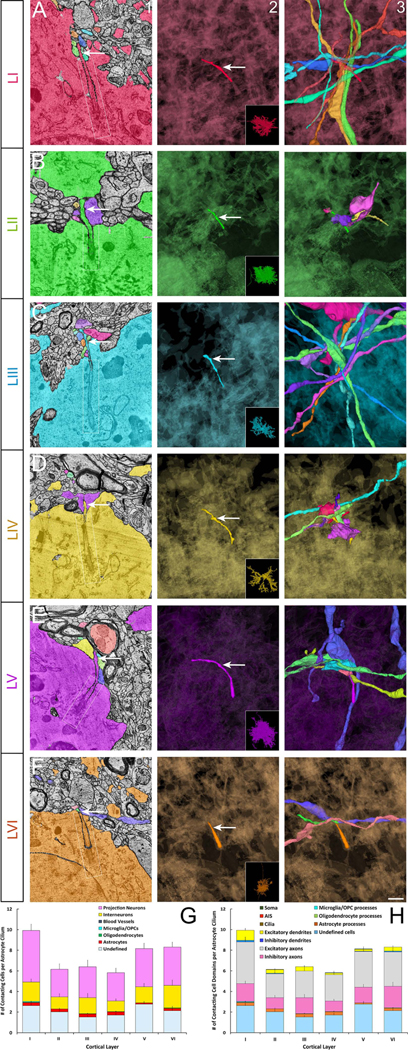
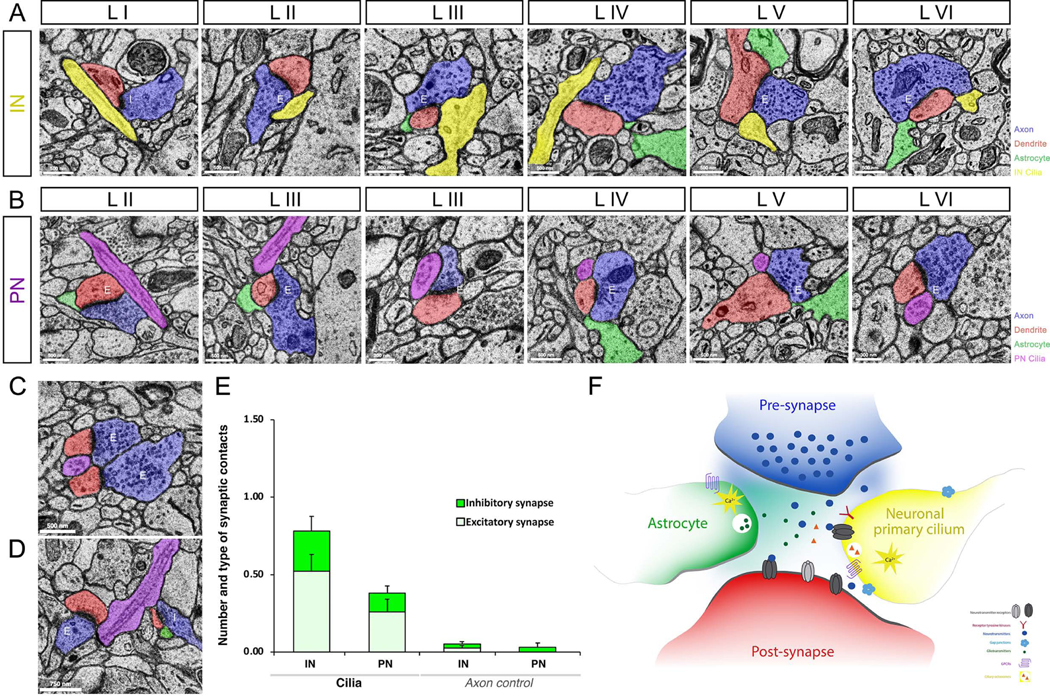
Primary cilia act as antenna receivers of environmental signals and enable effective neuronal or glial responses. Disruption of their function is associated with circuit disorders. To understand the signals these cilia receive, we comprehensively mapped cilia's contacts within the human cortical connectome using serial-section EM reconstruction of a 1 mm3 cortical volume, spanning the entire cortical thickness. We mapped the "contactome" of cilia emerging from neurons and astrocytes in every cortical layer. Depending on the layer and cell type, cilia make distinct patterns of contact. Primary cilia display cell-type- and layer-specific variations in size, shape, and microtubule axoneme core, which may affect their signaling competencies. Neuronal cilia are intrinsic components of a subset of cortical synapses and thus a part of the connectome. This diversity in the structure, contactome, and connectome of primary cilia endows each neuron or glial cell with a unique barcode of access to the surrounding neural circuitry.

Keywords: ciliopathies; connectome; cortical circuit; human brain disorders; primary cilia; synapse.


Conflict of interest statement

Declaration of interests The authors declare no competing interests.

Figures

Figure 1.
Figure 1.. Examination of primary cilia in projection neurons, interneurons, and astrocytes of every cerebral cortical layer.
Primary cilium of interneurons (A), projection neurons (B), and astrocytes (C) from all different layers of the cerebral cortex were analyzed. Neurons and glia examined are shown. I-VI, different cortical layers; WM, white matter.
Figure 2.
Figure 2.. Cortical interneuronal primary cilia.
Sample images of the primary cilium (arrow) of human cortical interneurons from all six cortical layers (A-F). Cells are oriented so that axons are pointing downwards. Scale bar: 1.6μm. I-VI, cortical layers.
Figure 3.
Figure 3.. Cortical projection neuronal primary cilia.
Sample images of the primary cilium (arrow) of human cortical projection neurons from cortical layers II-VI (A-E). There are no projection neurons in layer I. Cells are oriented so that apical dendrites are pointing upwards and axons are pointing downwards. Scale bar: 1.85μm. II-VI, cortical layers.
Figure 4.
Figure 4.. Diversity in the structure and organization of neuronal primary cilia
(A-D) Diversity in the length of neuronal primary cilia. Quantification of the average length of interneuronal (A) and projection neuronal (B) primary cilia. (C) Sample images of interneuronal primary cilia from layers I and VI. (D) Sample images of projection neuronal primary cilia from layers II and VI. Data shown are mean ± SEM. One-way ANOVA: IN-F5, 286[cilia length] = 3.33, p = 0.0061; PN- F4, 303[cilia length] = 29.85, p<1−16. Two-way ANOVA: F1,540[cilia lengthIN versus PN] = 86.24, p<1E−16. Scale bar: 2μm (C-D). IN, interneuron; PN, projection neuron; I-VI, cortical layers. (E-F) Quantification of neuronal primary cilia orientation. Orientation of neuronal primary cilia towards the pial surface, white matter, or into the cortical wall was quantified (E-F). Sample images of cilia orientation are shown in inset (top left, F). Panels E’ and F’ show the layer location of interneurons (E’) and projection neurons (F’) with different cilia orientations. Cell soma of these neurons are highlighted in colors corresponding to different cilia orientation. One-way ANOVA (orientation): IN- F2,15= 7.26, p= 0.0062; PN- F2,12= 5.72, p= 0.018. (G-H) The position of neuronal primary cilia relative to the position of the dendrites, axon, or cell soma was examined in interneurons and projection neurons. For projection neurons, the apical dendrite was used as the landmark, whereas any dendrite was used for interneurons. Sample images of cilia (arrow) position are shown in inset (top left, H). I-VI, cortical layers. One-way ANOVA (position): IN- F3,20= 14.67, p= 0.0000278; PN- F3,16= 12.66, p= 0.00017. (I-K) Diversity of cortical neuronal primary cilia shape. (I) Sample cilia images (EM and 3D reconstruction) of each category of shape (smooth, beaded, mixed). Arrows point to ciliary membrane outpocketings. (J-K) Quantification of neuronal cilia shape. Shape of interneuronal cilia and projection neuronal cilia from different layers were quantified. IN, interneuron; PN, projection neuron; I-VI, cortical layers. Two-way ANOVA: F2,27[cilia type] = 20.22, p = 4.3E−06. Post-hoc p[beaded cilia, IN versus PN]= 0.0064. Scale bar: 1.5μm. (L-Q) Organization of neuronal primary cilia. Quantification of cilia extending from a ciliary pocket at the base (L-N) and basal body organization (normal or irregular) of cilia (O-Q). Sample cilia images of each category are shown in panels L (normal or ciliary pocket [arrow]) and O (normal [arrowhead] or irregular-shaped basal body [arrow]). Interneuronal cilia and projection neuronal cilia from different layers were quantified (M-N, P-Q). IN, interneuron; PN, projection neuron; I-VI, cortical layers. One-way ANOVA (cilia pocket organization): IN- F1,5 = 16.68, p= 0.002; PN- F1,4 = 25.52, p= 0.00098. One-way ANOVA (basal body organization): IN- F1,5 = 19.28, p = 0.0014; PN- F1,4= 29.04, p = 0.00065. Scale bar: 1μm (L, O). (R-W) Changing dynamics of axoneme MT core of neuronal cilia. Sample images of a cilium with MT filaments extending through the majority of its length (arrow, R[left panel]) and a cilium with MT filaments extending only midway through its length (arrow, R[right panel]). Quantification of the extension of MT filaments within interneuronal (S) or projection neuronal (T) cilia from different layers. (U) Sample images of cross sections from the base, middle, and tip of a neuronal cilium. Cross sections containing 9–8, 7–4, and 3 or fewer MT doublet filaments are classified as type 1, 2, and 3, respectively. Quantification of the MT type at the midpoint of interneuronal (V) or projection neuronal (W) cilia from different layers. IN, interneuron; PN, projection neuron; I-VI, cortical layers. Data shown are mean ± SEM. Two-way ANOVA: F2,27[MT organization-midpoint] =254.9, p<1E−16, post-hoc p[IN versus PN]= 0.03. Scale bar: 1.4μm (R); 0.7μm (U).
Figure 5.
Figure 5.. Cortical interneuronal primary cilia contactome.
Primary cilia of cortical interneurons from all six cortical layers (arrow, columns 1 and 2; A-F) and all the axons and dendrites of other neurons (column 3) as well as the non-neural cells contacting them (column 4). Column 1 shows electron micrographs of the relevant cilium (arrow) and its contacting cells. I-VI, cortical layers. Scale bar: 2μm (column 1); 5μm (columns 2–4).
Figure 6.
Figure 6.. Cortical projection neuronal primary cilia contactome.
Primary cilia of cortical projection neurons from layers II-VI (arrow, columns 1 and 2; A-E) and all the axons and dendrites of other neurons (column 3) as well as the non-neural cells contacting them (column 4). Column 1 shows electron micrographs of the relevant cilium (arrow) and its contacting cells. II-VI, cortical layers. Scale bar: 2μm (column 1); 5μm (columns 2–4).
Figure 7.
Figure 7.. Cortical astrocyte primary cilia contactome.
Primary cilia (arrow) of astrocytes from layers I-VI (arrow, columns 1 and 2; A-F) and all the axons and dendrites of other neurons as well as the non-neural cell processes contacting them (column 3). Column 1 shows electron micrographs of the relevant cilium (arrow) and its contacting cells. Ciliary pockets are outlined in column 1 (white box). In columns 2 and 3 astrocyte cell body is shown in a translucent background so as not to obstruct the cilium. Insets in column 2 show the whole astrocyte. (G-H) Quantification of astrocyte primary cilia contactome. Cell types (G) and different cell domains (H) contacting the primary cilium of different cortical layer astrocytes were quantified. Data shown are mean ± SEM. Two-way ANOVA (cell types): F6, 30= 85.93, p= 1.1E−15. Two-way ANOVA (cell domains): F10, 50= 102, p=1E−15. I-VI, cortical layers. Scale bar: 0.45μm (column1); 0.8μm (columns 2–3).
Figure 8.
Figure 8.. Neuronal primary cilia as an intrinsic component of synaptic structure.
Neuronal primary cilia tips are located right next to synapses. Primary cilia highlighted in yellow and purple indicate primary cilia from inhibitory (A) and excitatory neurons (B), respectively. Astrocytes, axons, and dendrites are colored in green, blue, and red, respectively. Cortical layers (I-VI) and synapse type (excitatory [E] and inhibitory [I]) are indicated in each panel. IN, interneuron; PN, projection neuron. (C) Electron micrograph of two synapses with a contacting projection neuronal primary cilium in the middle. (D) Electron micrograph of two synapses (excitatory [E] and inhibitory [I]) contacted by a projection neuronal primary cilium. (E) Quantification of synaptic association of neuronal cilia. For each cilium, the number of ciliary contacts with bonafide chemical synapses was quantified. Synapse type (excitatory [E] and inhibitory [I]) was also noted. Similar quantifications were made for adjacent control axonal segments of the same length and phenotype as the respective cilium. IN, interneuron; PN, projection neuron. Data shown are mean±SEM. INcilia vs INaxon control, P<0.05 (t- test). PNcilia vs PNaxon control, P<0.05 (t-test). (F) Using the cilia localized signaling machinery, synaptic primary cilium may sense and respond to synaptic activity and environment. Unlike the previously known tripartite synapse (axon, dendrite, astrocyte), the integration of neuronal primary cilium leads to the formation of a tetrapartite (pre, post, astrocyte, cilium) synapse. Neuroglancer links to images in A-D are as follows- A: LI, LII, LIII, LIV, LV, LVI; B: LII, LIII, LIII, LIV, LV, LVI; C, D.

References

    1. Alvarez Retuerto AI, Cantor RM, Gleeson JG, et al. (2008). Association of common variants in the Joubert syndrome gene (AHI1) with autism. Hum Mol Genet 17, 3887–3896. doi:10.1093/hmg/ddn291 - DOI - PMC - PubMed
    1. Arellano JI, Guadiana SM, Breunig JJ, Rakic P, and Sarkisian MR (2012). Development and distribution of neuronal cilia in mouse neocortex. J Comp Neurol 520, 848–873. doi:10.1002/cne.22793 - DOI - PMC - PubMed
    1. Guemez-Gamboa A, Coufal NG, and Gleeson JG (2014). Primary Cilia in the Developing and Mature Brain. Neuron 82, 511–521. - PMC - PubMed
    1. Guo J, Higginbotham H, Li J, et al. (2015). Developmental disruptions underlying brain abnormalities in ciliopathies. Nat Commun 6, 7857. doi:10.1038/ncomms8857 - DOI - PMC - PubMed
    1. Guo J, Otis JM, Higginbotham H, Monckton C, Cheng J, Asokan A, Mykytyn K, Caspary T, Stuber GD, & Anton ES (2017). Primary Cilia Signaling Shapes the Development of Interneuronal Connectivity. Developmental cell, 42(3), 286–300.e4. 10.1016/j.devcel.2017.07.010 - DOI - PMC - PubMed

LinkOut - more resources