. 2023 Oct 28;14(1):6872.
doi: 10.1038/s41467-023-42215-4.

A tuft cell - ILC2 signaling circuit provides therapeutic targets to inhibit gastric metaplasia and tumor development

Affiliations

A tuft cell - ILC2 signaling circuit provides therapeutic targets to inhibit gastric metaplasia and tumor development

Ryan N O'Keefe et al. Nat Commun. .

Abstract

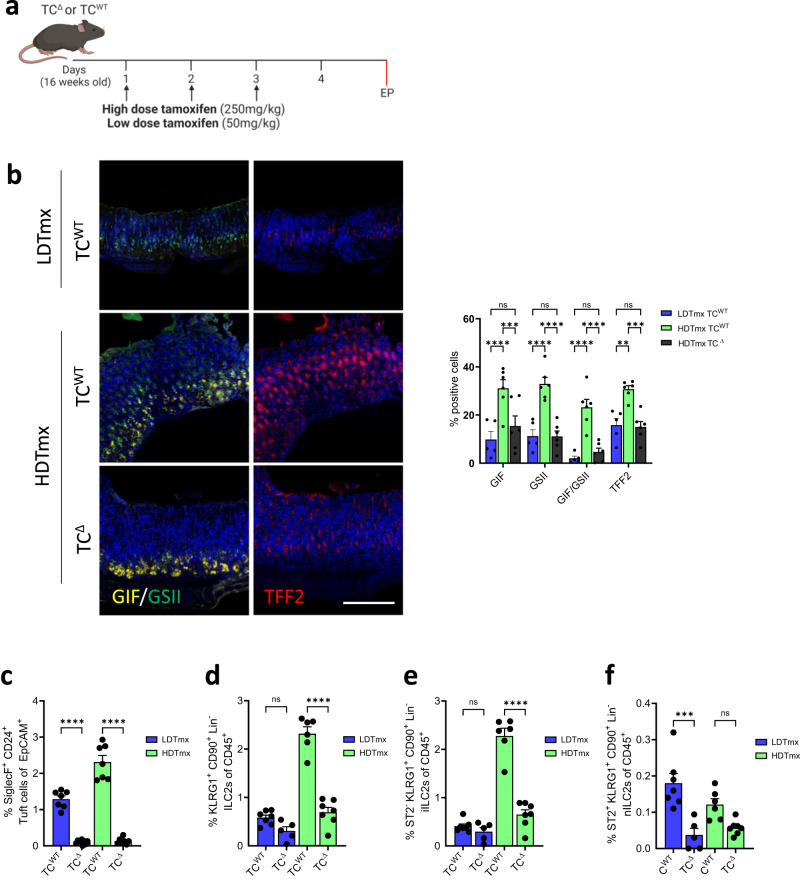
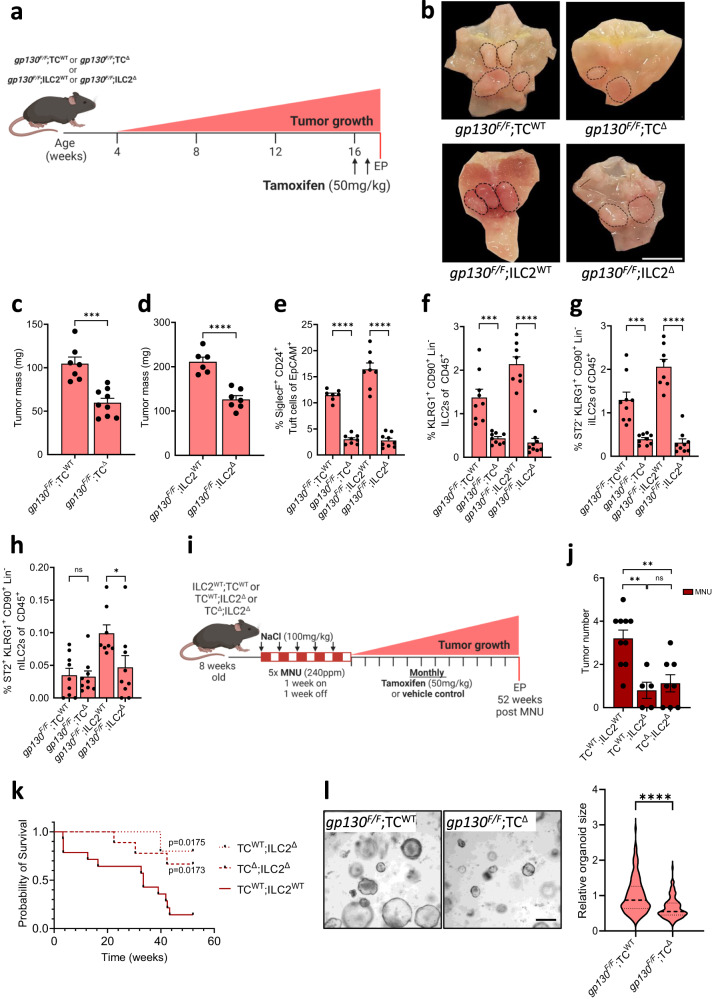
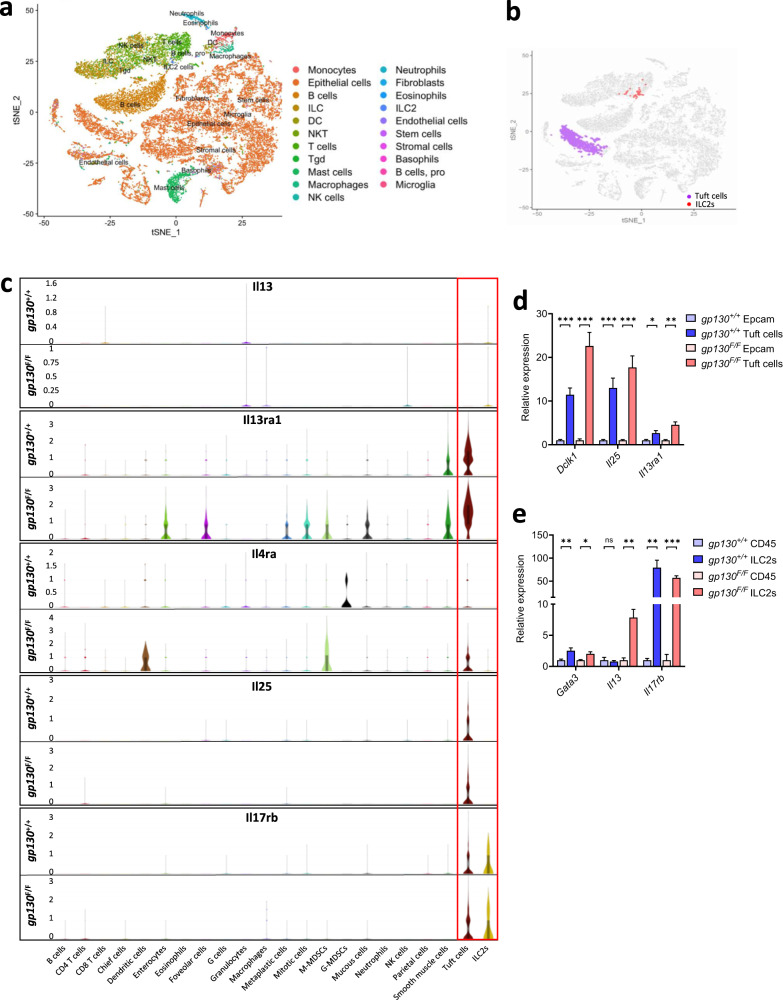
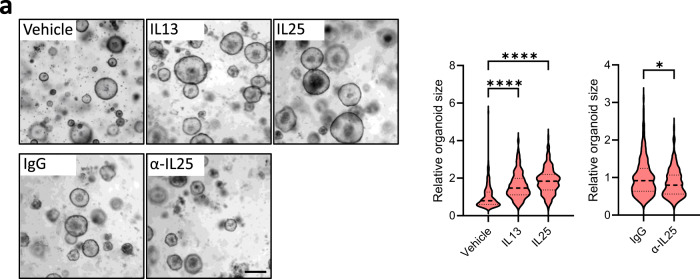
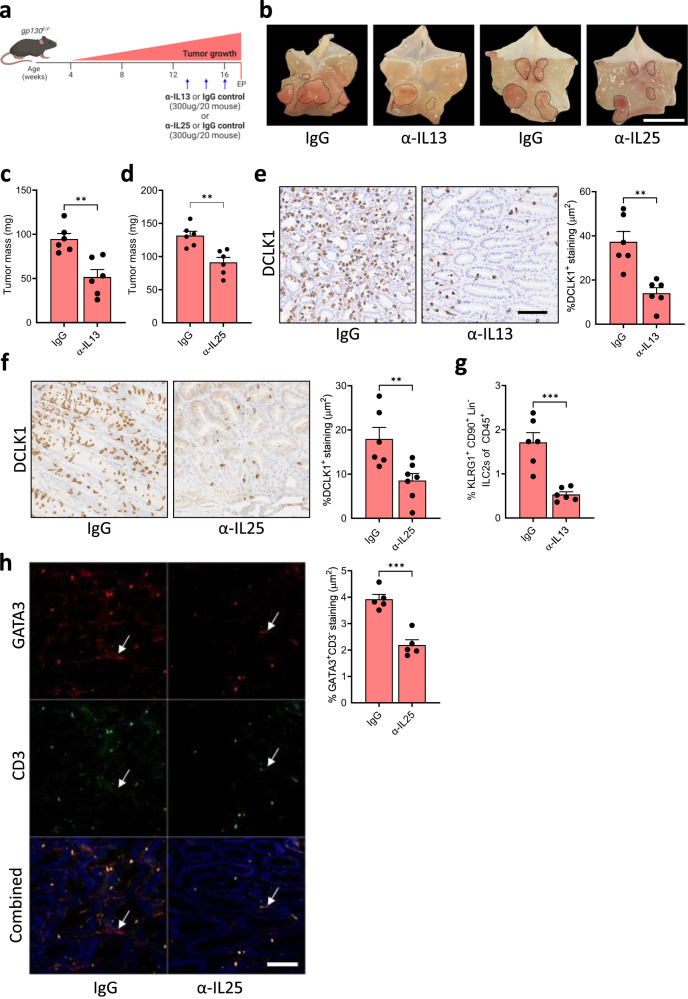
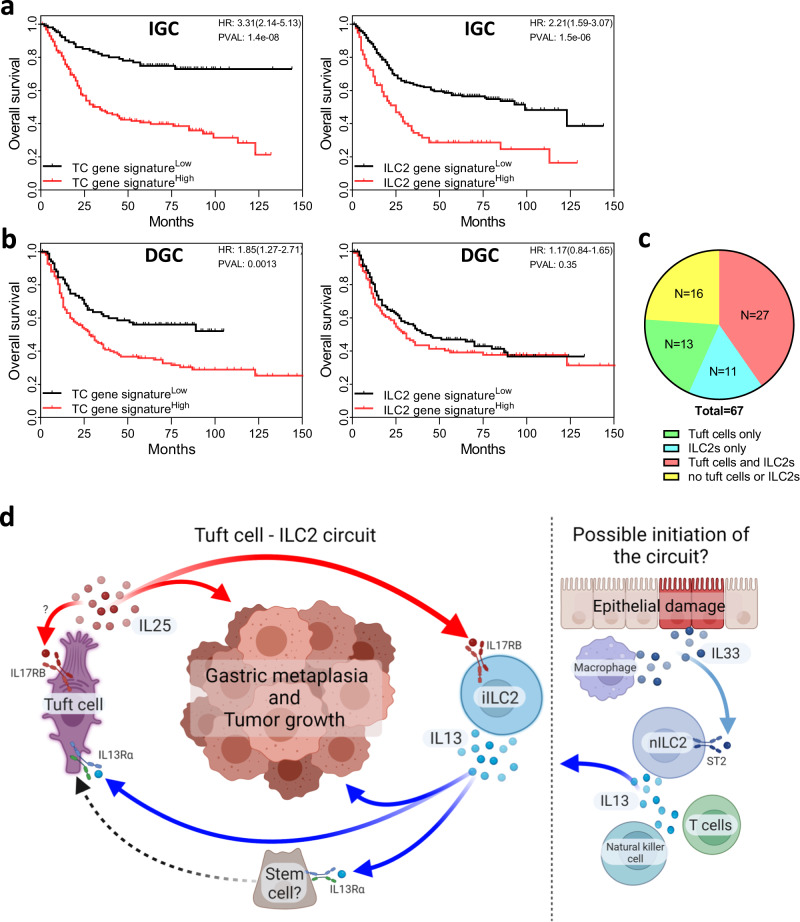
Although gastric cancer is a leading cause of cancer-related deaths, systemic treatment strategies remain scarce. Here, we report the pro-tumorigenic properties of the crosstalk between intestinal tuft cells and type 2 innate lymphoid cells (ILC2) that is evolutionarily optimized for epithelial remodeling in response to helminth infection. We demonstrate that tuft cell-derived interleukin 25 (IL25) drives ILC2 activation, inducing the release of IL13 and promoting epithelial tuft cell hyperplasia. While the resulting tuft cell - ILC2 feed-forward circuit promotes gastric metaplasia and tumor formation, genetic depletion of tuft cells or ILC2s, or therapeutic targeting of IL13 or IL25 alleviates these pathologies in mice. In gastric cancer patients, tuft cell and ILC2 gene signatures predict worsening survival in intestinal-type gastric cancer where ~40% of the corresponding cancers show enriched co-existence of tuft cells and ILC2s. Our findings suggest a role for ILC2 and tuft cells, along with their associated cytokine IL13 and IL25 as gatekeepers and enablers of metaplastic transformation and gastric tumorigenesis, thereby providing an opportunity to therapeutically inhibit early-stage gastric cancer through repurposing antibody-mediated therapies.


Conflict of interest statement

The authors declare no competing interests.

Figures

Fig. 1
Fig. 1. Ablation of tuft cells results in reduced ILC2s in both WT and HDTmx treated mice.
a Schematic for experimental SPEM induction and tuft cell ablation. 16-week-old BAC(Dclk1::CreERT2); Rosa26DTA/+ (TCΔ) or CreERT2-negative Rosa26DTA (TCWT) mice were treated with either HDTmx (250 mg/kg) once daily for 3 consecutive days to induce gastric spasmolytic polypeptide-expressing metaplasia (SPEM) and tuft cell ablation (in TCΔ mice), or LDTmx (50 mg/kg) once daily for 3 consecutive days to induce tuft cell ablation (in BAC(Dclk1::CreERT2);Rosa26DTA/+ mice). EP = endpoint. Created with BioRender.com. b Representative Immunofluorescence staining and quantification of stomachs from TCWT and TCΔ mice following treatments as described in Fig. 1a and enumerated for Gastric intrinsic factor (GIF)/GSII-lectin positive and TFF2-positive SPEM cells. N = 5, 6 and 6 respectively. Scale bar = 200μm. (c) Flow-cytometry quantification of SiglecF+CD24+EpCAM+ tuft cells from stomachs of TCWT and TCΔ mice following treatment with LDTmx or HDTmx. N = 7, 9, 7 and 7 respectively. d Flow-cytometry quantification of KLRG1+CD90.2+Lineage-CD45+ ILC2s in stomachs of TCWT and TCΔ mice following treatment with LDTmx or HDTmx. N = 7, 5, 6 and 7 respectively. e Flow-cytometry quantification of ST2-KLRG1+CD90.2+Lineage-CD45+ ILC2s in stomachs of TCWT and TCΔ mice following treatment with LDTmx or HDTmx. N = 7, 5, 6 and 7 respectively. f Flow-cytometry quantification of ST2+KLRG1+CD90.2+Lineage-CD45+ ILC2s in stomachs of TCWT and TCΔ mice following treatment with LDTmx or HDTmx. N = 7, 5, 6 and 7 respectively. Data represents mean ± SEM, p values from one-way ANOVA and Tukey’s multiple comparisons tests **p < 0.01, ***p < 0.001, ****p < 0.0001, ns - not significant. Each symbol represents an individual mouse. Data is from two pooled experiments. Source data and exact p values are provided as a Source Data file.
Fig. 2
Fig. 2. Genetic ablation of tuft cell reduces gastric adenoma growth.
a Schematic outline of the genetic mouse models used to ablate tuft cells and ILC2s. Tuft cell ablation was achieved in gp130;F/FTCΔ mice and compared against gp130;F/FTCWT littermate controls. Constitutive ILC2 ablation in gp130;F/FILC2Δ mice were compared against gp130;F/FILC2WT littermate controls. All cohorts were given two injections of tamoxifen to induce tuft cell ablation at 16-weeks of age. EP = endpoint. b Representative wholemounts of stomachs of gp130F/F compound mutant mice as described in Fig. 2a. Black dotted circles indicate tumors. Scale bar = 8 mm. c Tumor mass of 17-week-old compound-mutant gp130F/F mice following genetic tuft cell ablation (gp130;F/FTCΔ) compared to Tmx-treated gp130;F/FTCWT. N = 7 and 9 respectively. d Tumor mass of 17-week-old ILC2Δ compared to age matched ILC2WT. N = 6 and 7 respectively. e Flow-cytometry quantification of SiglecF+ CD24+ EpCAM+ tuft cells in tumors of the indicated genotypes treated as described in Fig. 2a. N = 7, 8, 8 and 9 respectively. f Flow-cytometry quantification of ILC2s as KLRG1+CD90.2+Lineage-CD45+ in tumors of the indicated genotypes treated as described in Fig. 2a. N = 9, 9, 8 and 9 respectively. g, h Flow-cytometry quantification of iILC2s and nILC2s in tumors of the indicated genotypes treated as described in Fig. 2a. N = 9, 9, 8 and 9 respectively. i Schematic outline of the MNU/NaCl-induced GC mouse model and experimental mouse strains. TC;ΔILC2Δ, TC;WTILC2Δ, and ILC2;WTTCWT mice were treated with MNU for 5 alternating weeks, then were aged for 52 weeks with monthly tamoxifen injections to ablate tuft cells. EP = endpoint. Created with BioRender.com. j Quantification of tumor numbers in MNU/NaCl-treated mice as described in Fig. 2i. N = 10, 5 and 8 respectively. k Kaplan–Meier survival analysis of MNU/NaCl-treated mice, TC;WTILC2Δ *p = 0.0175 (cp to TC;WT ILC2WT), TC;ΔILC2Δ *p = 0.0173 (cp to TC;WTILC2WT, Mantel-Cox test). N = 14, 5 and 9 respectively. l Representative images and quantification of relative organoid diameter of 10-day old organoids derived from, gp130;F/FTCWT and gp130;F/FTCΔ mice. Scale bar = 300μm. n = 288 and 116 respectively. Data represents mean ± SEM, p values from two-sided Student’s t-test or one-way ANOVA and Tukey’s multiple comparisons tests *p < 0.05, **p < 0.01, ***p < 0.001, ****p < 0.0001, ns - not significant. Each symbol represents an individual mouse. All Data is from two pooled experiments. Source data and exact p values are provided as a Source Data file.
Fig. 3
Fig. 3. Tuft cells and ILC2s promote tumor growth via IL25 and IL13 signaling.
a t-SNE plot representing cell populations identified through unbiased cell clustering of pooled CD45.2+ and EpCAM+ cells sorted from gastric tissue and tumors of gp130+/+ (n = 10) and gp130F/F (n = 10) mice. b Cell clusters identified as tuft cells (purple) or ILC2s (red) using SingleR against the ImmGene database. c Violin plots displaying the distribution and expression of Il13, Il13ra1, Il4ra, Il25, and Il17rb across immune and epithelial cell populations of gp130+/+ and gp130F/F mice. d qRT-PCR analysis of gp130+/+ and gp130F/F sorted EpCAM+ and tuft cells (SiglecF+CD24+) for the expression of tuft cell genes Dclk1, Il25 and Il13ra1 (n = 6 mice). e qRT-PCR analysis of gp130+/+ and gp130F/F sorted CD45+ and ILC2s for the expression of Gata3, Il13, and Il17rb (n = 6 mice). Data represents mean ± SEM, p values from two-sided Student’s t-test or one-way ANOVA and Tukey’s multiple comparisons tests *p < 0.05, **p < 0.01, ***p < 0.001, ns - not significant. Source data and exact p values are provided as a Source Data file.
Fig. 4
Fig. 4. Inhibiting tuft cell-driven IL25 signaling inhibits the formation and growth of gastric tumor organoids.
a Representative images and quantification of relative organoid diameter of 10-day-old organoids derived from gp130F/F tumors and treated with either PBS (vehicle), IgG, IL13, IL25, or α-IL25 at 20 ng/ml for 7 days. Scale bar = 300 μm. Organoid n = 217 (vehicle), 325 (IL13), 322 (IL25), 293 (IgG) and 241 (α-IL25). Created with BioRender.com. Data represents mean ± SEM, p values from two-sided Student’s t-test *p < 0.05, ****p < 0.0001. Data is from two pooled experiments, each comprising 4 domes of organoids per group. Source data and exact p values are provided as a Source Data file.
Fig. 5
Fig. 5. Pharmacologic inhibition of the tuft cell-ILC2 circuit reduces gastric tumor growth.
a Schematic outline of the antibody-mediated blockade of IL13 or IL25. 13-week-old mice were treated with either α-IL13, α-IL25 or a matched IgG isotype control (300 μg/20 g mouse, once weekly for 3 weeks). Mice were culled one week after the third injection. EP = endpoint. b Representative images of gp130F/F stomachs treated as described in Fig. 3a. Dotted circles indicate tumors. Scale bar = 8 mm. c Tumor mass of gp130F/F mice following treatment with α-IL13 or a matched IgG isotype control. N = 6 and 6 respectively. d Tumor mass of gp130F/F mice following treatment with α-IL25 or a matched IgG isotype control. N = 6 and 6 respectively. e IHC staining and quantification of DCLK1+ tuft cells in α-IL13 and IgG treated gp130F/F mice. Scale bar = 300 μm. N = 6 and 6 respectively. f IHC staining quantification of DCLK1+ tuft cells in α-IL25 and IgG treated gp130F/F mice. Scale bar = 300 μm. N = 6 and 7 respectively. g Flow-cytometry quantification of KLRG1+CD90.2+Lineage CD45+ ILC2s in tumors of gp130F/F mice treated with α-IL13 or a matched IgG isotype control. N = 6 and 6 respectively. h Immunofluorescence (IF) staining and quantification of Gata3+CD3- ILC2s in tumors of gp130F/F mice treated with α-IL25 or a matched IgG control. Arrows indicate ILC2s. Scale bar = 100 μm. N = 5 and 5 respectively. Data represents mean ± SEM, p values from two-sided Student’s t-test *p < 0.05, **p < 0.01, ***p < 0.001. Each symbol represents an individual mouse. Data is from two pooled experiments. Source data and exact p values are provided as a Source Data file.
Fig. 6
Fig. 6. Tuft cells and ILC2 are involved in human GC.
a, b Kaplan–Meier survival analysis for intestinal-type (IGC) and diffuse-type (DGC) GC patients segregated at the median level of gene expression for tuft cell (ChAT, IL25, POU2F3, TSLP, ALOX5, COX1, and AVIL) and ILC2 (GATA3, IL13, ICOS, KLRG1, CRTH2, IL5, and IL4) gene signatures. Data represents Kaplan–Meier plots depicting overall survival of GC patients from the GSE14210 (n = 145), GSE15459 (n-200), GSE22377 (n-43), GSE29272 (n = 268), GSE51105 (n = 94) and GSE62254 (n = 300) datasets. P value calculated with the Log-rank (Mantel-Cox) test. c Quantification of tuft cells and/or ILC2s in human intestinal-type GC tumor microarrays (Supplementary Fig. 8a) (n = 67 patients). d Tuft cell and ILC2 feed-forward circuit promotes gastric metaplasia and tumor development through IL25 and IL13 signaling. Proposed initiation of the circuit through Natural killer cell, macrophage/epithelial or T cell produced IL33, leading to increased secretion of IL13 by activated nILC2s. Created with BioRender.com.

References

    1. Ferlay J, et al. Estimates of worldwide burden of cancer in 2008: GLOBOCAN 2008. Int. J. Cancer. 2010;127:2893–2917. doi: 10.1002/ijc.25516. - DOI - PubMed
    1. Ferlay J, et al. Estimating the global cancer incidence and mortality in 2018: GLOBOCAN sources and methods. Int. J. Cancer. 2019;144:1941–1953. doi: 10.1002/ijc.31937. - DOI - PubMed
    1. Bray F, et al. Global cancer statistics 2018: GLOBOCAN estimates of incidence and mortality worldwide for 36 cancers in 185 countries. CA Cancer J. Clin. 2018;68:394–424. doi: 10.3322/caac.21492. - DOI - PubMed
    1. Moy KA, et al. Alcohol and tobacco use in relation to gastric cancer: a prospective study of men in Shanghai, China. Cancer Epidemiol. Biomark. Prev. 2010;19:2287–2297. doi: 10.1158/1055-9965.EPI-10-0362. - DOI - PMC - PubMed
    1. Duell EJ, et al. Alcohol consumption and gastric cancer risk in the European Prospective Investigation into Cancer and Nutrition (EPIC) cohort. Am. J. Clin. Nutr. 2011;94:1266–1275. doi: 10.3945/ajcn.111.012351. - DOI - PubMed

Publication types