. 2023 Oct 28;14(1):6878.
doi: 10.1038/s41467-023-42064-1.

Wastewater sequencing reveals community and variant dynamics of the collective human virome

Affiliations

Wastewater sequencing reveals community and variant dynamics of the collective human virome

Michael Tisza et al. Nat Commun. .

Abstract

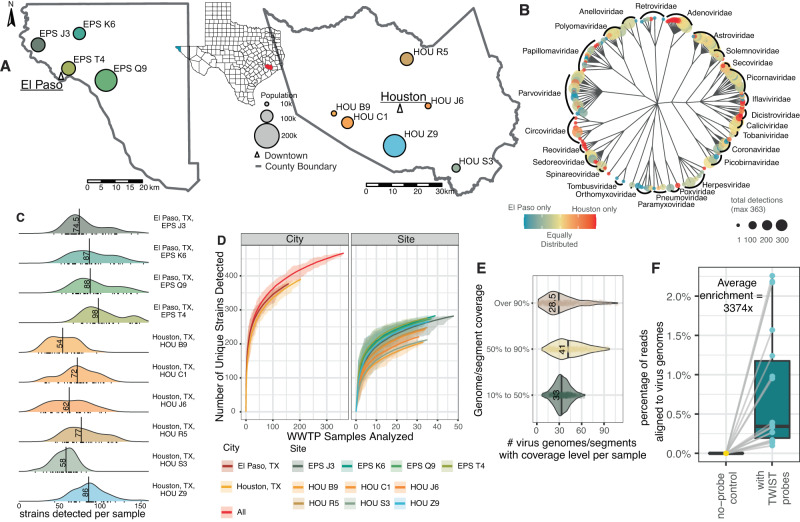
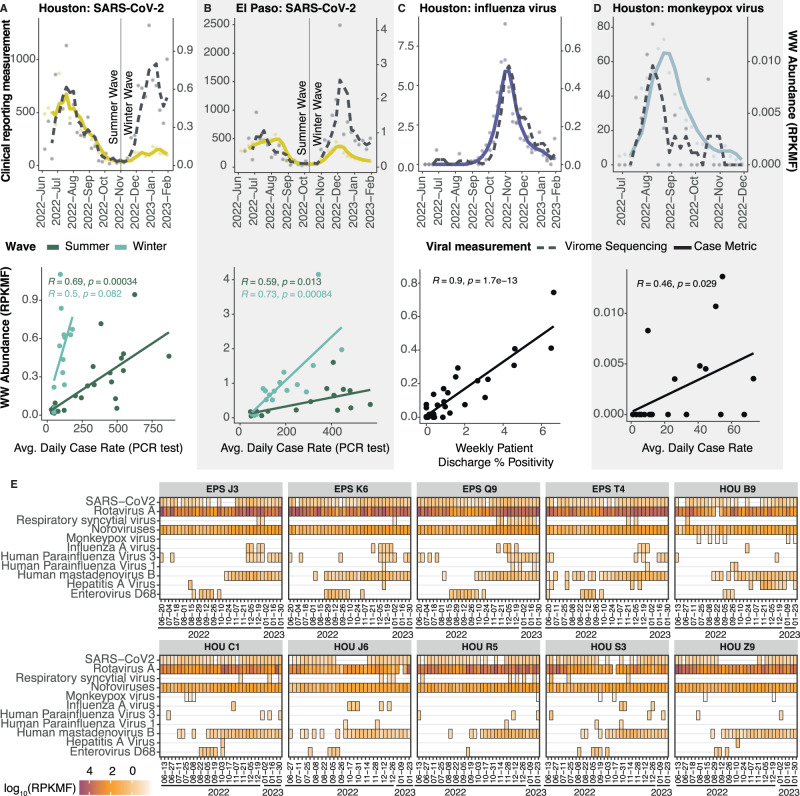
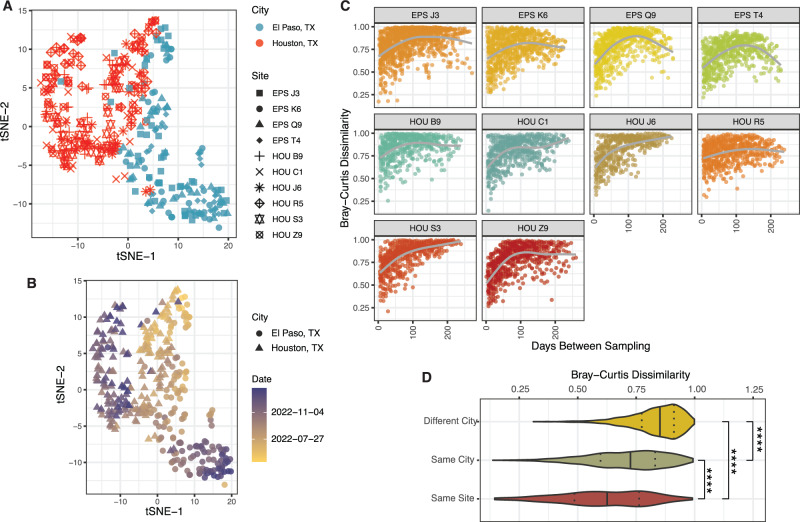
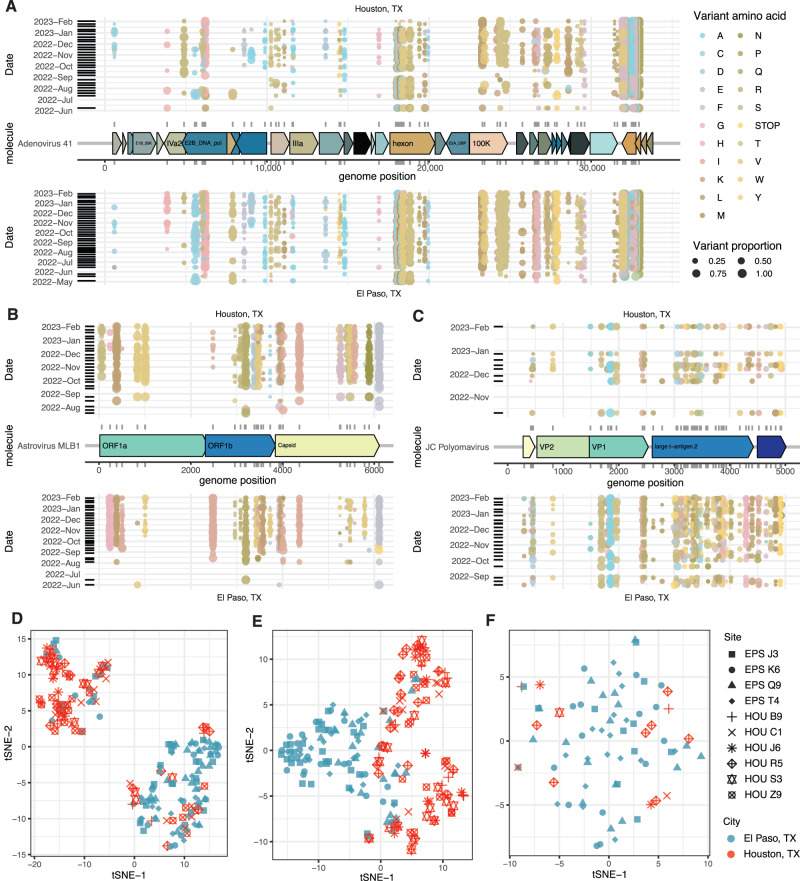
Wastewater is a discarded human by-product, but its analysis may help us understand the health of populations. Epidemiologists first analyzed wastewater to track outbreaks of poliovirus decades ago, but so-called wastewater-based epidemiology was reinvigorated to monitor SARS-CoV-2 levels while bypassing the difficulties and pit falls of individual testing. Current approaches overlook the activity of most human viruses and preclude a deeper understanding of human virome community dynamics. Here, we conduct a comprehensive sequencing-based analysis of 363 longitudinal wastewater samples from ten distinct sites in two major cities. Critical to detection is the use of a viral probe capture set targeting thousands of viral species or variants. Over 450 distinct pathogenic viruses from 28 viral families are observed, most of which have never been detected in such samples. Sequencing reads of established pathogens and emerging viruses correlate to clinical data sets of SARS-CoV-2, influenza virus, and monkeypox viruses, outlining the public health utility of this approach. Viral communities are tightly organized by space and time. Finally, the most abundant human viruses yield sequence variant information consistent with regional spread and evolution. We reveal the viral landscape of human wastewater and its potential to improve our understanding of outbreaks, transmission, and its effects on overall population health.


Conflict of interest statement

The authors declare that they have no competing interests.

Figures

Fig. 1
Fig. 1. Study sites, capture, and viral diversity.
A Map of wastewater catchment areas in Houston and El Paso, TX. The colored areas refer to the sites in each city (EP = 4, Houston = 6). B The treelike object was drawn with hierarchical taxonomical labels (kingdom, phylum, class, order, family, genus, species) rather than multiple sequence alignments due to independent origins of different virus phyla. Tip point size corresponds to number of wastewater samples with the virus detected, and color corresponds to the skew of the species to Houston (red) or El Paso (blue). C Number of distinct virus strains detected per sample from each wastewater treatment plant. D Rarefaction curves measuring distinct virus strains detected as more samples were analyzed. Lines represent average strains detected while shaded bands represent minimum and maximum values from 50 permutations. E Genome coverage of detected virus genome/segments for each sample. F Percentage of reads aligned to virus pathogen genome database in paired control (no-probe) and treatment (capture with the TWIST Comprehensive Virus Research Panel) groups. n = 18 biologically independent samples. Boxplots are defined as: center line = median, lower and upper box-bounds = 25th and 75th data percentiles, and whiskers extend to the minimum and maximum values.
Fig. 2
Fig. 2. Human viruses in wastewater correlate with clinical data.
A SARS-CoV-2 wastewater sequencing abundance compared to reported cases (top) and scatter plot with Pearson correlation coefficients and p-value for two-sided test between wastewater sequencing abundance compared to reported cases of SARS-CoV-2 (bottom) in Houston, TX. B SARS-CoV-2 wastewater sequencing abundance compared to reported cases (top) and scatter plot with Pearson correlation coefficients and p-value for two-sided test between wastewater sequencing abundance compared to reported cases of SARS-CoV-2 (bottom) in El Paso, TX. C Influenza wastewater sequencing abundance compared to reported Weekly Percentage of Visits with Discharge Diagnosed Influenza (top) and scatter plot with Pearson correlation coefficients and p-value for two-sided test between wastewater sequencing abundance compared to Weekly Percentage of Visits with Discharge Diagnosed of Influenza (bottom) in Houston, TX. D Monkeypox virus wastewater sequencing abundance compared to reported Mpox cases (top) and scatter plot with Pearson correlation coefficients and p-value for two-sided test between wastewater sequencing abundance. E Heatmap for all ten wastewater sites for presence/absence and abundance for 11 pathogens of major concern (y-axis) across the entire study period (x-axis).
Fig. 3
Fig. 3. Wastewater virome community structure.
A t-SNE of wastewater samples using virome abundance data, showing different cities/sites. B t-SNE of wastewater samples using virome abundance data, showing samples over time. C Temporal analysis of intra-site community changes. Each dot is a comparison between two samples. The x-axis measures days in between sampling. The y-axis measures Bray-Curtis dissimilarity between the samples. D Bray-Curtis dissimilarity between samples taken +/- 7 days apart, comparing samples from the same site, different site but same city, and different city. ****Represents t-test p-value < 1e-04. Different City vs Same Site, p = 6.2e−164. Different City vs Same City, p = 2.1e−214. Same City vs Same Site, p = 2.9e−30.
Fig. 4
Fig. 4. Evaluation of non-synonymous variants in prevalent wastewater viruses.
A Genome map of Human Adenovirus 41 (middle) with non-synonymous variants displayed above (Houston, TX) and below (El Paso, TX) according to genome position (X-axis) and date (Y-axis). B Like (A) but with Astrovirus MLB1. C Like (A) but with JC Polyomavirus. D t-SNE of non-synonymous variant frequency of astrovirus MLB1. E Like (D) but with JC Polyomavirus. F Like (D) but with JC Polyomavirus.

References

    1. Castiglioni S, Thomas KV, Kasprzyk-Hordern B, Vandam L, Griffiths P. Testing wastewater to detect illicit drugs: state of the art, potential and research needs. Sci. Total Environ. 2014;487:613–620. doi: 10.1016/j.scitotenv.2013.10.034. - DOI - PubMed
    1. Venkatesan AK, Halden RU. Wastewater treatment plants as chemical observatories to forecast ecological and human health risks of manmade chemicals. Sci. Rep. 2014;4:3731. doi: 10.1038/srep03731. - DOI - PMC - PubMed
    1. Harrington A, et al. Urban monitoring of antimicrobial resistance during a COVID-19 surge through wastewater surveillance. Sci. Total Environ. 2022;853:158577. doi: 10.1016/j.scitotenv.2022.158577. - DOI - PMC - PubMed
    1. Rothman JA, et al. Longitudinal metatranscriptomic sequencing of Southern California wastewater representing 16 million people from August 2020-21 reveals widespread transcription of antibiotic resistance genes. Water Res. 2023;229:119421. doi: 10.1016/j.watres.2022.119421. - DOI - PubMed
    1. Diamond MB, et al. Wastewater surveillance of pathogens can inform public health responses. Nat. Med. 2022;28:1992–1995. doi: 10.1038/s41591-022-01940-x. - DOI - PubMed

Publication types