. 2023 Oct 28;14(1):6883.
doi: 10.1038/s41467-023-42661-0.

A phosphoinositide switch mediates exocyst recruitment to multivesicular endosomes for exosome secretion

Affiliations

A phosphoinositide switch mediates exocyst recruitment to multivesicular endosomes for exosome secretion

Di-Ao Liu et al. Nat Commun. .

Abstract

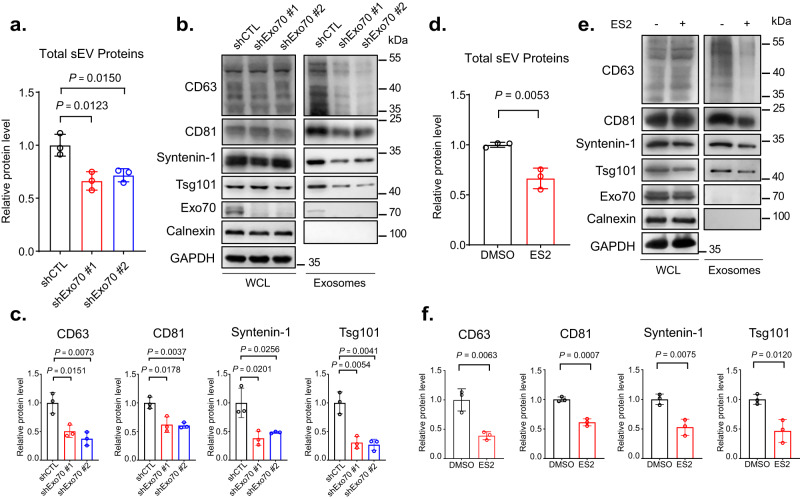
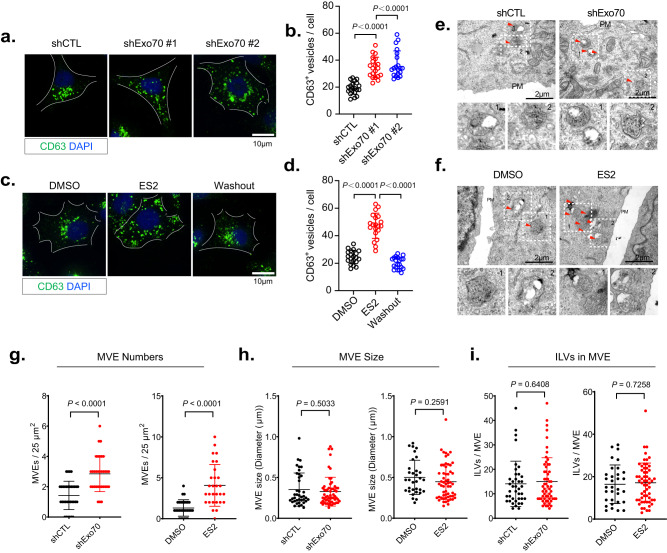
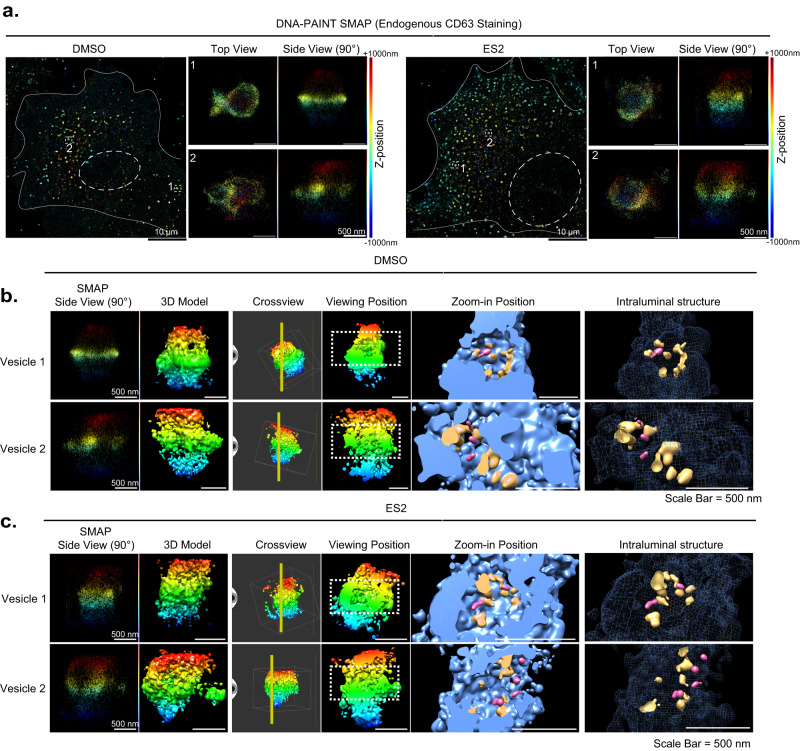
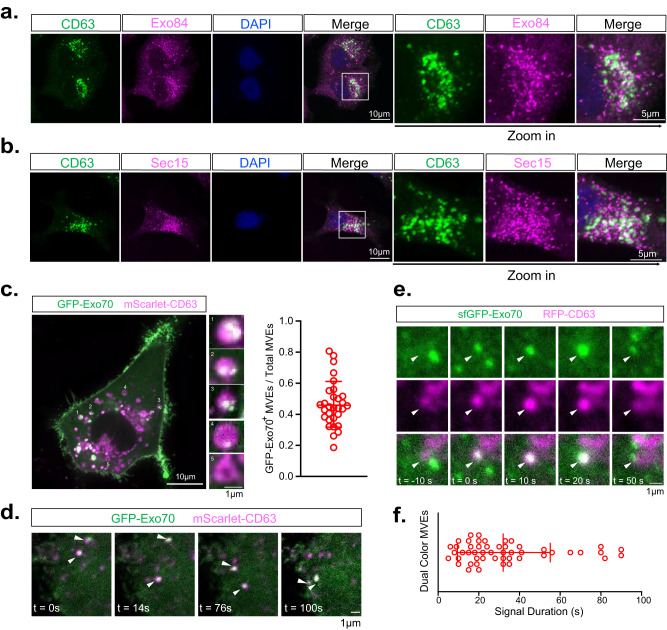
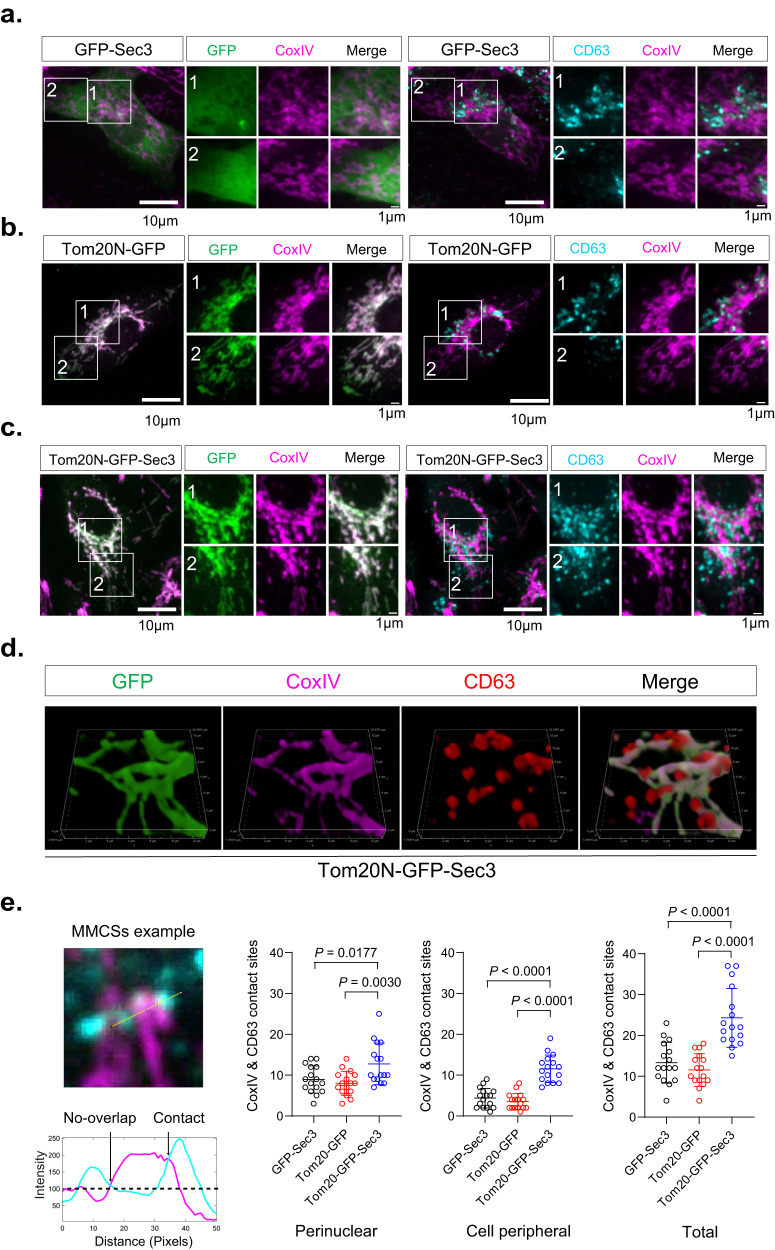
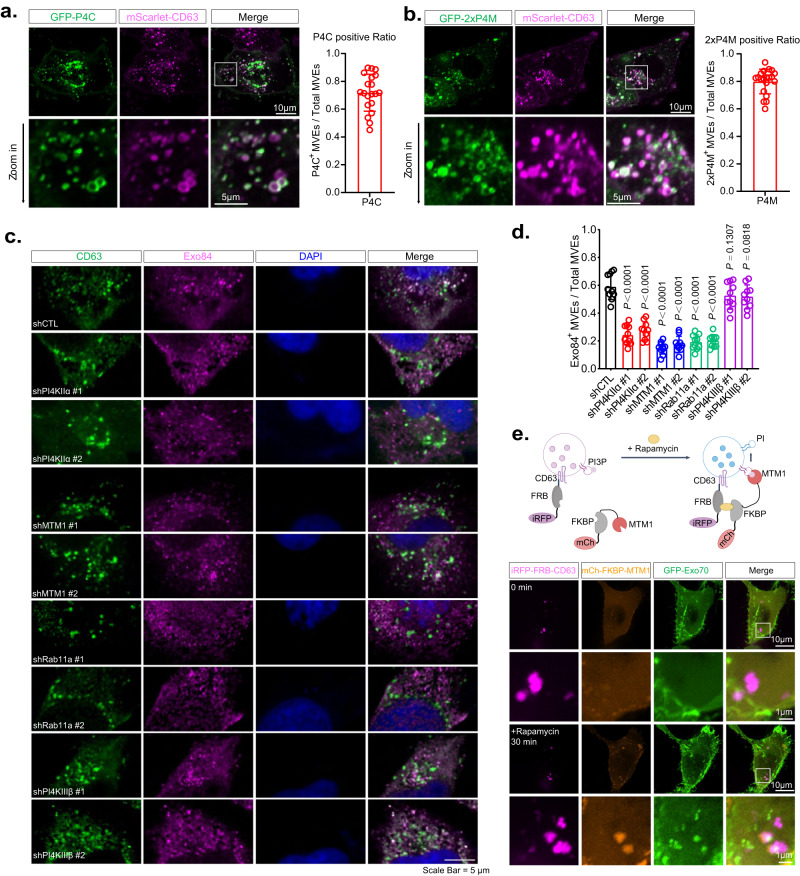
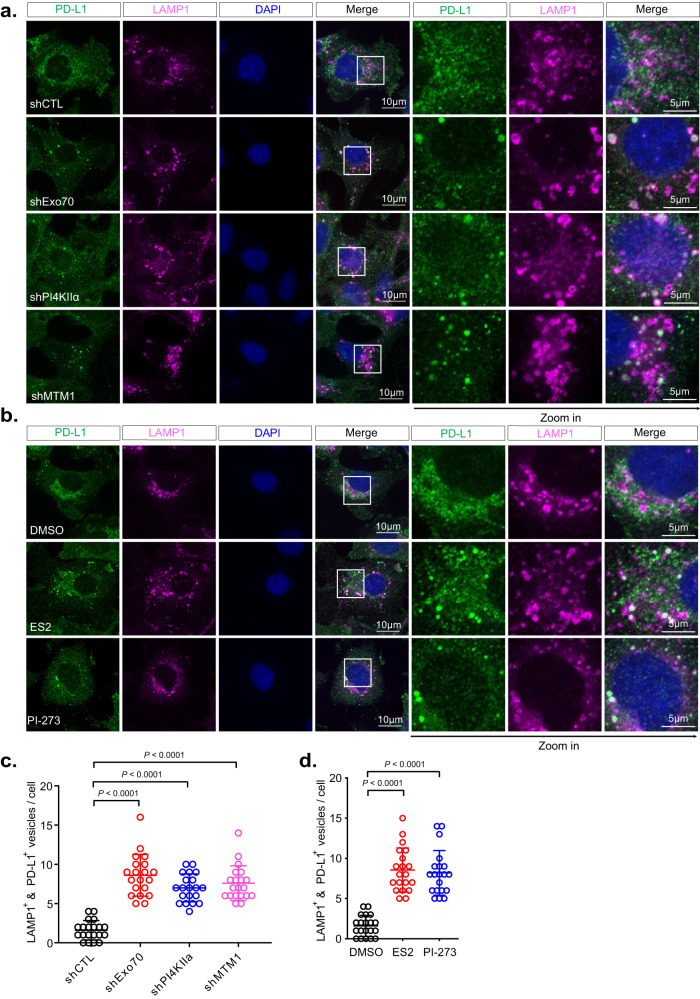
Exosomes are secreted to the extracellular milieu when multivesicular endosomes (MVEs) dock and fuse with the plasma membrane. However, MVEs are also known to fuse with lysosomes for degradation. How MVEs are directed to the plasma membrane for exosome secretion rather than to lysosomes is unclear. Here we report that a conversion of phosphatidylinositol-3-phosphate (PI(3)P) to phosphatidylinositol-4-phosphate (PI(4)P) catalyzed sequentially by Myotubularin 1 (MTM1) and phosphatidylinositol 4-kinase type IIα (PI4KIIα) on the surface of MVEs mediates the recruitment of the exocyst complex. The exocyst then targets the MVEs to the plasma membrane for exosome secretion. We further demonstrate that disrupting PI(4)P generation or exocyst function blocked exosomal secretion of Programmed death-ligand 1 (PD-L1), a key immune checkpoint protein in tumor cells, and led to its accumulation in lysosomes. Together, our study suggests that the PI(3)P to PI(4)P conversion on MVEs and the recruitment of the exocyst direct the exocytic trafficking of MVEs for exosome secretion.


Conflict of interest statement

The authors declare no competing interests.

Figures

Fig. 1
Fig. 1. Exo70 regulates the secretion of exosomes.
a Concentrations of total exosome proteins derived from culture supernatants of MDA-MB-231 cells stably expressing the control (“shCTL”) or Exo70 shRNAs. Two shRNA sequences targeting different regions of Exo70 sequence (“shRNA#1” and “shRNA#2”) were used (n = 3). The average concentration of exosome proteins from cells treated with Exo70 shRNAs was normalized to that of cells treated with shCTL. b Western blotting analysis of whole cell lysates (“WCL”) and exosomes isolated from the culture media of the control and Exo70 knockdown cells. Exosomes from equal amounts of cells (1 × 107) were collected. The Exo70 and exosome marker proteins CD63, CD81, Syntenin-1, and Tsg101, and the ER marker protein Calnexin are examined. GAPDH is used as a loading control for whole cell lysates. c Quantification of the amounts of CD63, CD81, Syntenin-1, and Tsg101 on exosomes derived from the control and Exo70 knockdown cells (n = 3). The average levels of each protein from cells expressing Exo70 shRNAs are normalized to that from shCTL cells. d Quantification of total exosome proteins derived from DMSO or ES2-treated cells (n = 3). e Western blot analysis of whole cell lysates and exosomes isolated from DMSO and ES2-treated cells. The average concentration of exosome proteins from cells treated with ES2 is normalized to that of cells treated with DMSO. f Quantification of CD63, CD81, Syntenin-1, and Tsg101 on exosomes from DMSO and ES2-treated cells (n = 3). The average level of each exosomal protein from cells treated with ES2 is normalized to that of cells treated with DMSO. Data are presented as mean ± s.d. of three independent biological replicates. P-values are calculated using two-sided unpaired t-test.
Fig. 2
Fig. 2. Inhibition of Exo70 leads to intracellular accumulation of MVEs.
a Immunofluorescence staining of CD63 in cells stably expressing the control or Exo70 shRNAs. Scale bar = 10 μm. b Quantification of MVEs marked by CD63 in cells stably expressing the control or Exo70 shRNAs (n = 20 cells). Data are presented as mean ± s.d. P-values are calculated using two-sided unpaired t-test. c Immunofluorescence staining of CD63 in cells treated with DMSO, ES2, or after treatment and washout of ES2. Scale bar = 10 μm. Data are presented as mean ± s.d. P-values are calculated using two-sided unpaired t-test. d Quantification of CD63-positive MVEs in cells treated with DMSO, ES2, or after the treatment and washout of ES2 (n = 20 cells). Data are presented as mean ± s.d. P-values are calculated using two-sided unpaired t-test. e, f Representative electron microscopy images of MVEs in cells stably expressing control or Exo70 shRNA (e) or in cells treated with DMSO or ES2 (f). Scale bars = 2 μm. Red arrows indicate MVEs. Dashed rectangles indicate regions zoomed in the respective lower panels. gi Quantification of the number (g) and size (h) of MVEs and the ILV numbers of each MVE (i) in EM images in conditions shown in (e) (n = 32 cells for shCTL/shExo70, n = 29 cells for DMSO/ES2). Data are presented as mean ± s.d. P-values are calculated using two-sided unpaired t-test.
Fig. 3
Fig. 3. Super-resolution imaging of MVEs by DNA-PAINT.
a 3D DNA-PAINT images of COS-7 cells treated with DMSO (left panels) or ES2 (right panels). The relative z-positions of the localizations within the ~2 µm axial range (effective imaging range is ~1.5 µm) are color-coded as indicated. The white dashed rectangles mark the CD63-positive vesicles (zoomed in) and are shown as viewed from the apical side of the cells (top view) or from an angle perpendicular to the bottom membrane (side view). b, c Volumetric renderings of the CD63-positive vesicles shown in (a) from DMSO-treated (b) and ES2-treated (c) cells. The 3D localizations are converted into molmaps using UCSF Chimera with a sigma factor of 1.5, which results in a final rendering resolution of ~24 nm. Left-most columns are side views from SMAP, each paired with a corresponding 3D structural model from Chimera (2nd columns). The vertical yellow line in “Crossview” panel (third columns) corresponds to the cutting plane for the subsequent cross-section views (columns four, five, and six), all shown as viewed from the left of the cutting plane. White boxes in the cross views indicate the outer bounds of SMAP localizations, while the dotted white rectangles in the viewing position (fourth columns) indicate the border of the zoom-in views, shown as filled volumes (fifth columns) or wireframes (sixth columns). Within both zoom-in views, pink-colored structures indicate intraluminal vesicles, which correspond to densities within the interior cavity that are detached from the enclosing lumen. The orange-colored structures indicate potential invaginations that are budding off and still connected to the enclosing MVE membrane. Scale bars = 10 µm (white, as in overviews) or 500 nm (white, as in close-up views). All experiments were repeated more than three times in (a, b and c).
Fig. 4
Fig. 4. The exocyst is associated with a subpopulation of MVEs.
a, b Immunostaining of CD63 and Exo84 (a) and CD63 and Sec15 (b) in MDA-MB-231 cells. Scale bar = 10 µm (overview) or 5 µm (zoom-in view). (n = 12 cells) and quantification is presented in Supplementary Fig. 4. c Confocal imaging of mScarlet-CD63+ and GFP-Exo70+ vesicles. Five representative CD63+ vesicles are enlarged in small panels. Quantification of the portion of mScarlet-CD63+ GFP-Exo70+ vesicles in total mScarlet-CD63+ vesicles is shown at right (n = 30 cells). Data are presented as mean ± s.d. Scale bar = 10 µm (overview) or 1 µm (zoom-in view). d Time-lapse confocal imaging of mScarlet-CD63+ and GFP-Exo70+ vesicles (arrowhead) moving toward the plasma membrane. Scale bar = 1 μm. e TIRF microscopy imaging of an RFP-CD63+ and sfGFP-Exo70+ vesicle (arrowhead) during its arrival at the plasma membrane. Scale bar = 1 μm. Scale bar = 1 μm. f Quantification of the duration of the RFP-CD63+ and sfGFP-Exo70+ vesicle at the plasma membrane in (e) (n = 50 vesicles). Data are presented as mean ± s.d.
Fig. 5
Fig. 5. Ectopic recruitment of MVEs to mitochondria by Tom20N-GFP-Sec3.
a GFP-Sec3 (green) shows diffuse cytosolic distribution and does not colocalize with mitochondria marked by CoxIV (magenta). CD63 (cyan) is mainly present in the perinuclear region (marked in Box 1), and to a lesser extent, in the peripheral region (Box 2) of the cell. These two regions are magnified at right. b Tom20N-GFP is localized to mitochondria. CD63 is mainly present in the perinuclear region, and to a lesser extent, in the peripheral region of the cell. c Tom20N-GFP-Sec3 is localized to mitochondria. CD63-positive MVEs (cyan) are also recruited to mitochondria in these cells and are present in both the perinuclear and peripheral cell regions. d 3D reconstruction of a representative cell expressing Tom20N-GFP-Sec3 shows the association of CD63-positive vesicles with mitochondria in a pattern that resembles “tomatoes on the vine”. e A representative image of MMCS is shown at the left. The intensity profile shows one contact site with an overlapped CoxIV-CD63 signal above the background signal. Quantification of CD63-CoxIV contact sites (see “Methods”) in the perinuclear region, peripheral region, and the whole cell (n = 15 cells) are shown at the right. Scale bars are indicated in the panels. Data are presented as mean ± s.d. P-values are calculated using two-sided unpaired t-test.
Fig. 6
Fig. 6. The PI(3)P to PI(4)P conversion controlled by MTM1 and PI4KIIα mediates the recruitment of the exocyst to the MVEs.
a, b PI(4)P reporters GFP-P4C (a) and GFP-2xP4M (b) partially colocalize with mScarlet-CD63-positive MVEs. Zoom-in images of the boxed region are shown on the lower panels. Quantifications of the subpopulation of PI(4)P containing MVEs are shown at right (n = 20 cells). Scale bars are indicated in the panels. Data are presented as mean ± s.d. P-values are calculated using two-sided unpaired t-test. c Immunostaining of Exo84 (magenta) and CD63 (green) in cells stably expressing non-targeting shRNA (shCTL) or shRNAs targeting PI4KIIα, MTM1, Rab11a, or PI4KIIIβ. The nuclei are stained with DAPI. Scale bars = 5 µm. d Quantification of the subpopulation of Exo84-positive MVEs in cells with control shRNA or shRNAs targeting PI4KIIα, MTM1, Rab11a, or PI4KIIIβ (n = 10 cells). Data are presented as mean ± s.d. P-values are calculated using two-sided unpaired t-test. e Recruitment of Exo70 to CD63-positive MVEs by rapamycin induced MTM1 dephosphorylation of PI(3)P on MVEs. Upper panel: diagram of the experimental design. When rapamycin is added to cells co-expressing iRFP-FRB-CD63, mCherry-FKBP-MTM1, and GFP-Exo70, it induces the recruitment of MTM1 to MVEs, which leads to the conversion of PI(3)P to PI, thus providing a substrate for PI(4)P generation and subsequent exocyst recruitment. Lower panel: fluorescence microscopy imaging shows that both MTM1 and GFP-Exo70 associate with CD63-positive MVEs (arrowheads) 30 min after the addition of rapamycin. Scale bar = 1 μm. Experiments are performed more than three times.
Fig. 7
Fig. 7. Inhibition of Exo70, PI4KIIα, or MTM1 leads to re-distribution of PD-L1 to the lysosomes.
a Confocal imaging of PD-L1 in cells stably expressing control shRNA or shRNAs targeting Exo70, PI4KIIα, or MTM1. LAMP1 is used as a lysosome marker. Zoom-in images of the boxed regions are shown on the right. b Confocal imaging of PD-L1 in cells treated with DMSO, ES2, or PI-273. Zoom-in images of the boxed regions are shown to the right. c Quantification of PD-L1 and LAMP1 double positive vesicles in cells treated with control shRNA or shRNAs targeting Exo70, PI4KIIα, or MTM1 (n = 20 cells). Data are presented as mean ± s.d. P-values are calculated using two-sided unpaired t-test. d Quantification of PD-L1 and LAMP1 double positive vesicles in cells treated with DMSO, ES2, or PI-273 (n = 20 cells). Scale bars are indicated in the panels. Data are presented as mean ± s.d. P-values are calculated using two-sided unpaired t-test.

References

    1. Kalluri R, LeBleu VS. The biology, function, and biomedical applications of exosomes. Science. 2020;367:eaau6977. doi: 10.1126/science.aau6977. - DOI - PMC - PubMed
    1. van Niel G, D’Angelo G, Raposo G. Shedding light on the cell biology of extracellular vesicles. Nat. Rev. Mol. Cell Biol. 2018;19:213–228. doi: 10.1038/nrm.2017.125. - DOI - PubMed
    1. Mathieu M, Martin-Jaular L, Lavieu G, Thery C. Specificities of secretion and uptake of exosomes and other extracellular vesicles for cell-to-cell communication. Nat. Cell. Biol. 2019;21:9–17. doi: 10.1038/s41556-018-0250-9. - DOI - PubMed
    1. van Niel G, et al. Challenges and directions in studying cell-cell communication by extracellular vesicles. Nat. Rev. Mol. Cell Biol. 2022;23:369–382. doi: 10.1038/s41580-022-00460-3. - DOI - PubMed
    1. Dixson AC, Dawson TR, Di Vizio D, Weaver AM. Context-specific regulation of extracellular vesicle biogenesis and cargo selection. Nat. Rev. Mol. Cell Biol. 2023;24:454–476. doi: 10.1038/s41580-023-00576-0. - DOI - PMC - PubMed

Publication types

MeSH terms

Substances