. 2023 Oct 28;14(1):6887.
doi: 10.1038/s41467-023-42662-z.

Ventral striatal islands of Calleja neurons bidirectionally mediate depression-like behaviors in mice

Affiliations

Ventral striatal islands of Calleja neurons bidirectionally mediate depression-like behaviors in mice

Yun-Feng Zhang et al. Nat Commun. .

Abstract

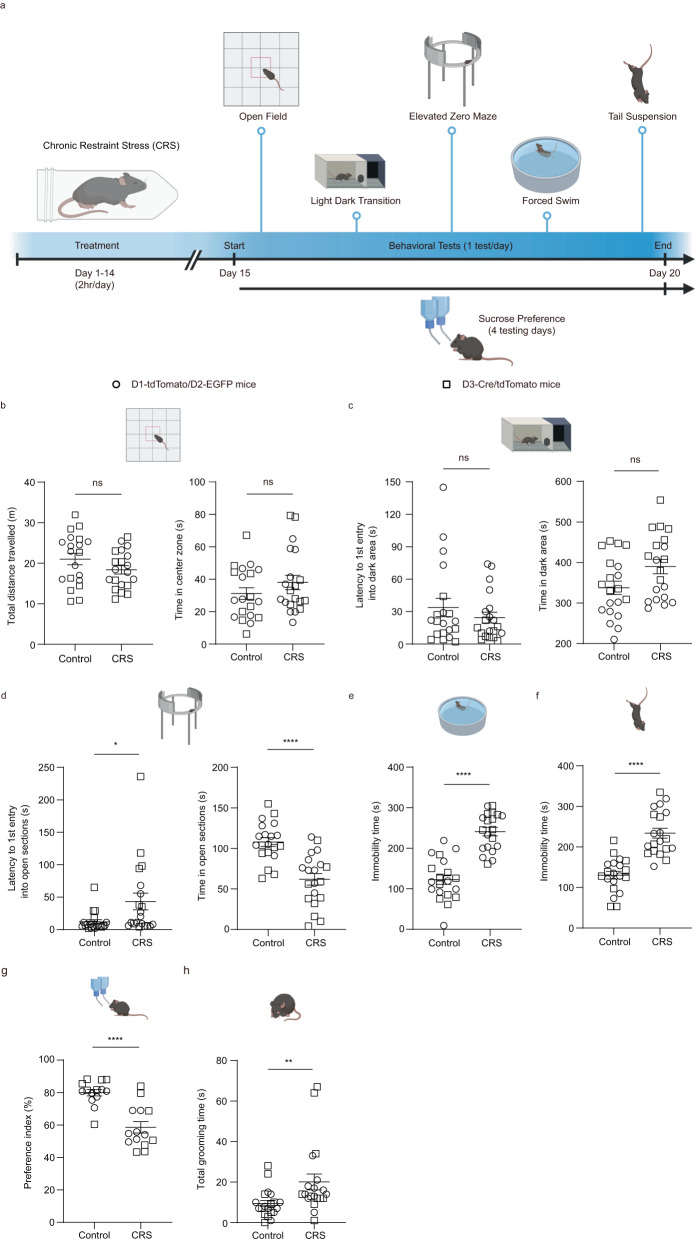
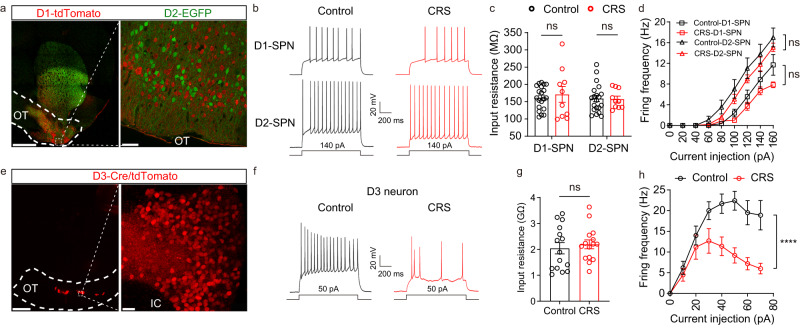
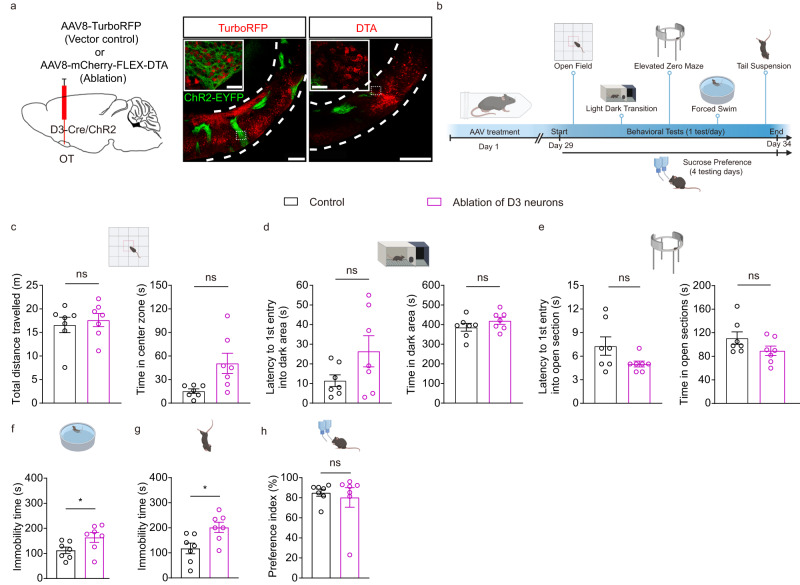
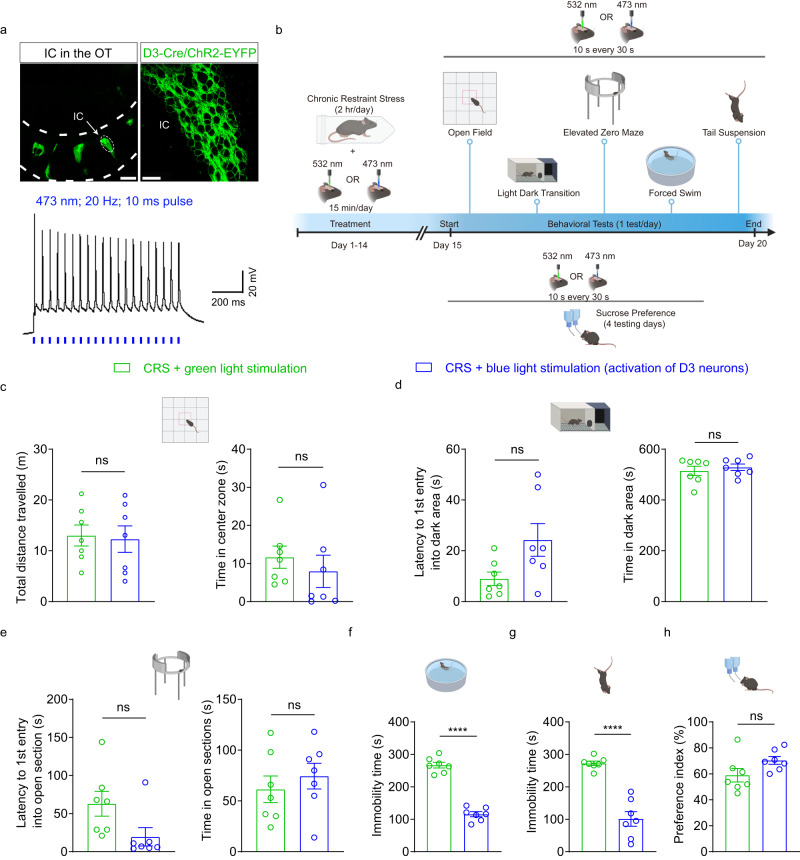
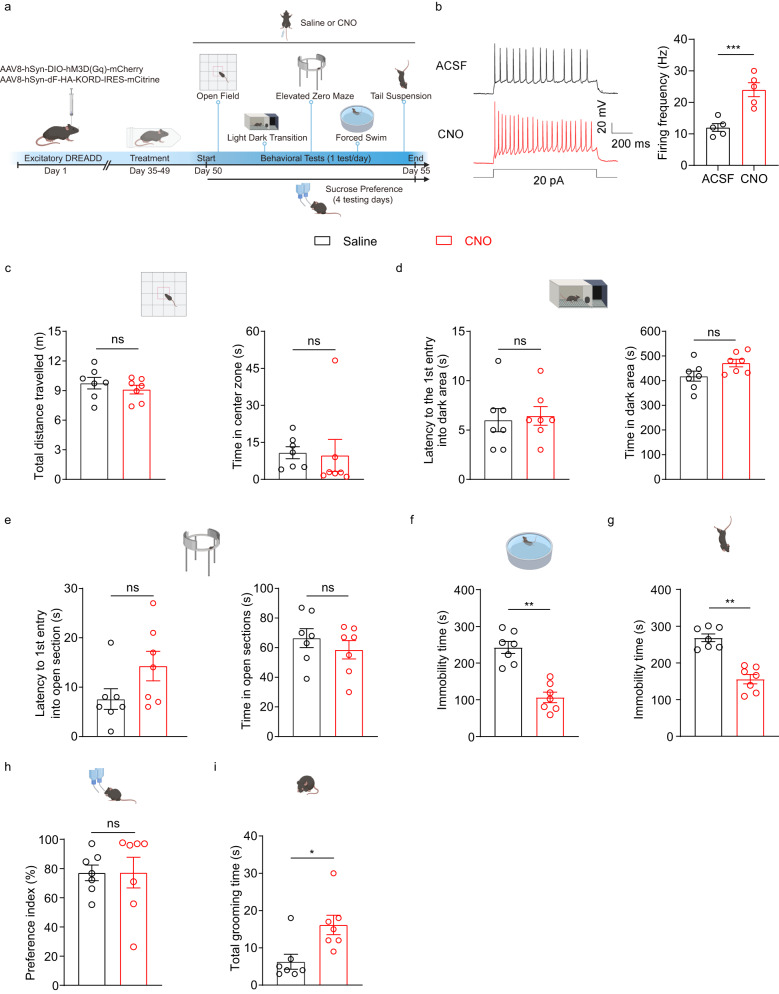
The ventral striatum is a reward center implicated in the pathophysiology of depression. It contains islands of Calleja, clusters of dopamine D3 receptor-expressing granule cells, predominantly in the olfactory tubercle (OT). These OT D3 neurons regulate self-grooming, a repetitive behavior manifested in affective disorders. Here we show that chronic restraint stress (CRS) induces robust depression-like behaviors in mice and decreases excitability of OT D3 neurons. Ablation or inhibition of these neurons leads to depression-like behaviors, whereas their activation ameliorates CRS-induced depression-like behaviors. Moreover, activation of OT D3 neurons has a rewarding effect, which diminishes when grooming is blocked. Finally, we propose a model that explains how OT D3 neurons may influence dopamine release via synaptic connections with OT spiny projection neurons (SPNs) that project to midbrain dopamine neurons. Our study reveals a crucial role of OT D3 neurons in bidirectionally mediating depression-like behaviors, suggesting a potential therapeutic target.


Conflict of interest statement

The authors declare no competing interests.

Figures

Fig. 1
Fig. 1. Chronic restraint stress (CRS) changes affective behaviors in mice.
a Experimental strategy and timeline for behavioral assays. Created with BioRender.com. bh Effects of CRS on behavioral performance in different tests. Since CRS caused similar behavioral changes in the two mouse strains used, we pooled the data for statistical analysis (see Supplementary Figs. 1 and  2 for data in each mouse line and each sex). b Open field test: total distance traveled (left; t(38) = 1.507 and p = 0.840) and time in the center zone (right; t(38) = 1.203 and p = 1.000). c Light-dark box transition test: latency to the first entry into the dark area (left; p = 1.000) and time spent in the dark area (right; t(38) = 2.152 and p = 0.228). d Elevated zero maze test: latency to the first entry into open sections (left; p = 0.048) and time in the open sections (right; t(38) = 5.129 and p = 5.33× 10−5). e Forced swimming test: immobility time (t(38) = 7.599 and p = 3.90 × 10−9). f Tail suspension test: immobility time (t(38) = 6.693 and p = 6.43 × 10−8). g Sucrose preference test: preference index (p = 7.82 × 10−5). h Total grooming time in the open field test (p = 2.77 × 10−3). n = 10 D1-tdTomato/D2-EGFP mice (circle) and 10 D3-Cre/tdTomato mice (square) in bf, h and n = 7 per mouse line in g. Different cohorts of mice were used in bf, h and g. Data are expressed as mean ± SEM. Student’s two-tailed unpaired t test for b and time in cf; two-sided Mann–Whitney test for latency in c, d and g, h. P values in bd are adjusted by the Bonferroni correction. *p < 0.05, **p < 0.01, ****p < 0.0001; ns not significant. Source data are provided in the Source Data file.
Fig. 2
Fig. 2. Chronic restraint stress (CRS) significantly decreases neuronal excitability of OT D3 neurons, but not D1- and D2-SPNs.
Confocal images from the olfactory tubercle (OT) showing D1-tdTomato and D2-EGFP SPNs (a) and D3-Cre/tdTomato neurons (e). Left, low-magnification images. Scale bar: 1 mm. Right, enlarged images. Scale bars: 50 μm (a) and 20 μm (e). Similar patterns were observed in 3 mice from each line. Patch-clamp recordings showing current injection-induced firing of D1- and D2-SPNs (b) and D3 neurons (f) from controls (black) and CRS-treated (red) mice. Input resistance of D1-tdTomato and D2-EGFP SPNs (c) and D3-tdTomato neurons (g). D1-SPNs: t(28) = 0.486 and p = 0.631. D2-SPNs: t(28) = 0.127 and p = 0.900. n = 20 and 10 for control and CRS, respectively. D3 neurons: t(28) = 0.552 and p = 0.585; n = 15 per group. Firing frequency of D1- and D2-SPNs (d) and D3 neurons (h) upon current injections from controls and CRS-treated mice. D1-SPNs: treatment, F(1, 25) = 0.824 and p = 0.373; current, F(8, 200) = 72.813 and p < 0.1× 10−13; treatment × current, F(8, 200) = 0.971 and p = 0.460; n = 20 and 7 neurons for 5 control and 4 CRS mice, respectively. D2-SPNs: treatment, F(1, 28) = 0.898 and p = 0.351; current, F(8, 220) = 26.897 and p < 0.1× 10−13; treatment × current, F(8, 220) = 0.534 and p = 0.830; n = 20 and 10 neurons for 5 control and 4 CRS mice, respectively. D3 neurons: treatment, F(1, 18) = 10.289 and p = 0.005; current, F(3, 48) = 30.674 and p < 0.1× 10−7; treatment × current, F(7, 126) = 6.451 and p = 1.68× 10−5; n = 10 neurons each condition from 5 control and 5 CRS mice. Holding membrane potential = −60 mV for all recordings. Data are expressed as mean ± SEM. Student’s two-tailed unpaired t tests for c and g. Two-way ANOVA for d and h. ****p < 0.0001; ns not significant. Source data are provided in the Source Data file.
Fig. 3
Fig. 3. Ablation of OT D3 neurons induces depression-like behaviors.
a Left, schematic showing the viral injection strategy. The AAV8-TurboRFP (control) or Cre-dependent AAV8-mCherry-FLEX-DTA virus (800 nl) was bilaterally injected into the OT. Compared to the control virus (middle), the DTA virus ablated OT D3 neurons as visualized by the absence of most D3-EYFP signals (right). The insets are high magnification images from the corresponding dotted rectangle areas. Confocal images were collected 4 weeks post viral injection. Scale bars = 200 μm (low magnification) and 30 μm (insets). b Experimental strategy and timeline of behavioral assays. Created with BioRender.com. ch Effects of ablation of OT D3 neurons on behavioral performance in different tests. c Open field test: total distance traveled (left; t(12) = 0.487 and p = 1.000) and time in the center zone (right; t(12) = 2.682 and p = 0.120). d Light-dark box transition test: latency to the first entry into the dark area (left; t(12) = 1.767 and p = 0.618) and time in the dark area (right; t(12) = 1.244 and p = 1.000). e Elevated zero maze test: latency to the first entry into open sections (left; t(12) = 1.860 and p = 0.528) and time in open sections (right; t(12) = 1.607 and p = 0.804). f Forced swimming test: immobility time (t(12) = 2.200 and p = 0.048). g Tail suspension test: immobility time (t(12) = 2.854 and p = 0.015). h Sucrose preference test: preference index (t(12) = 0.453 and p = 0.658). Two different cohorts of mice were used in cg and h. n = 7 mice per group. Data are expressed as mean ± SEM. Student’s two-tailed unpaired t tests. P values in c–e are adjusted by the Bonferroni correction. *p < 0.05; ns not significant. Source data are provided in the Source Data file.
Fig. 4
Fig. 4. Chemogenetic inhibition of OT D3 neurons changes affective behaviors in mice.
a Schematic showing strategy for viral injection into the OT and timeline for behavioral assays under inhibitory DREADD manipulations. Created with BioRender.com. b Ex vivo electrophysiological recordings on KORD-expressing D3 neurons. Left, representative traces showing current injection-induced firing under bath application of ACSF or SALB (in DMSO; 10 μM). Right, comparison of the firing frequency between ACSF and SALB condition (t(4) = 12.728 and p = 2.20 × 10−4). n = 5 neurons from 3 mice. ci Effects of inhibition of D3 neurons on behavioral performance in different tests. c Open field test: total distance traveled (left; t(6) = 1.816 and p = 0.714) and time in the center zone (right; t(6) = 2.955 and p = 0.150). d Light-dark box transition test: latency to the first entry into the dark area (left; t(6) = 7.773 and p = 1.43 × 10−3) and time in the dark area (right; t(6) = 4.641 and p = 0.024). e Elevated zero maze test: latency to the first entry into open sections (left; t(6) = 3.098 and p = 0.126) and time in open sections (right; t(6) = 2.511 and p = 0.276). f Forced swimming test: immobility time (t(6) = 11.978 and p = 2.05 × 10−5). g Tail suspension test: immobility time (t(6) = 10.563 and p = 4.23 × 10−5). h Sucrose preference test: preference index (t(6) = 0.722 and p = 0.497). i Total grooming time in the open field test (t(6) = 2.579 and p = 0.042). n = 7 mice per group. Two different cohorts of mice were used in cg, i and h. Data are expressed as mean ± SEM. Student’s two-tailed paired t tests. P values in ce are adjusted by the Bonferroni correction. *p < 0.05, **p < 0.01, ***p < 0.001, ****p < 0.0001; ns not significant, ACSF artificial cerebrospinal fluid solution, DREADD Designer Receptors Exclusively Activated by Designer Drugs, DMSO dimethyl sulfoxide, SALB salvinorin B. Source data are provided in the Source Data file.
Fig. 5
Fig. 5. Optogenetic activation of OT D3 neurons normalizes CRS-induced depression-like behaviors.
a D3 neurons reliably fire action potentials upon blue light stimulation. Top: individual islands of Calleja (IC) in the OT (left) and enlarged view of the dashed area showing tightly packed D3-Cre/ChR2-EYFP neurons in IC (right). Scale bars: 200 μm (left) and 20 μm (right). Bottom: a D3-Cre/ChR2 neuron fires reliably upon blue light stimulation at 20 Hz (473 nm; 10 ms pulse). b Experimental strategy and timeline of behavioral assays. Created with BioRender.com. ch Effects of blue light activation of D3 neurons on behavioral performance of CRS mice in different tests compared to green light stimulation. c Open field test: total distance traveled (left; t(12) = 0.220 and p = 1.000) and time in the center zone (right; two-sided Mann–Whitney test; p = 1.000). d Light-dark box transition test: latency to the first entry into the dark area (left; t(12) = 2.197 and p = 0.180) and time in the dark area (right; t(12) = 0.616 and p = 1.000). e Elevated zero maze test: latency to the first entry into open sections (left; two-sided Mann–Whitney test; p = 0.096) and time in open sections (right; t(12) = 0.713 and p = 1.000). f Forced swimming test: immobility time (t(12) = 12.908 and p = 2.14× 10−8). g Tail suspension test: immobility time (t(12) = 7.278 and p = 9.78× 10−6). h Sucrose preference test: preference index (t(12) = 1.904 and p = 0.081). n = 7 mice per group. Two different cohorts of mice were used in c–g and h. Data are expressed as mean ± SEM. Student’s two-tailed unpaired t tests. P values in ce are adjusted by the Bonferroni correction. ****p < 0.0001; ns not significant. Source data are provided in the Source Data file.
Fig. 6
Fig. 6. Chemogenetic activation of OT D3 neurons normalizes CRS-induced depression-like behaviors.
a Schematic showing strategy for viral injection into the OT and timeline for behavioral assays under excitatory DREADD manipulations. Created with BioRender.com. b Patch clamp recordings on hM3D(Gq)-expressing D3 neurons. Left, representative traces showing current injection-induced firing under bath application of ACSF or CNO (10 μM). Right, comparison of the firing frequency between ACSF and CNO condition (t(4) = 11.442 and p = 3.33 × 10−4). n = 5 neurons from 3 mice. ci Effects of chemogenetic activation of D3 neurons on behavioral performance in different tests. c Open field test: total distance traveled (left; t(6) = 0.816 and p = 1.000) and time in the center zone (right; p = 1.000). d Light-dark box transition test: latency to the first entry into the dark area (left; p = 1.000) and time in the dark area (right; t(6) = 1.815 and p = 0.720). e Elevated zero maze test: latency to the first entry into open sections (left; t(6) = 1.943 and p = 0.600) and time in open sections (right; t(6) = 1.113 and p = 1.000). f Forced swimming test: immobility time (t(6) = 5.739 and p = 0.0012). g Tail suspension test: immobility time (t(6) = 5.623 and p = 0.0014). h Sucrose preference test: preference index (t(6) = 0.722 and p = 0.497). i Total grooming time in the open field test (p = 0.016). n = 7 mice per group. Two different cohorts of mice were used in cg, i and h. Student’s two-tailed paired t tests for b, total distance in c, time in d, and e–h. Two-sided Wilcoxon matched-pairs signed rank test for time in c, latency in d, and i. Data are expressed as mean ± SEM. P values in ce are adjusted by the Bonferroni correction. *p < 0.05, **p < 0.01, ***p < 0.001; ns not significant. ACSF artificial cerebrospinal fluid solution, DREADD Designer Receptors Exclusively Activated by Designer Drugs; CNO Clozapine N-oxide. Source data are provided in the Source Data file.
Fig. 7
Fig. 7. Optogenetic activation of OT D3 neurons induces conditioned place preference (CPP).
a Behavioral tracks of D3-Cre (control) and D3-Cre/ChR2 mice during the pre-conditioning (day 1) and post-conditioning (day 4) sessions. Blue laser stimulation (day 2 and 3) was paired with the least preferred chamber determined in the pre-conditioning session. b The CPP difference score. D3-Cre control mice showed no significant difference between the laser-paired and non-laser-paired chamber (t(7) = 0.470 and p = 0.653). D3-Cre/ChR2 mice had a significantly higher CPP score in the laser-paired than the non-laser-paired chamber (t(7) = 10.031 and p = 2.10 × 10−5). c Time spent in each compartment. For D3-Cre control mice, no difference between pre- and post-conditioning sessions (laser-paired: t(7) = 0.472 and p = 0.651; connecting: t(7) = 0.527 and p = 0.614; non-laser-paired: t(7) = 0.714 and p = 0.499). D3-Cre/ChR2 mice spent more time in the laser-paired chamber and less time in the non-laser-paired chamber side without change in the connecting zone after conditioning (laser-paired: t(7) = 5.533 and p = 8.75× 10−4; connecting: t(7) = 0.407 and p = 0.696; non-laser-paired: t(7) = 2.980 and p = 0.021). d The CPP difference score in the laser-paired or non-laser-paired chamber from mice wearing collar (grooming blocked). Both mouse lines showed no significant difference (D3-Cre: t(6) = 0.120 and p = 0.908; D3-Cre/ChR2: t(6) = 1.781 and p = 0.125). e Time spent in each compartment from mice wearing collar (grooming blocked). No significant difference between pre- and post-conditioning session. D3-Cre mice: laser-paired: t(6) = 0.384 and p = 0.706; connecting: t(6) = 0.413 and p = 0.687; non-laser paired: t(6) = 0.270 and p = 0.792. D3-Cre/ChR2 mice: laser paired: t(6) = 1.422 and p = 0.181; connecting: t(6) = 1.595 and p = 0.137; non-laser paired: t(6) = 1.898 and p = 0.082. n = 8 mice per group in b and c, n = 7 mice per group in d and e. Data are expressed as mean ± SEM. Student’s two-tailed paired t tests. *p < 0.05, ***p < 0.001; ns, not significant. Source data are provided in the Source Data file.
Fig. 8
Fig. 8. OT SPNs make direct inhibitory synaptic connections with NAc-projecting VTA dopamine neurons.
a A model on how OT D3 neurons bidirectionally mediate affective behaviors in mice. Left, ablation or inhibition of OT D3 neurons disinhibits OT SPNs which in turn inhibit VTA dopamine neurons, reducing dopamine release to NAc. Right, activation of OT D3 neurons inhibits OT SPNs which in turn disinhibit VTA dopamine neurons, enhancing dopamine release to NAc. b Strategy for viral injection and retrograde tracing. AAV1 carrying ChR2-EYFP and cholera toxin subunit B were bilaterally injected into the OT and NAc, respectively, in D1-Cre mice (n = 5). c Confocal images showing ChR2-EYFP+ OT D1-SPNs (left) and CTB+ NAc neurons (right). Scale bar = 200 μm (left) and 50 μm (right). d Confocal image showing CTB+ and tyrosine hydroxylase (TH)+ neurons surrounded with ChR2-EYFP+ D1-SPN axonal fibers in VTA (left). High magnification images (right) showing two CTB and TH double positive neurons from the dashed rectangle in the left panel. Scale bar = 50 μm (left) and 20 μm (right). e D1-SPNs inhibit VTA neurons. Repeated 10 ms blue laser pulses (0.1 Hz) evoked IPSCs in 71.7% (inset) of VTA neurons recorded. f Light evoked IPSCs in VTA neurons were not changed by glutamate receptor antagonists (50 µM AP5 and 20 µM CNQX) but blocked by GABAA receptor antagonist bicuculline (10 µM). Left, representative traces. Right, quantification of IPSC amplitudes. One-way ANOVA; F(3,16) = 18.517 and p = 2.65 × 10−5 (ACSF vs. AP5 + CNQX + bicuculline: p = 7.35 × 10−6; ACSF vs. AP5 + CNQX: p = 0.378; ACSF vs. wash out: p = 0.371; AP5 + CNQX vs. AP5 + CNQX + bicuculline: p = 3.69 × 10−5; AP5 + CNQX vs. wash out: p = 0.948; AP5 + CNQX + bicuculline vs. wash out: p = 7.72 × 10−5). n = 5 neurons. ****p < 0.0001. g Left, representative traces of dopamine (DA) and GABA neurons. Right, pie chart showing the composition of recorded VTA neurons. Baseline membrane potential was kept at −60 mV. Data are expressed as mean ± SEM. Source data are provided in the Source Data file.

References

    1. Fox ME, Lobo MK. The molecular and cellular mechanisms of depression: a focus on reward circuitry. Mol. Psychiatry. 2019;24:1798–1815. doi: 10.1038/s41380-019-0415-3. - DOI - PMC - PubMed
    1. Francis TC, Lobo MK. Emerging role for nucleus accumbens medium spiny neuron subtypes in depression. Biol. Psychiatry. 2017;81:645–653. doi: 10.1016/j.biopsych.2016.09.007. - DOI - PMC - PubMed
    1. Heshmati M, Russo SJ. Anhedonia and the brain reward circuitry in depression. Curr. Behav. Neurosci. Rep. 2015;2:146–153. doi: 10.1007/s40473-015-0044-3. - DOI - PMC - PubMed
    1. Malone DA, Jr, et al. Deep brain stimulation of the ventral capsule/ventral striatum for treatment-resistant depression. Biol. Psychiatry. 2009;65:267–275. doi: 10.1016/j.biopsych.2008.08.029. - DOI - PMC - PubMed
    1. Hou Z, et al. Increased temporal variability of striatum region facilitating the early antidepressant response in patients with major depressive disorder. Progr. Neuro Psychopharmacol. Biol. Psychiatry. 2018;85:39–45. doi: 10.1016/j.pnpbp.2018.03.026. - DOI - PubMed

Publication types

LinkOut - more resources