. 2023 Oct 28;14(1):6890.
doi: 10.1038/s41467-023-42653-0.

The chromatin network helps prevent cancer-associated mutagenesis at transcription-replication conflicts

Affiliations

The chromatin network helps prevent cancer-associated mutagenesis at transcription-replication conflicts

Aleix Bayona-Feliu et al. Nat Commun. .

Abstract

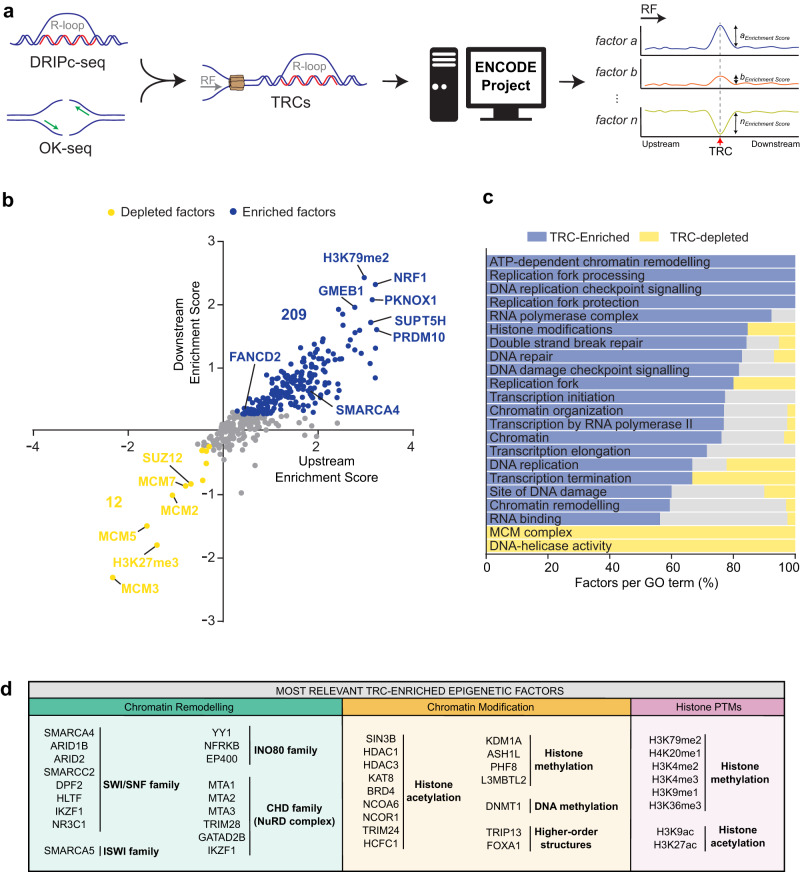
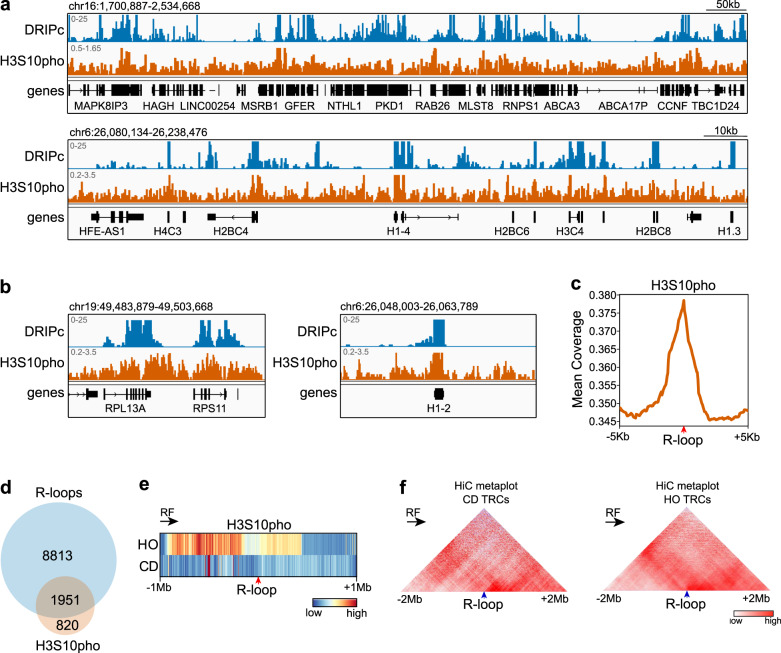
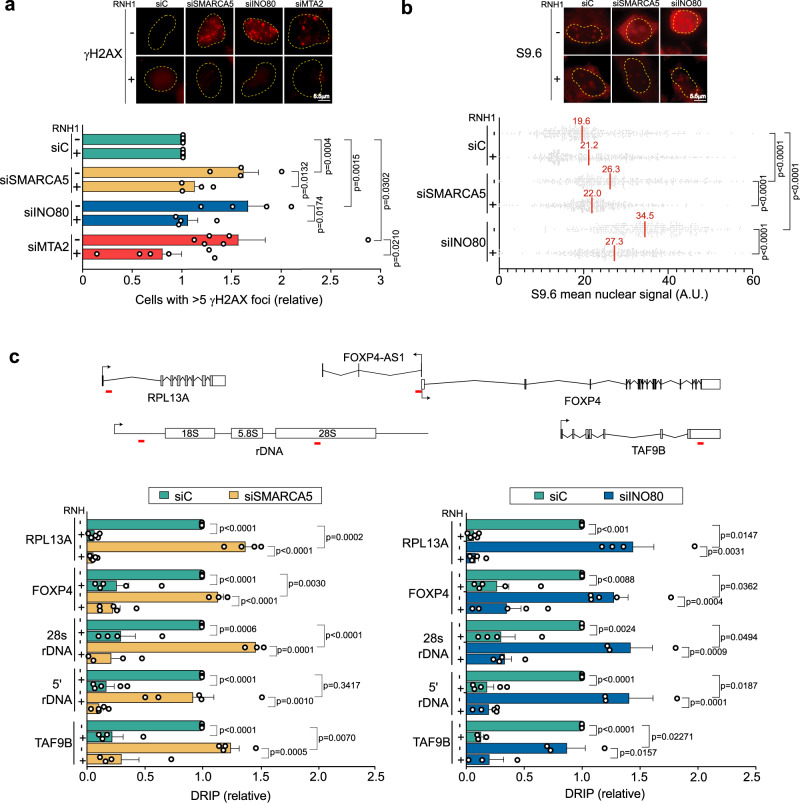
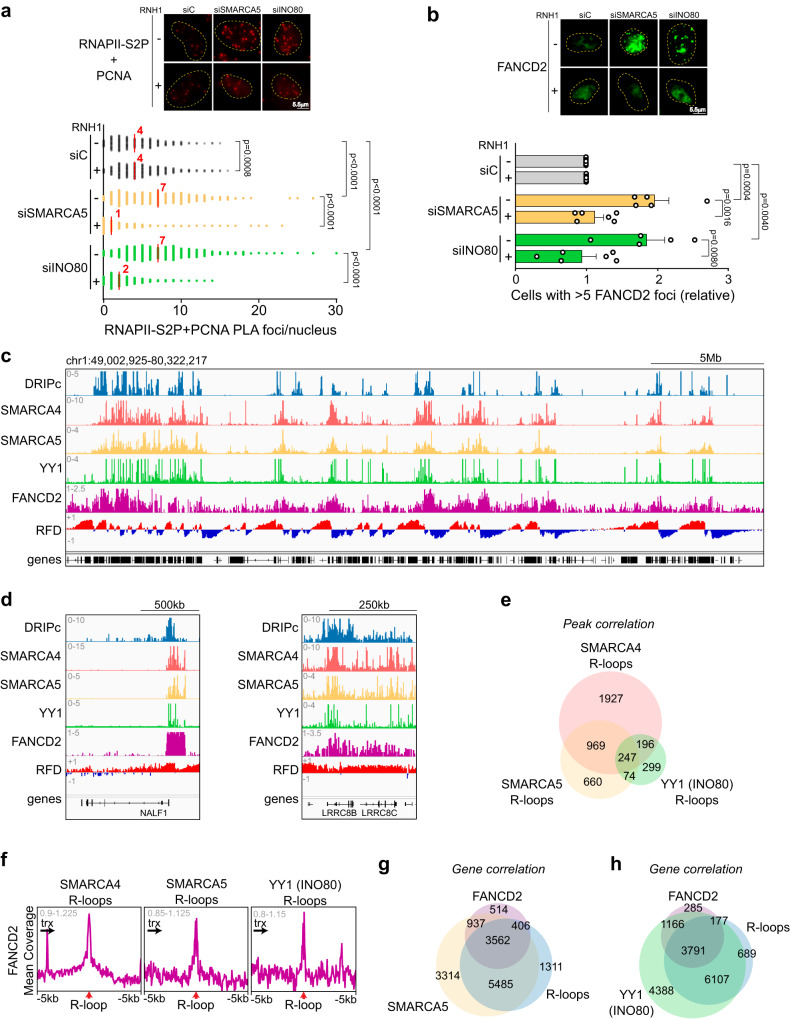
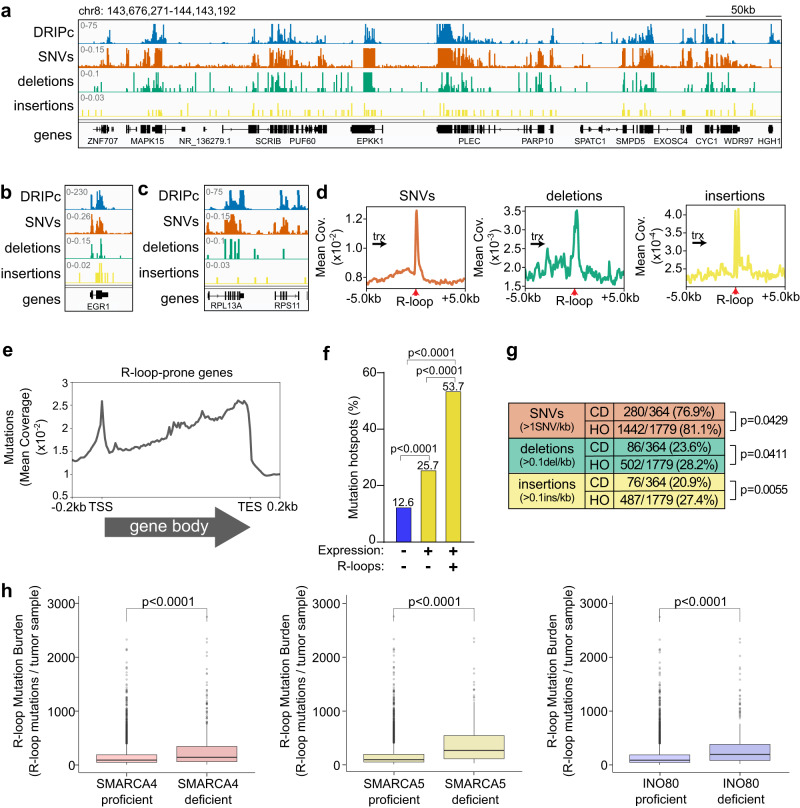
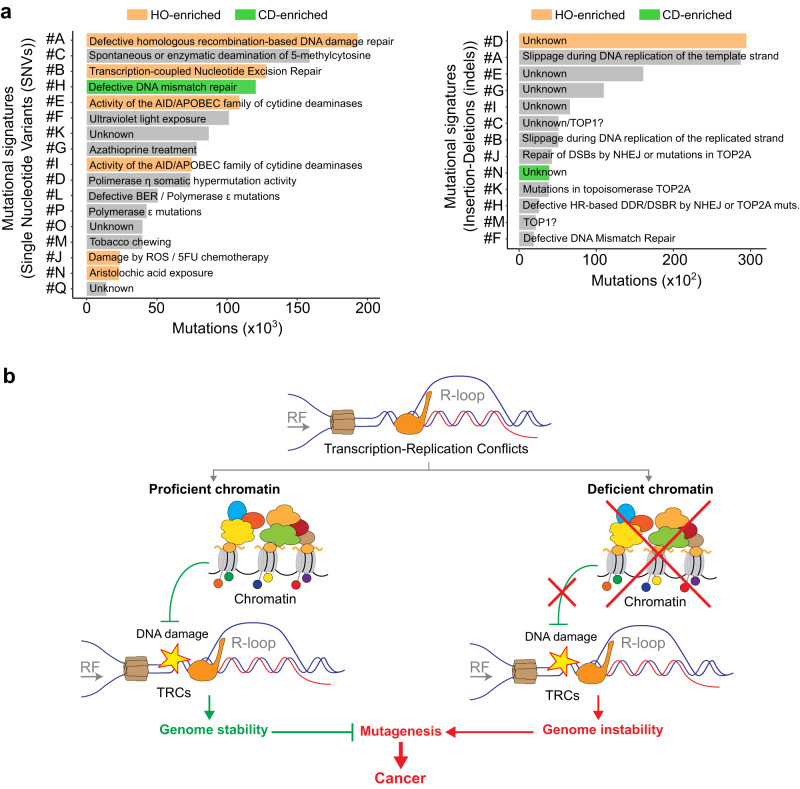
Genome instability is a feature of cancer cells, transcription being an important source of DNA damage. This is in large part associated with R-loops, which hamper replication, especially at head-on transcription-replication conflicts (TRCs). Here we show that TRCs trigger a DNA Damage Response (DDR) involving the chromatin network to prevent genome instability. Depletion of the key chromatin factors INO80, SMARCA5 and MTA2 results in TRCs, fork stalling and R-loop-mediated DNA damage which mostly accumulates at S/G2, while histone H3 Ser10 phosphorylation, a mark of chromatin compaction, is enriched at TRCs. Strikingly, TRC regions show increased mutagenesis in cancer cells with signatures of homologous recombination deficiency, transcription-coupled nucleotide excision repair (TC-NER) and of the AID/APOBEC cytidine deaminases, being predominant at head-on collisions. Thus, our results support that the chromatin network prevents R-loops and TRCs from genomic instability and mutagenic signatures frequently associated with cancer.


Conflict of interest statement

The authors declare no competing interests.

Figures

Fig. 1
Fig. 1. Factors enriched and depleted at transcription-replication conflicts (TRCs).
a Schematic summary of the ChIP-seq data downstream processing for enrichment/depletion analysis at TRCs. b Scatter plot indicating the fold change in content for each factor when comparing the TRC site versus its upstream and downstream sequences. c Percentage of factors enriched and depleted at TRCs for each of the GO categories analyzed. d Schematic chart with the most relevant chromatin factors found enriched at TRCs. Bold text is used to highlight gene subcategories. TRC transcription-replication conflict, RF replication fork. The arrow under RF indicate replication fork directionality. Source data are provided as a Source data file. See also Supplementary Figs. 1 and 2.
Fig. 2
Fig. 2. Evaluation of H3S10pho signal over TRCs.
a Representative screenshot of a genome region showing co-localization of R-loops (blue) and H3S10pho (orange). b Examples of two R-loop-prone genes (RPL13A and H1-2) showing co-localization with H3S10pho. c Metapeak analysis. H3S10pho mean coverage around +/−5 kb of R-loop peaks. d Venn diagram showing co-occurrence of R-loop-prone genes (DRIPc; blue) and H3S10pho (orange) mark in control K562 cells. e Metanalysis at megabase scale. H3S10pho mean coverage around +/−1 Mb of head-on and co-directional R-loop peaks. Replication fork directionality is indicated. f Analysis of chromatin interactions around TRCs. Replication fork directionality is indicated. TRC transcription-replication conflict, HO head-on, CD co-directional, RF replication fork. Arrows under RF indicate replication fork directionality.
Fig. 3
Fig. 3. Assessment of DNA damage in siSMARCA5, siINO80, and siMTA2 cells.
a Percentage of cells with >5 γH2AX foci in control (siC) and SMARCA5, INO80, MTA2-depleted cells that overexpress (+) or not (−) RNH1. Data expressed as relative to siC. Mean + SEM are plotted (n = 4 (siSMARCA5 and siINO80) and n = 6 (siC and siMTA2) independent experiments). (Unpaired Student’s t test, one-tailed). b Quantification of nuclear S9.6 mean signal intensity in siSMARCA5 and siINO80 cells treated as in (a). Data presented as scatter plot (n > 100 cells examined over 3 independent experiments). Median values are indicated. (Mann–Whitney U-test, two-tailed). c DRIP-qPCR analysis of RNAPII (RPL13A, FOXP4, TAF9B) and RNAPI-transcribed genes (5’ and 28S rDNA) of siC, siSMARCA5 (left) and siINO80 (right) cells. Signal values normalized with respect to the siC control and plotted as mean ± SEM (n = 5 (RPL13A, FOXP4 and 5’ rDNA) and n = 4 (TAF9B and 28S rDNA) independent experiments). (Unpaired Student’s t test, one-tailed). Representative images, with nuclear perimeter highlighted (yellow dashed line), are shown. Gene regions amplified by qPCR in DRIP-qPCR experiments are indicated with a red line on drawings of the genes tested. Scale bars and p values are indicated. Source data are provided as a Source data file. See also Supplementary Fig. 3.
Fig. 4
Fig. 4. Analysis of DNA damage along the cell cycle in siINO80 and siSMARCA5 cells.
a Quantification of RNAPII-S2P + PCNA PLA (TRCs) foci in control (siC), siSMARCA5 and siINO80 cells. Data presented as scatter plot (n > 50 cells examined over 3 independent experiments). Median values are indicated. (Mann-Whitney U test, two-tailed). b Percentage of cells with more than 5 FANCD2 foci in siC, siSMARCA5 and siINO80 cells that overexpress (+) or not (−) RNH1. Data expressed as relative to siC. Mean + SEM are plotted (n = 5 (RNH1−) and n = 6 (RNH1+) independent experiments). (Unpaired Student’s t test, one-tailed). c Representative screenshot of a genome region showing co-localization of R-loops (DRIPc; light blue), SMARCA5 (yellow), YY1 (INO80; green), SMARCA4 (red) and FANCD2 (purple) at sites with high R-loop abundance. Replication fork directionality (RFD) is also shown. d Zoomed-in examples of R-loops (DRIPc; light blue), SMARCA5 (yellow), YY1 (INO80; green), SMARCA4 (red) and FANCD2 (purple) colocalization. e Venn diagram showing correlation between SMARCA4 (red), SMARCA5 (yellow) and YY1 (INO80; green) peaks colocalizing with R-loops. f Metapeak analysis of FANCD2 at R-loops colocalizing with SMARCA4, SMARCA5 or YY1. Transcription direction is indicated. g Venn diagram showing R-loop (DRIPc; light blue), FANCD2 (purple) and SMARCA5 (yellow) genome-wide co-occurrence in control K562 cells. h Venn diagram showing R-loop (DRIPc; light blue), FANCD2 (purple) and YY1 (INO80; green) genome-wide co-occurrence in control K562 cells. Representative images, with nuclear perimeter highlighted (yellow dashed line), are shown. Scale bars and p values are indicated. RFD replication fork directionality, trx transcription. Arrows under trx indicate transcription direction. Source data are provided as a Source data file. See also Supplementary Fig. 4.
Fig. 5
Fig. 5. Analysis of the mutational landscape at TRCs in cancer.
a Representative screenshot of a genome region showing co-localization of R-loops (DRIPc; blue) with SNVs (orange), deletions (green) and insertions (yellow). b Example of an R-loop-prone gene (EGR1) showing co-localization with SNVs (orange), deletions (green) and insertions (yellow). c Example of an R-loop-prone gene (RPL13A) showing co-localization with SNVs (orange), deletions (green) and insertions (yellow). d Mutation metanalysis. Mean coverage of SNVs (orange), deletions (green) and insertions (yellow) around +/− 5 kb of R-loop peaks. Transcription direction is indicated. e Metagene analysis of mutations over R-loop-prone genes. The arrow below the graph indicates transcription direction. f Percentage of mutation hotspots in cancer colocalizing with R-loop-prone genes, expressed genes reluctant to R-loop formation and silenced genes. (Chi-square with Yates’ correction test, two-tailed). g Quantification of the number of sites with >1SNV/kb, >0.1 deletions/kb and >0.1 insertions/kb at head-on and co-directional TRCs. (Fisher’s exact test, one-tailed). h Comparison of R-loop mutation burden between tumor samples proficient and deficient in SMARCA4 (left panel), SMARCA5 (middle panel) and INO80 (right panel). Data presented as box plot. The lower and upper hinges of the box plots correspond to the first and third quartiles (the 25th and 75th percentiles), while the upper and lower whiskers extend from the hinge to the largest and smaller value no further than 1.5× inter-quartile range, respectively. Data beyond the end of the whiskers are considered outliers and plotted individually. n = 9046 biologically independent tumors sorted according to gene status. (Wilcoxon test, two-tailed). Scales and p values are indicated. SNV single-nucleotide variant, HO head-on, CD co-directional, trx transcription. Arrows under trx indicate transcription direction. Source data are provided as a Source data file. See also Supplementary Fig. 5.
Fig. 6
Fig. 6. Study of the R-loop-associated mutational signatures.
a Quantification of Single Nucleotide Variants (SNVs; left) and insertion–deletions (indels; right) associated to R-loops corresponding to each of the mutational signatures. Head-on enriched signatures are highlighted in orange, and co-directional enriched in green. b Model. Schematic representation highlighting that a proficient chromatin is required for a proper response to transcription-replication conflicts. Under chromatin-deficient scenarios, transcription-replication conflicts pose a source of DNA damage and hot-spot for mutagenesis that might predispose cells to transformation or help them surpass biological barriers during cancer development. SNV single-nucleotide variant, indel insertion–deletion, HO head-on, CD co-directional, RF replication fork. Arrows under RF indicate replication fork directionality. See also Supplementary Figs. 6–11.

References

    1. Negrini S, Gorgoulis VG, Halazonetis TD. Genomic instability an evolving hallmark of cancer. Nat. Rev. Mol. Cell Biol. 2010;11:220–228. doi: 10.1038/nrm2858. - DOI - PubMed
    1. Papamichos-Chronakis M, Peterson CL. Chromatin and the genome integrity network. Nat. Rev. Genet. 2013;14:62–75. doi: 10.1038/nrg3345. - DOI - PMC - PubMed
    1. Morgan MA, Shilatifard A. Chromatin signatures of cancer. Genes Dev. 2015;29:238–249. doi: 10.1101/gad.255182.114. - DOI - PMC - PubMed
    1. Gómez-González, B. & Aguilera, A. Transcription-mediated replication hindrance: a major driver of genome instability. Genes Dev.10.1101/gad.324517.119 (2019). - PMC - PubMed
    1. Gómez-González B, et al. Genome-wide function of THO/TREX in active genes prevents R-loop-dependent replication obstacles. EMBO J. 2011;30:3106–3119. doi: 10.1038/emboj.2011.206. - DOI - PMC - PubMed

Publication types