. 2023 Oct;11(10):e007156.
doi: 10.1136/jitc-2023-007156.

Patient-derived lymphoma spheroids integrating immune tumor microenvironment as preclinical follicular lymphoma models for personalized medicine

Affiliations

Patient-derived lymphoma spheroids integrating immune tumor microenvironment as preclinical follicular lymphoma models for personalized medicine

Carla Faria et al. J Immunother Cancer. 2023 Oct.

Abstract

Background: Follicular lymphoma (FL), the most common indolent non-Hodgkin's Lymphoma, is a heterogeneous disease and a paradigm of the contribution of immune tumor microenvironment to disease onset, progression, and therapy resistance. Patient-derived models are scarce and fail to reproduce immune phenotypes and therapeutic responses.

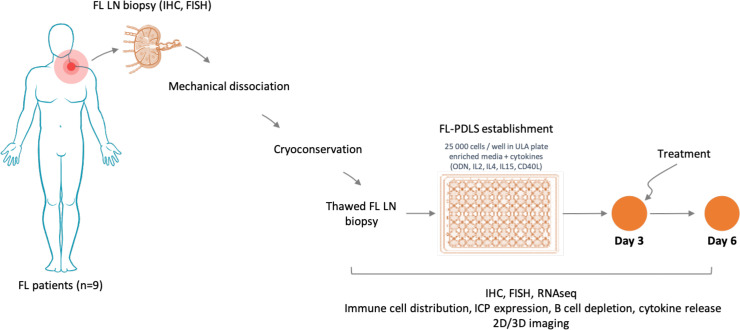
Methods: To capture disease heterogeneity and microenvironment cues, we developed a patient-derived lymphoma spheroid (FL-PDLS) model culturing FL cells from lymph nodes (LN) with an optimized cytokine cocktail that mimics LN stimuli and maintains tumor cell viability.

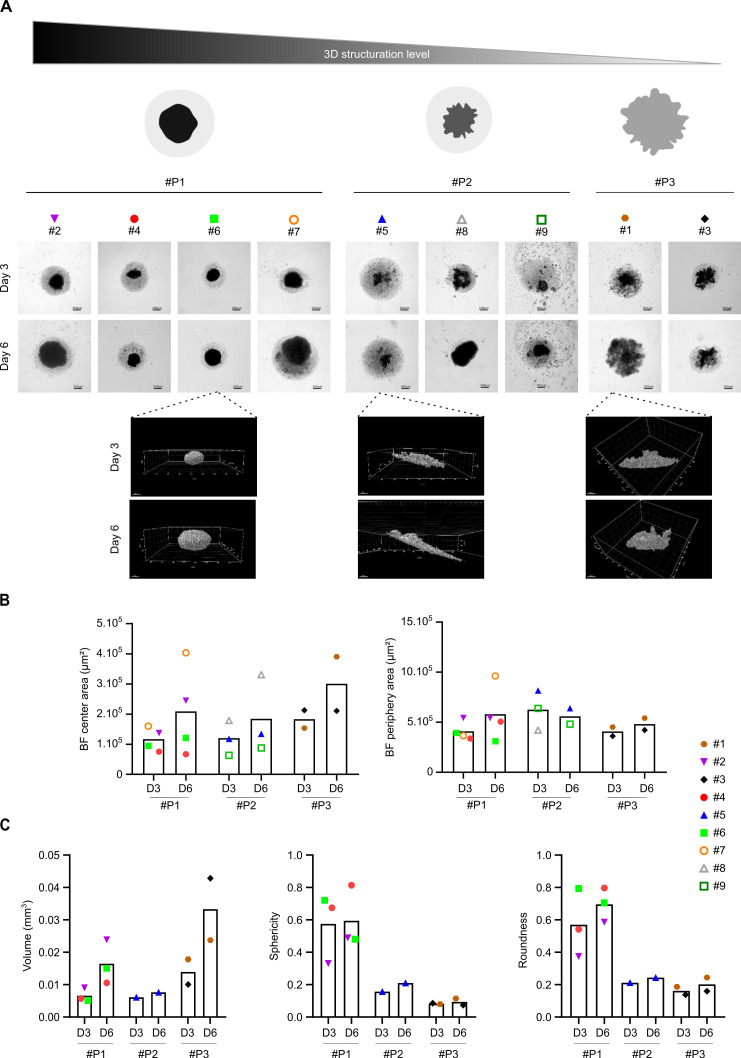
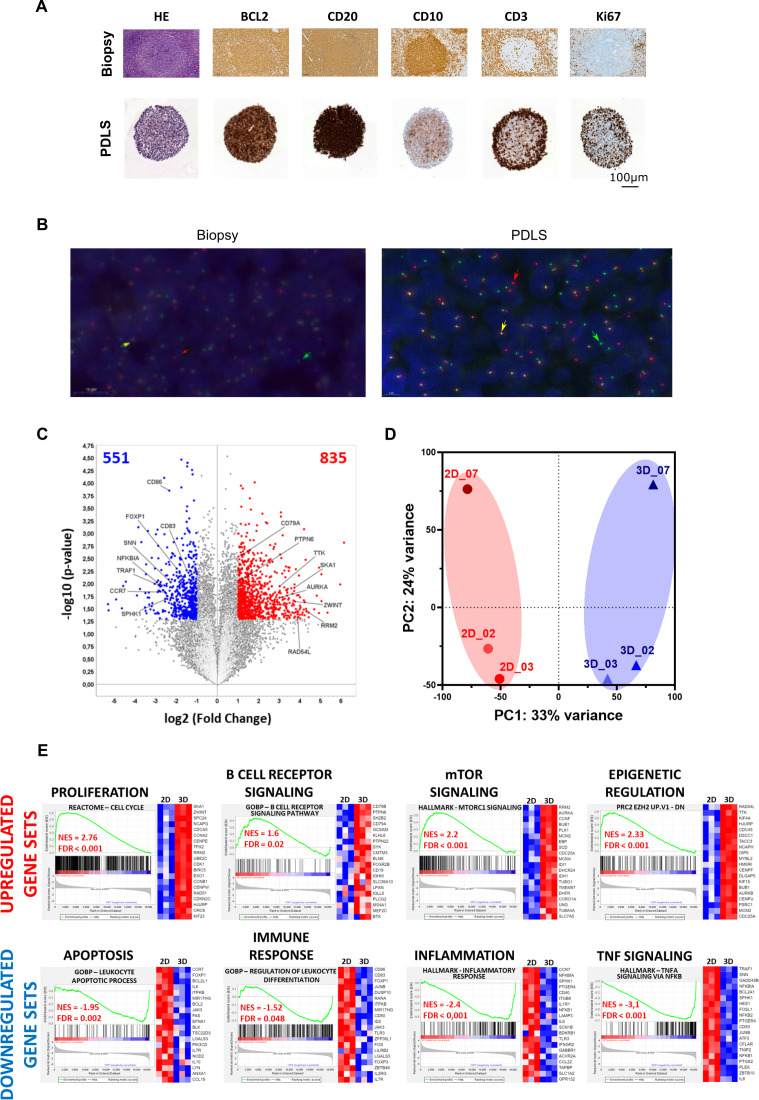
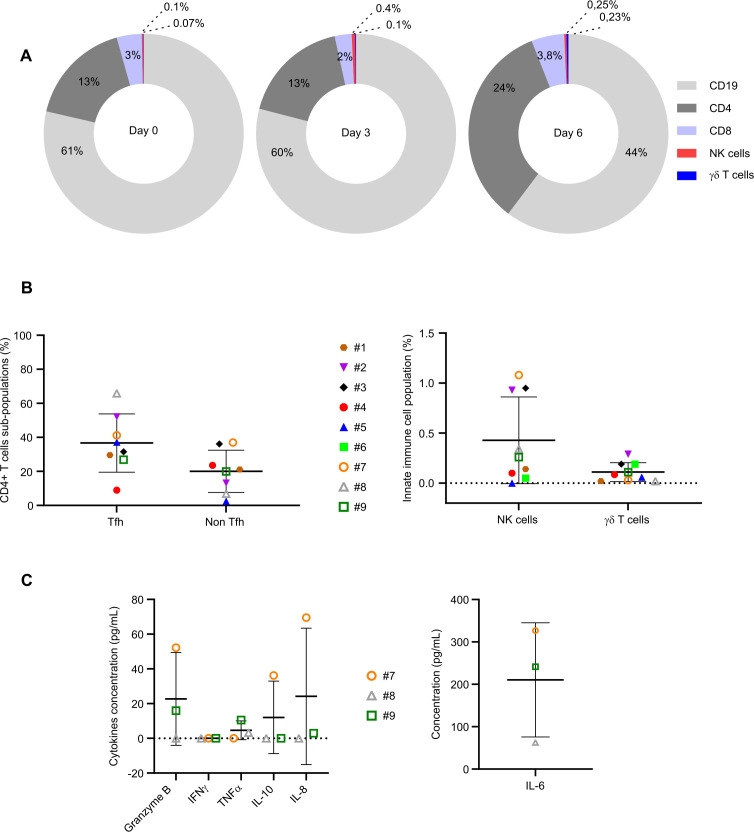
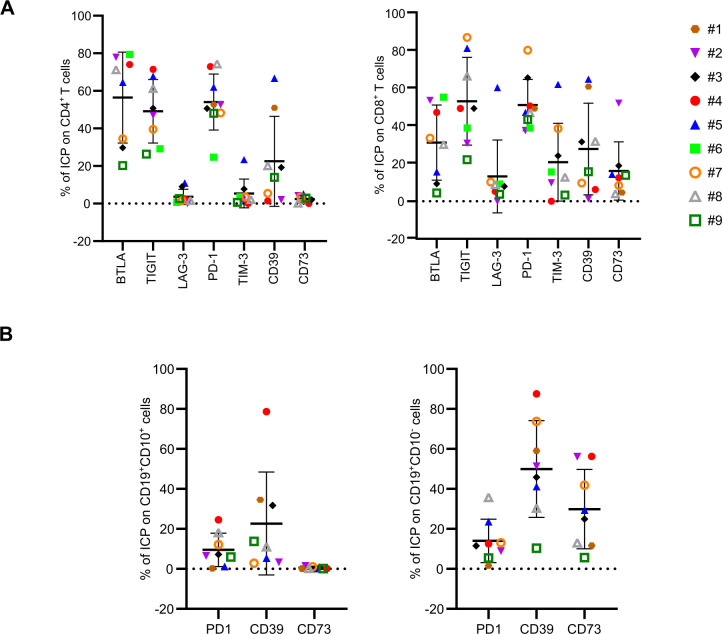
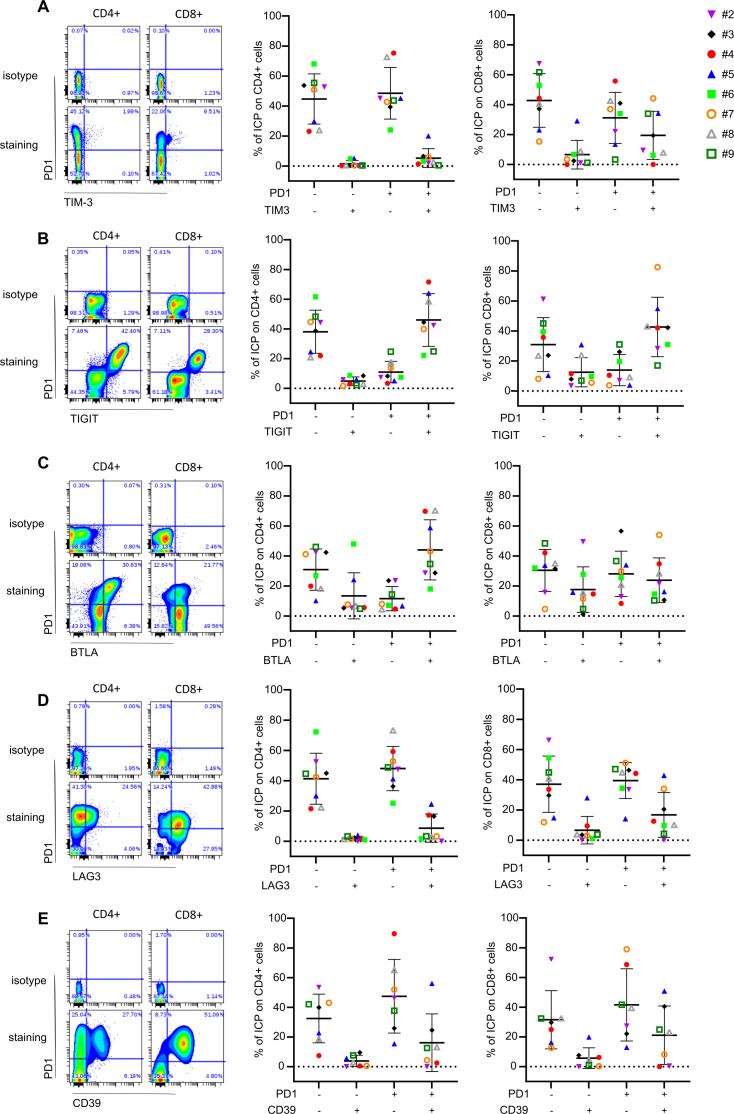
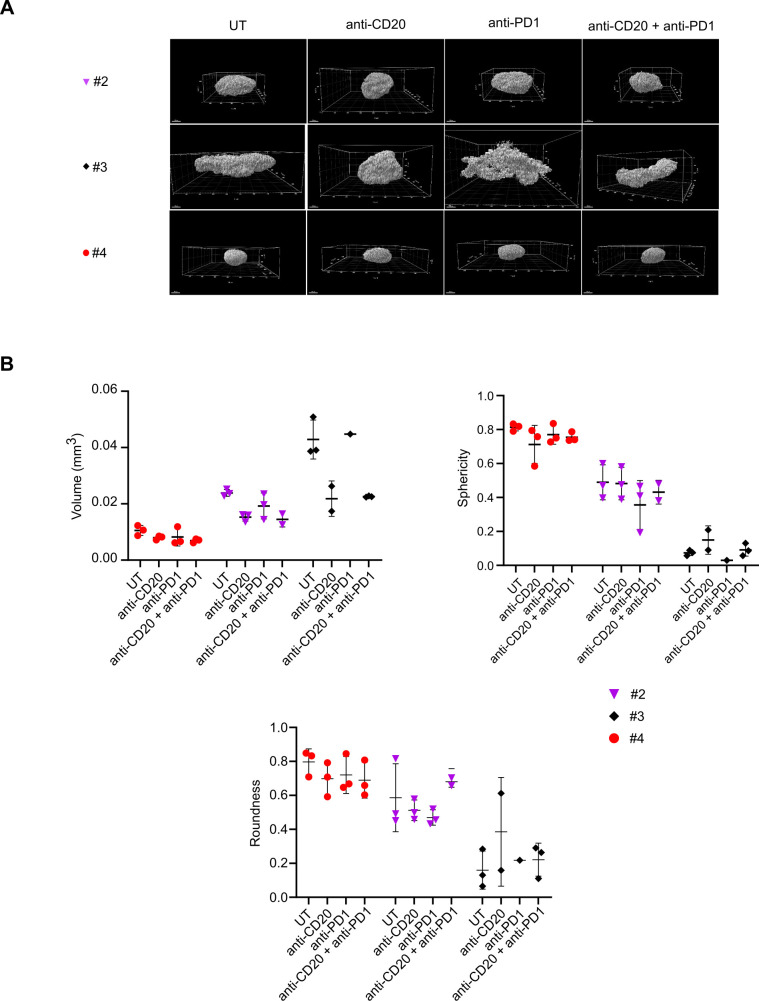
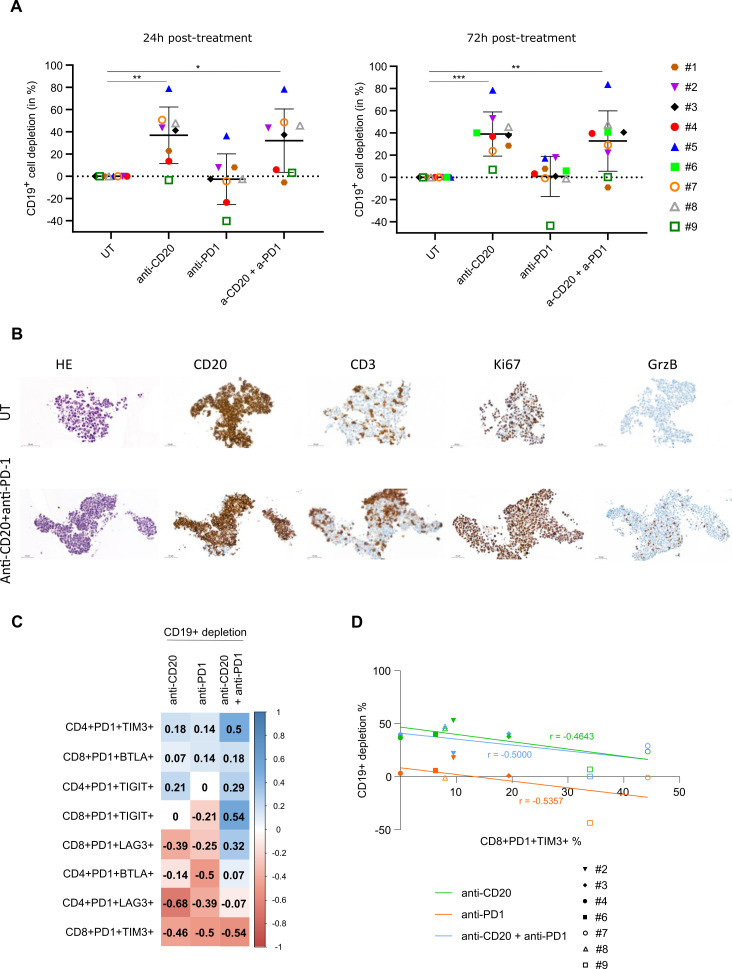
Results: FL-PDLS, mainly composed of tumor B cells (60% on average) and autologous T cells (13% CD4 and 3% CD8 on average, respectively), rapidly organizes into patient-specific three-dimensional (3D) structures of three different morphotypes according to 3D imaging analysis. RNAseq analysis indicates that FL-PDLS reproduces FL hallmarks with the overexpression of cell cycle, BCR, or mTOR signaling related gene sets. FL-PDLS also recapitulates the exhausted immune phenotype typical of FL-LN, including expression of BTLA, TIGIT, PD-1, TIM-3, CD39 and CD73 on CD3+ T cells. These features render FL-PDLS an amenable system for immunotherapy testing. With this aim, we demonstrate that the combination of obinutuzumab (anti-CD20) and nivolumab (anti-PD1) reduces tumor load in a significant proportion of FL-PDLS. Interestingly, B cell depletion inversely correlates with the percentage of CD8+ cells positive for PD-1 and TIM-3.

Conclusions: In summary, FL-PDLS is a robust patient-derived 3D system that can be used as a tool to mimic FL pathology and to test novel immunotherapeutic approaches in a context of personalized medicine.

Keywords: Hematologic Neoplasms; Immune Checkpoint Inhibitors; Immunotherapy; Tumor Microenvironment.


Conflict of interest statement

Competing interests: RM and J-ML are employees of Imactiv3D.

Figures

Figure 1
Figure 1
Workflow for PDLS establishment and characterization. 2D, two-dimensional; 3D, three-dimensional; FISH, fluorescence in situ hybridization; FL, follicular lymphoma; IHC, immunohistochemistry; ICP, immune checkpoint; ODN, oligodeoxynucleotide; PDLS, patient-derived lymphoma spheroid; ULA, ultra-low attachment.
Figure 2
Figure 2
FL-PDLS characterization by 2D and 3D imaging. (A) Global morphology observed by brightfield (Operetta, 5X, scale: 200 µm) of FL-PDLS from nine patients or by confocal microscopy (×10) for patients #1, #5, and #6 in untreated condition at D3 and D6. #P represents patterns based on the morphology. (B) Histograms representing center/core and periphery areas (µm2) measured after 2D imaging with Columbus software and (C) volume (mm3), sphericity and roundness quantification after 3D imaging for all patients clustered according to their morphotypes (patterns, #P). 2D, two-dimensional; 3D, three-dimensional; FL-PDLS, follicular lymphoma-patient-derived lymphoma spheroid.
Figure 3
Figure 3
Global FL-PDLS characterization by different approaches. (A) Representative IHC on sliced FL (LN biopsy and PDLS at day 3 of culture from patient #4). (B) Representative FISH on sliced FL-PDLS #4. (C) Volcano plot of differentially expressed genes (DEG) contrasting 3D–2D models. After application of thresholds, 835 genes were found upexpressed (red genes) and 551 downexpressed (blue genes), respectively. Top modulated genes are indicated. (D) PCA analysis using expression values obtained from RNA-seq data in 3D and 2D models. (E) Gene set enrichment analysis. Most significant upregulated and downregulated gene sets filtered by FDR<0.05 and NES>1.5 or <−1.5. Heatmaps correspond to top 20 genes. 2D, two-dimensional; 3D, three-dimensional; FDR, false discovery rate; FISH, fluorescence in situ hybridization; FL-PDLS, follicular lymphoma-patient-derived lymphoma spheroid; NES, Normalized Enrichment Score; PCA, principal component analysis.
Figure 4
Figure 4
Immune cell distribution and cytokine release. (A) Percentage of immune cells evaluated by flow cytometry at day 0, day 3 and day 6 of 3D culture. (B) Percentage of TFh (CD3+CD4+CXCR5+ICOS+), non-TFh (CD3+CD4+CXCR5ICOS), NK (CD3-CD56+) and gamma delta T cells (CD3+TCRgamma9+) in FL-PDLS at day 3 evaluated by flow cytometry. (C) Cytokine release (granzyme B, IFNγ, TNFα, IL-10, IL-8, IL-6) was evaluated by flow cytometry at day 6 of culture. 3D, three-dimensional; FL-PDLS, follicular lymphoma-patient-derived lymphoma spheroid.
Figure 5
Figure 5
FL-PDLS immune checkpoint characterization. 10 FL-PDLS from nine different FL patients at day 3 of culture were pooled and the percentage of ICP was analyzed by flow cytometry. (A) Percentage of BTLA, TIGIT, LAG-3, PD-1, TIM-3, CD39, CD73 on CD4+ and CD8+ T cells. (B) Percentage of PD-1, CD39, CD73 on tumorous cells (CD10+CD19+) and healthy B cells (CD10CD19+). FL-PDLS, follicular lymphoma-patient-derived lymphoma spheroid; ICP, immune checkpoint.
Figure 6
Figure 6
ICP coexpression in CD4+ and CD8+ T cells from FL-PDLS. Ten FL-PDLS from eight different FL patients at day 3 of culture were pooled and the percentage of ICP was analyzed by flow cytometry. Left panels represent gating strategies. Right panels represent percentage of CD4+ and CD8+ T cells expressing double ICP. PD-1/TIM-3 (A), PD-1/TIGIT (B), PD-1/BTLA (C), PD-1/LAG-3 (D) an PD-1/CD39 (E). FL-PDLS, follicular lymphoma-patient-derived lymphoma spheroid; ICP, immune checkpoint.
Figure 7
Figure 7
Drug effect on FL-PDLS 3D morphology and volume. (A) 3D reconstruction by IMARIS from 880 confocal acquisitions at ×10 magnification of FL-PDLS labeled with PI and cleared by BABB for patients #2, #3 and #4 at D6 in untreated and treated conditions. (B) Volume and morphology 3D quantification. Based on 3D acquisitions (A), volume (mm3), roundness and sphericity were calculated for each patient and each condition and represented as graphs. Mean±SD of up to three replicates per condition. 3D, three-dimensional; BABB, methanol-benzyl alcohol/benzyl benzoate; FL-PDLS, follicular lymphoma-patient-derived lymphoma spheroid; PI, propidium iodide.
Figure 8
Figure 8
B cell depletion and T cell activation on anti-CD20 and anti-PD-1 mAb treatments. (A) Percentage of depletion of CD19+ B cells at 24 hours and 72 hours post-treatments (10 FL-PDLSs were pooled from 6 to 9 different FL patients after treatment with anti-CD20 (GA101, 10 µg/mL) and/or anti-PD-1 (10 µg/mL). (B) Representative IHC of sliced PDLS (patient #3) treated by anti-CD20 (GA101, 10 µg/mL) and anti-PD-1 (10 µg/mL) or not during 72 hours. (C) Values from FL-PDLS (seven different FL patients) gathered for all the parameters listed: percentage of PD-1+/TIM3+, PD-1+/BTLA+, PD-1+/TIGIT+, PD-1+/LAG3+ CD4+ and CD8+ cells and percentage of B cell depletion (normalized by untreated condition) after 72 hours of treatment by anti-CD20, anti-PD-1 and combination. Matrix of correlation based on correlation coefficients (non-parametric Spearman’s correlation) of side-by-side represented as a graph. Correlation coefficients represented by squares where values and color were determined according to correlation coefficient values. (D) Correlation curves of percentage of PD1+TIM3+ expressing CD8+cells (x-axis) and percentage of B cell depletion after 72 hours of treatment (y-axis) with correlation coefficients (r) extracted from correlogram in B. FL-PDLS, follicular lymphoma-patient-derived lymphoma spheroid.

Similar articles

Cited by

References

    1. Scott DW, Gascoyne RD. The tumour Microenvironment in B cell Lymphomas. Nat Rev Cancer 2014;14:517–34. 10.1038/nrc3774 - DOI - PubMed
    1. Carbone A, Roulland S, Gloghini A, et al. . Follicular lymphoma. Nat Rev Dis Primers 2019;5:83. 10.1038/s41572-019-0132-x - DOI - PubMed
    1. Amé-Thomas P, Tarte K. The Yin and the Yang of follicular lymphoma cell niches: role of Microenvironment heterogeneity and plasticity. Semin Cancer Biol 2014;24:23–32. 10.1016/j.semcancer.2013.08.001 - DOI - PubMed
    1. Chraa D, Naim A, Olive D, et al. . T lymphocyte Subsets in cancer immunity: friends or foes. J Leukoc Biol 2019;105:243–55. 10.1002/JLB.MR0318-097R - DOI - PubMed
    1. Dobaño-López C, Araujo-Ayala F, Serrat N, et al. . Follicular lymphoma Microenvironment: an intricate network ready for therapeutic intervention. Cancers (Basel) 2021;13:641. 10.3390/cancers13040641 - DOI - PMC - PubMed

Publication types

MeSH terms

Substances