. 2023 Oct 29;13(1):18561.
doi: 10.1038/s41598-023-44903-z.

Spatially resolved CO2 carbon stable isotope analyses at the microscale using Raman spectroscopy

Affiliations

Spatially resolved CO2 carbon stable isotope analyses at the microscale using Raman spectroscopy

Samantha Remigi et al. Sci Rep. .

Abstract

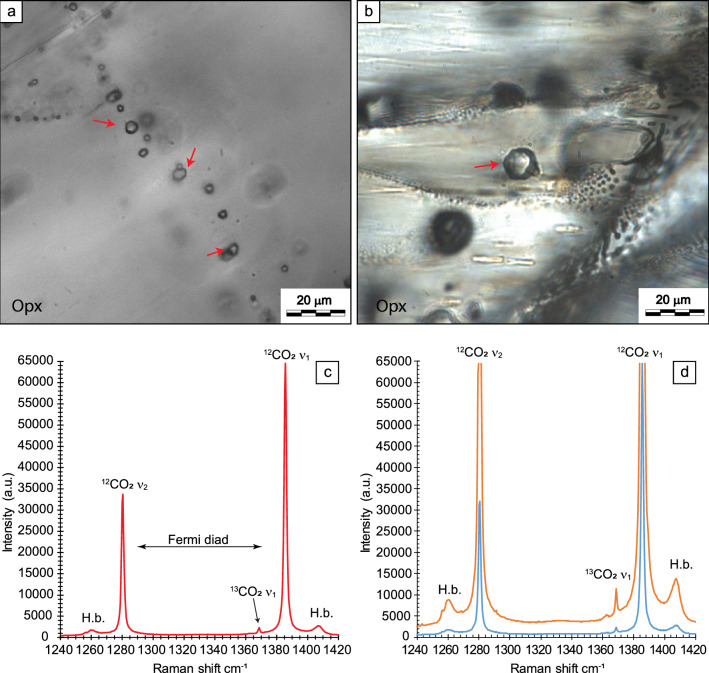
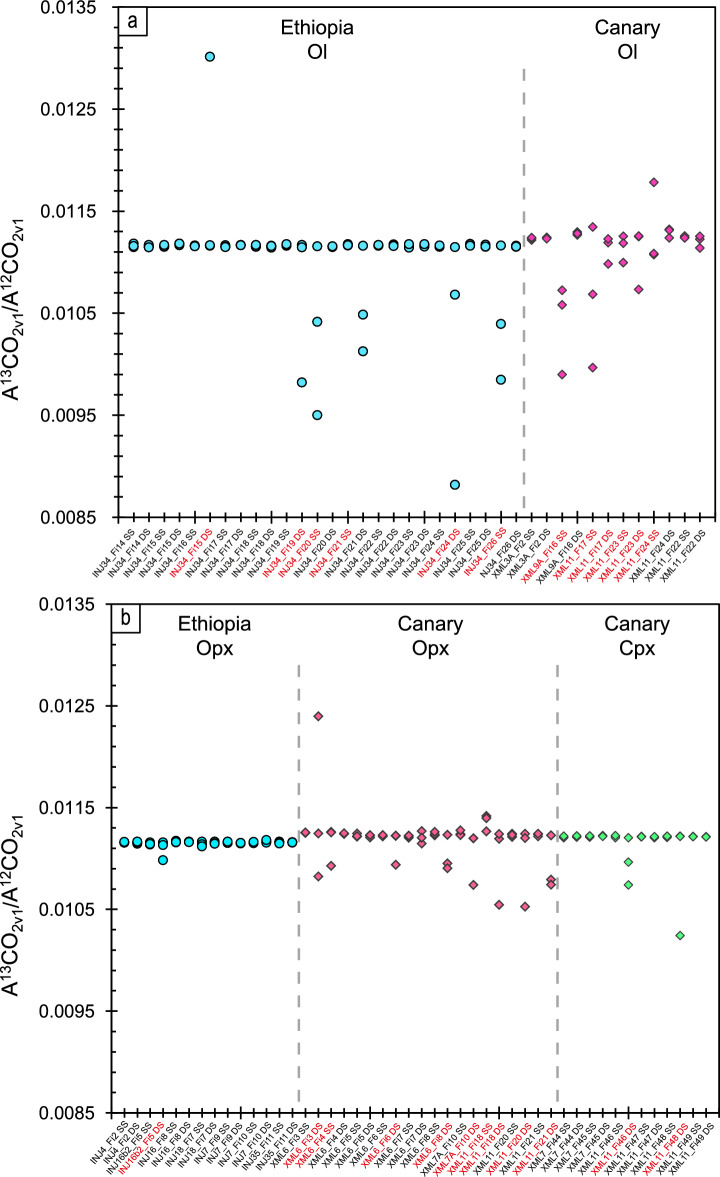
Measuring the carbon stable isotope ratio (13C/12C, expressed as δ13CCO2) in geogenic CO2 fluids is a crucial geochemical tool for studying Earth's degassing. Carbon stable isotope analysis is traditionally performed by bulk mass spectrometry. Although Raman spectroscopy distinguishes 12CO2 and 13CO2 isotopologue bands in spectra, using this technique to determine CO2 isotopic signature has been challenging. Here, we report on in-situ non-destructive analyses of the C stable isotopic composition of CO2, applying a novel high-resolution Raman configuration on 42 high-density CO2 fluid inclusions in mantle rocks from the Lake Tana region (Ethiopia) and El Hierro (Canary Islands). We collected two sets of three spectra with different acquisition times at high spectral resolution in each fluid inclusion. Among the 84 sets of spectra, 58 were characterised by integrated 13CO2/12CO2 band area ratios with reproducibility better than 4‰. Our results demonstrate the determination of δ13CCO2 by Raman spectroscopy in individual fluid inclusions with an error better than 2.5 ‰, which satisfactorily matches bulk mass spectrometry analyses in the same rock samples, supporting the accuracy of the measurements. We thus show that Raman Spectroscopy can provide a fundamental methodology for non-destructive, site-specific, and spatially resolved carbon isotope labelling at the microscale.


Conflict of interest statement

The authors declare no competing interests.

Figures

Figure 1
Figure 1
Microphotographs of selected fluid inclusions and CO2 Raman spectra collected during S.S. and D.S. analyses. (a,b) Microphotographs showing a secondary trail of fluid inclusions (F.I.) trapped in Opx and a primary fluid inclusion with negative crystal shape trapped in Opx in mantle rocks from El Hierro (Canary Islands) (red arrows indicate fluid inclusions selected for Raman analysis). (c) Raman spectrum of CO2 in a fluid inclusion (sample XML6_Fi3a). The two strong bands (upper 12CO2 ν1 and lower 12CO2 ν2 bands) at 1285 and 1388 cm−1 at ambient conditions, forming the Fermi diad, arise from the anharmonic mixing of the overtone of the symmetric bending mode 2ν2 with the symmetric stretching mode ν1 (Fermi resonance effect). The 13CO2 upper band (ν1) composing the Fermi diad of the 13CO2 molecule is also present at about 1370 cm−1. The 13CO2 lower band is predicted at 1260 cm−1, but its actual frequency remains uncertain because it overlaps the more intense hot band, with a frequency at 1264 cm−1,,. (d) CO2 Raman spectra of one selected fluid inclusion (sample XML11_Fi20), collected by single spectra (blue spectrum; acquisition time of 85 s; S.S.) and distinct spectra (D.S.) analyses (orange spectrum; acquisition time of 425 s). Opx orthopyroxene, a.u. arbitrary units, H.b. hot bands, cm−1 Raman shift.
Figure 2
Figure 2
The fitting procedure adopted for spectral processing of the 12CO2 and 13CO2 bands. With the adopted Raman experimental protocol, the 12CO2 ν1 upper band is defined by 67 Raman sampling points, while the 13CO2 ν1 band by 13 sampling points for both S.S. and D.S. sets of measurements. (a) Example of fitting of the 12CO2 ν1 isotopologue. The enlargements on the top (b), the flanks (c) and the base (d) of the band show how chosen fitting curve and the fitting procedure model these three regions of the band. (e) Example of fitting of the 13CO2 ν1. (e) and (f) Examples of fitting the 13CO2 ν1 isotopologue in S.S. and D.S. analyses, respectively. The enlargement of the 13CO2 band (g) compares the adopted fitting procedure in S.S. (green fitted band) and D.S. (light-blue fitted band) analyses in the same fluid inclusion. Note that the fitting of the 13CO2 band resulting from D.S. longer accumulations is less accurate, slightly overestimating the integrated band area.
Figure 3
Figure 3
13CO2/12CO2 area ratios distribution calculated for each set of three spectra. Variation of the three area ratios calculated for single fluid inclusions trapped in Ol (a) and Opx and Cpx (b) in mantle rocks from Injibara (Lake Tana region, Ethiopia; circles) and El Hierro (Canary Islands; diamonds). The label tics distinguish between single spectra (S.S.) and distinct spectra (D.S.) sets of 3 analyses. Fifty-eight out of 84 sets of analyses are characterised by area ratios differing no more than 0.00005, while twenty-six sets of spectra (label tics in red) show at least one 13CO2/12CO2 band area ratio that differs by more than one order of magnitude from the others (from 0.00015 to 0.00233). These last sets of spectra (31% of the total) were found to be non-reproducible, so they were excluded from further analysis. Ol olivine, Opx orthopyroxene, Cpx clinopyroxene.
Figure 4
Figure 4
Raman-calculated δ13CCO2 values for CO2 fluid inclusions trapped in Ol (circles), Opx (diamonds) and Cpx (triangles) in peridotite samples from (a) the Lake Tana region (Ethiopia), and (b) El Hierro (Canary Islands). Analysed inclusions are divided by sample and are provided with error bars. The thick horizontal dashed black lines additionally observable for El Hierro measurements represent the mean bulk δ13CCO2 values obtained by isotope ratio mass spectrometry for comparison. The thin, dotted black lines represent the error interval for bulk Ol and Opx for El Hierro. The green field delimitates the "MORB-like Upper Mantle" carbon isotopic range (− 8‰ < δ13C < − 4‰).

References

    1. Deines, P. Early organic evolution. In Schidlowski M., Golubic S., Kimberley M. M., McKirdy D. M., Trudinger P. A. (eds) (Springer, Berlin, Heidelberg, 1992). 10.1007/978-3-642-76884-2_10.
    1. Deines P. The carbon isotope geochemistry of mantle xenoliths. Earth Sci. Rev. 2002;58:247–278. doi: 10.1016/S0012-8252(02)00064-8. - DOI
    1. Mason E, Edmonds M, Turchyn AV. Remobilization of crustal carbon may dominate volcanic arc emissions. Science. 2017;357(6348):290–294. doi: 10.1126/science.aan5049. - DOI - PubMed
    1. Plank T, Manning CE. Subducting carbon. Nature. 2019;574(7778):343–352. doi: 10.1038/s41586-019-1643-z. - DOI - PubMed
    1. Aiuppa A, Fischer TP, Plank T, Bani P. CO2 flux emissions from the Earth's most actively degassing volcanoes, 2005–2015. Sci. Rep. 2019;9(1):1–17. doi: 10.1038/s41598-019-41901-y. - DOI - PMC - PubMed

Grants and funding