. 2024 Sep;18(9):2157-2178.
doi: 10.1002/1878-0261.13546. Epub 2023 Nov 16.

Th17 cells target the metabolic miR-142-5p-succinate dehydrogenase subunit C/D (SDHC/SDHD) axis, promoting invasiveness and progression of cervical cancers

Affiliations

Th17 cells target the metabolic miR-142-5p-succinate dehydrogenase subunit C/D (SDHC/SDHD) axis, promoting invasiveness and progression of cervical cancers

Maike Pohlers et al. Mol Oncol. 2024 Sep.

Abstract

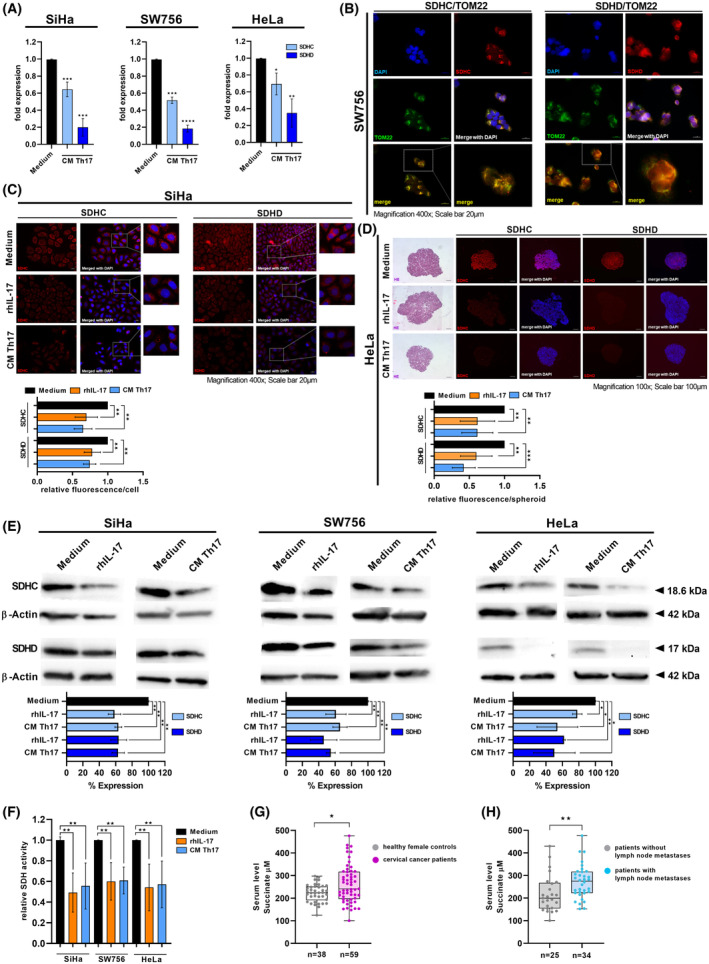
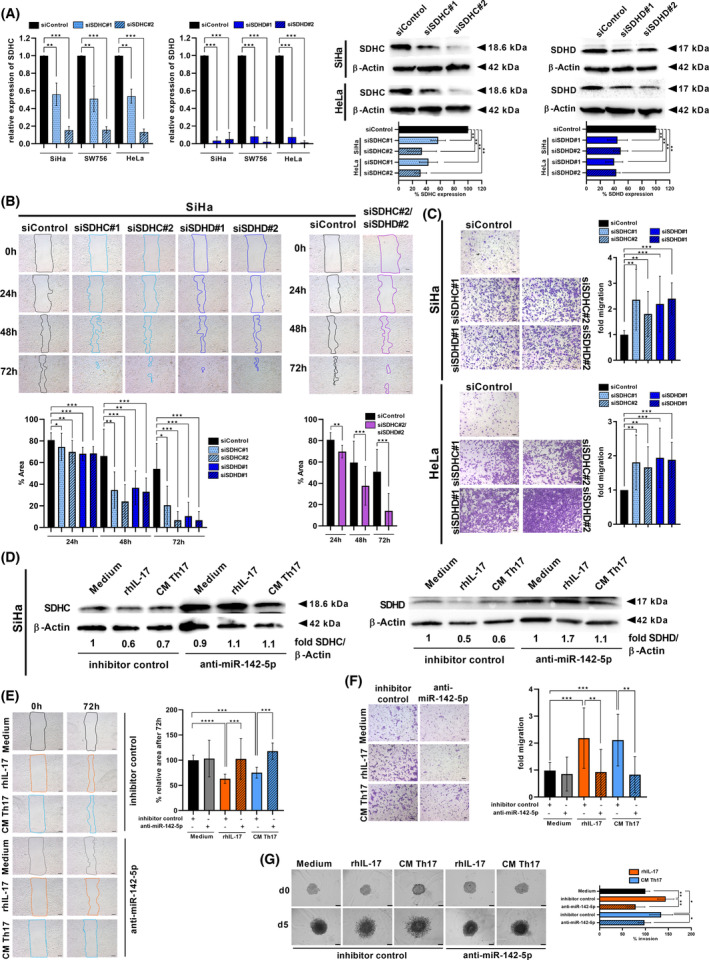
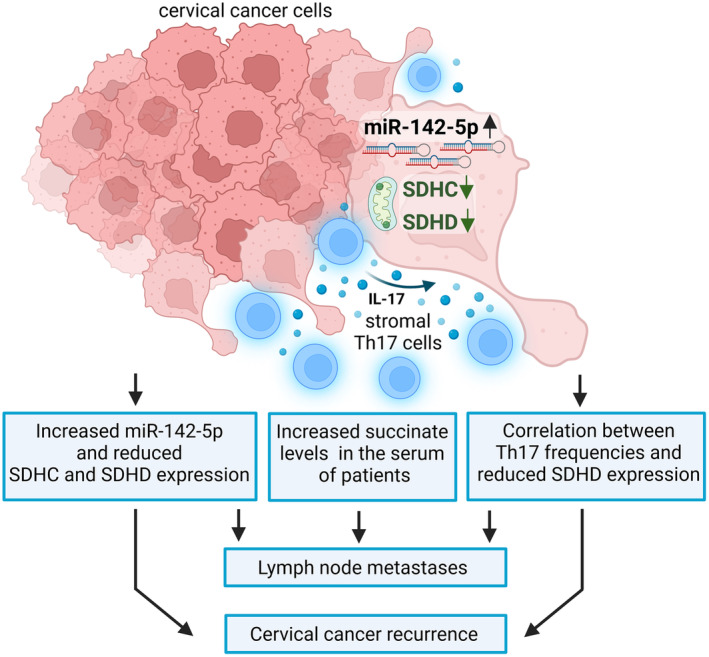
During cervical carcinogenesis, T-helper (Th)-17 cells accumulate in the peripheral blood and tumor tissues of cancer patients. We previously demonstrated that Th17 cells are associated with therapy resistance as well as cervical cancer metastases and relapse; however, the underlying Th17-driven mechanisms are not fully understood. Here, using microarrays, we found that Th17 cells induced an epithelial-to-mesenchymal transition (EMT) phenotype of cervical cancer cells and promoted migration and invasion of 2D cultures and 3D spheroids via induction of microRNA miR-142-5p. As the responsible mechanism, we identified the subunits C and D of the succinate dehydrogenase (SDH) complex as new targets of miR-142-5p and provided evidence that Th17-miR-142-5p-dependent reduced expression of SDHC and SDHD mediated enhanced migration and invasion of cancer cells using small interfering RNAs (siRNAs) for SDHC and SDHD, and miR-142-5p inhibitors. Consistently, patients exhibited high levels of succinate in their serum associated with lymph node metastases and diminished expression of SDHD in patient biopsies correlated with increased numbers of Th17 cells. Correspondingly, a combination of weak or negative SDHD expression and a ratio of Th17/CD4+ T cells > 43.90% in situ was associated with reduced recurrence-free survival. In summary, we unraveled a previously unknown molecular mechanism by which Th17 cells promote cervical cancer progression and suggest evaluation of Th17 cells as a potential target for immunotherapy in cervical cancer.

Keywords: T‐helper‐17 cells; cervical cancers; metastases; miR‐142‐5p; succinate dehydrogenase complex.


Conflict of interest statement

The authors declare no conflict of interest.

Figures

Fig. 1
Fig. 1
Th17 Cells induced the expression of EMT markers in cervical cancer cells and enhanced their migration and invasiveness. (A, B) SiHa and SW756 cells were stimulated with rhIL‐17 or conditioned media (CM) of Th17 cells for 24 h. (A) Transcriptomic profile of Epithelial‐to‐Mesenchymal Transition (EMT) markers. Fold changes of stimulated cells to unstimulated cells were illustrated by color code (reduction in blue, induction in red). Shown are the results from an array analysis performed in quadruplicates. (B) Expression profile of EMT markers was validated by qRT‐PCR (B upper panel; rhIL17 stimulation: Light red and light blue bars, CM Th17 stimulation: dark red and dark blue bars) and western blot analysis after 72 h (lower panel). β‐Actin was used as a loading control. Bars represent quantification of n = 3 independent experiments (mean ± SD; E‐cadherin: Blue bars; vimentin: Red bars). (C) Monolayers of SiHa and HeLa cells stimulated with medium, rhIL‐17 or CM of Th17 cells were scratched. Pictures were taken after 0, 24, 48 and 72 h. The area of the gap, indicated by lines (left panel), was determined in relation to time point 0 h (right panel). Scale bar: 100 μm. Bars represents results (mean ± SD) of n = 3 experiments. The area of 0 h was set at 100%, respectively. (D) SiHa, SW756 and HeLa cells were stimulated with medium, rhIL‐17 or CM of Th17 cells and used in transwell migration assays. Transmigrated cells were calculated after 24 h. Representative pictures (upper panel; scale bar: 100 μm); Quantification of n = 3 experiments with five independent pictures, respectively (mean ± SD), lower panel. The number of medium stimulated cells was set at 1. (E) Spheroids of SW756 cells were generated in the absence or presence of rhIL‐17 or CM of Th17 cells. Spheroids were embedded into matrigel, pictures were taken for 5 days and spheroid invasion was calculated. Shown are the results mean ± SD from four independent experiments performed in doubles. P‐value according to the nonparametric Kruskal–Wallis test (B–D) or Mann–Whitney U‐test (E). Asterisks represent statistical significance: *P < 0.05; **P < 0.01; ***P < 0.001.
Fig. 2
Fig. 2
Th17 cells induced the expression of miR‐142‐5p in cervical cancer cells that mediated enhanced migration and invasion. (A) SiHa, SW756 and HeLa cells were stimulated with rhIL‐17 (orange), conditioned media (CM) of Th17 cells (blue) or medium (black bars) as a control for 24 h and miR‐142‐5p expression was analyzed in relation to RNU48. (B) In neutralization experiments, CM were prestimulated with neutralizing anti‐IL‐17 or respective isotype control antibodies for 2 h (light blue bars) and miR‐142‐5p expression was analyzed in relation to RNU48. (C) SiHa, SW756 and HeLa cells were transfected with miR‐142‐5p expressing plasmid (green bars) or pSG5 (black bars) as empty vector control. MiR‐142‐5p expression was analyzed in relation to RNU48 48 h later. Shown are the results mean ± SD from three independent experiments performed in triplicates in 2A‐2C. (D) MiR‐142‐5p transfected SiHa and HeLa cells were scratched 24 h post‐transfection. Pictures were taken after 0, 24, 48 and 72 h. The area of the gap, indicated by lines (left panel), was determined in relation to time point 0 h (right panel). Scale bar: 100 μm. Bars represents results (mean ± SD) of n = 3 experiments. (E) MiR‐142‐5p transfected SiHa and HeLa cells were used in transwell migration assays 48 h post‐transfection. Transmigrated cells were evaluated 24 h later. Numbers of pSG5 transfected cells were set at 1. Representative pictures (upper panel); quantification of n = 3 experiments with five independent pictures, respectively (mean ± SD) lower panel. Scale bar: 100 μm. (F) Spheroids of mir‐142‐5p transfected SW756 cells were generated. Spheroids were embedded into matrigel, pictures were taken for 5 days and spheroid invasion was calculated. Shown are the results mean ± SD from three independent experiments performed in duplicates. Scale bar: 200 μm. P‐value according to the nonparametric Kruskal–Wallis test (A, D) or Mann–Whitney U‐test (B, C, E, F). Asterisks represent statistical significance: *P < 0.05; **P < 0.01; ***P < 0.001; ****P < 0.0001.
Fig. 3
Fig. 3
Identification and validation of SDHC and SDHD as new targets of miR‐142‐5p. (A) Schematic diagram of reporter gene plasmids. The position of the predicted miR‐142‐5p binding sites in the respective 3′UTR reporter plasmids and their corresponding sequences as well as the sequences of the mutated binding sites (underlined) are shown. SDHC‐3′UTR reporter construct (upper panel), SDHD‐3′UTR reporter construct (lower panel). (B) HEK 293T cells were transfected with the wild type reporter plasmids of the respective target genes SDHC (light blue bar) or SDHD (dark blue bar) or mutated reporter plasmids (mut) of the target genes (striped bars). The luciferase activities were normalized with respect to the luciferase activity measured with empty reporter construct (gray bar). The results represent the mean of three independent experiments carried out in duplicates. (C) SiHa, SW756 and HeLa cells were transfected with miR‐142‐5p expressing plasmid or pSG5 as empty vector control. Whole cell extracts were analyzed 72 h later for SDHC (light blue bars) or SDHD (dark blue bars) expression by western blot analysis. β‐Actin was used as a loading control. Bars represent quantification of n = 3 independent experiments (mean ± SD). P‐value according to the nonparametric Mann–Whitney U‐test. Asterisks represent statistical significance: *P < 0.05; **P < 0.01; ***P < 0.001.
Fig. 4
Fig. 4
Th17 cells reduced the expression of SDHC and SDHD in cervical cancer cells. (A) SiHa, HeLa and SW756 cells were stimulated with conditioned media (CM) of Th17 cells or medium for 48 h. Expression of SDHC and SDHD was evaluated by qRT‐PCR. Bars represent quantification of n = 3 independent experiments (mean ± SD) performed in triplicates. (B) SW756 cells were analyzed for SDHC, SDHD and TOM22 expression by IF. Shown are representative pictures from n = 3 independent experiments. Scale bar: 20 μm. (C) 2D monolayers of SiHa cells were stimulated with rhIL‐17, CM of Th17 cells or medium for 72 h and SDHC and SDHD expression was investigated by IF. Bars represent quantification of relative fluorescence/cell of 20 independent pictures (mean ± SD; magnification 400×) from n = 2 independent experiments performed in duplicates. Scale bar: 20 μm. (D) 3D spheroids of HeLa cells were generated over 10 days in the presence of medium, rhIL‐17 or CM of Th17 cells. 5 μm sections of fixed paraffin‐embedded spheroids were validated by HE stainings and analyzed for SDHC and SDHD expression by IF. Bars represent quantification of relative fluorescence/spheroid of n = 6 independent spheroids (mean ± SD), respectively. Scale bar: 100 μm. (E, F) SiHa, SW756 and HeLa cells were stimulated with medium, rhIL‐17 or CM of Th17 cells for 72 h. (E) Whole cell extracts were analyzed for SDHC and SDHD expression by western blot analysis. β‐Actin was used as a loading control. Bars represent quantification of n = 3 independent experiments (mean ± SD; SDHC: Light blue bars; SDHD: Dark blue bars). (F) SDH activity of SiHa, SW756 and HeLa cells stimulated with medium (black bars), rhIL‐17 (orange bars) or CM of Th17 cells (blue bars) was determined after 72 h. Shown are the results from n = 3 independent experiments (mean ± SD) performed in triplicates. P‐value according to the nonparametric Kruskal–Wallis test. (A, C–F) Asterisks represent statistical significance: *P < 0.05; **P < 0.01; ***P < 0.001; ****P < 0.0001. (G) Serum samples of 59 cervical cancer patients (purple dots) and 38 healthy female controls were analyzed for succinate. (H) Serum levels of succinate were evaluated in patients with (n = 34; blue dots) and without (n = 25; gray dots) lymph node metastases. Black line: Median value of the respective groups. P‐value according to the nonparametric Mann–Whitney U‐test. Asterisks represent statistical significance: *P < 0.05; **P < 0.01.
Fig. 5
Fig. 5
Th17‐induced increased migration of cervical cancer cells is dependent on miR‐142‐5p‐mediated reduced SDHC and SDHD expression. SiHa, SW756 and HeLa cells were transfected with two specific siRNAs for SDHC (dotted and stripped light blue bars) or SDHD (dotted and stripped dark blue bars), respectively, or mock siRNA (black bars) as a control. (A) After 48 h, SDHC and SDHD expression was calculated by qRT‐PCR (left panel) and whole cell extracts were analyzed for SDHC and SDHD expression by western blot analysis (right panel). β‐Actin was used as a loading control. Bars represent quantification of n = 3 independent experiments performed in duplicates. (mean ± SD). (B) 24 h post‐transfection, SiHa cells were scratched. Pictures were taken after 0, 24, 48 and 72 h. The area of the gap, indicated by lines (upper panel), was determined in relation to time point 0 h (lower panel). Scale bar: 100 μm. Bars represent results (mean ± SD) of n = 3 experiments. Additionally, SiHa cells were transfected with specific siRNAs for SDHC and SDHD (purple bars). 24 h post‐transfection, SiHa cell were scratched. Pictures were taken after 0, 24, 48 and 72 h. The area of the gap, indicated by lines (upper panel), was determined in relation to time point 0 h (lower panel). Scale bar: 100 μm. Bars represents results (mean ± SD) of n = 3 experiments. (C) Transfected SiHa and HeLa cells were used in transwell migration assays 48 h post‐transfection. Representative pictures (left panel); quantification of transmigrated cells of n = 3 experiments with five independent pictures, respectively (mean ± SD, right panel). Scale bar: 100 μm. (D–G) SiHa cells were transfected with inhibitor of miR‐142‐5p or inhibitor control. After 24 h, cells were stimulated with medium, rhIL‐17 or CM of Th17 cells. (D) Whole cell extracts were analyzed for SDHC and SDHD expression by western blot analysis. β‐Actin was used as a loading control. Fold expression of SDHC and SDHD per β‐Actin expression was calculated. Medium stimulated cells transfected with inhibitor control was set at 1. Shown are the results from n = 2 independent experiments. (E) Transfected cells were stimulated with medium, rhIL‐17 (orange bars) or CM of Th17 cells (light blue bars). After 24 h cells were scratched. Pictures were taken after 0, 24, 48 and 72 h. The area of the gap, indicated by lines (left panel), was determined after 72 h in relation to time point 0 h (right panel). Scale bar: 100 μm. Bars represent results (mean ± SD) after 72 h of n = 3 experiments. The area of medium stimulated cells transfected with inhibitor control was set at 100%. (F) 24 h post‐transfection, transfected cells were stimulated with medium, rhIL‐17 (orange bars) or CM of Th17 cells (light blue bars). After 24 h, cells were used in transwell migration assays. Representative pictures (left panel) after 24 h; quantification of transmigrated cells of n = 3 experiments with five independent pictures, respectively (mean ± SD; right panel). The number of medium stimulated cells transfected with inhibitor control was set at 1. Scale bar: 100 μm. (G) 24 h post‐transfection, spheroids were generated out of transfected cells for 4 days in the presence of medium, rhIL‐17 (orange bars) or CM of Th17 cells (light blue bars). Spheroids were embedded into matrigel, pictures were taken for 5 days and spheroid invasion was calculated. Shown are the results mean ± SD from four independent spheroids. Scale bar: 200 μm. P‐value according to the nonparametric Kruskal–Wallis test. Asterisks represent statistical significance: *P < 0.05; **P < 0.01; ***P < 0.001; ****P < 0.0001.
Fig. 6
Fig. 6
Inverse correlation of Th17 cells and SDHD expression in cervical cancer biopsies in situ and association with lymph node metastases and cervical cancer recurrence. (A) Sections of human SCCs of 52 cervical cancer patients were stained for SDHD expression by IHC ((i) negative, (ii) weak, (iii) moderate expression). Magnification 200× (Scale bars 50 μm). (B) IRS of SDHD within 52 biopsies. (C) Correlation of immunoreactive score (IRS) of SDHD and tumor FIGO stages. Significances were evaluated using Spearman rank correlation. (D) IRS of SDHD in tumor tissues of patients with (blue circles) and without (gray diamonds) lymph node metastases or (E) with and without cervical cancer relapse. Significances were evaluated using a two‐tailed Mann–Whitney U‐test, ****P < 0.0001. (F, G) Correlation of numbers of Th17 cells per mm2 or (G) percentages of Th17/CD4+ T cells with IRS of SDHD. Significances were evaluated using Spearman rank correlation. (H) Recurrence‐free survival of 52 patients was determined for a cohort with moderate and strong SDHD expression (n = 19; light red line) and negative and weak SDHD expression (n = 33; red line). Median recurrence‐free survival was 72 months for the cohort with negative and weak SDHD expression. Comparison of survival analysis was performed using log‐rank (Mantel‐Cox) test; chi‐square: 10.83, **P = 0.0010. Recurrence‐free survival of 52 patients was determined for a cohort with CD4+IL‐17+ cells per CD4+ T cells < 43.90% (n = 26; light blue line) and CD4+IL‐17+ cells per CD4+ T cells > 43.90% (n = 24; blue line). Median recurrence‐free survival was 72 months for the cohort with CD4+IL‐17+ cells per CD4+ T cells > 43.90%. Comparison of survival analysis was performed using log‐rank (Mantel‐Cox) test; chi‐square: 6.61, *P = 0.0102. Recurrence‐free survival of 52 patients was determined for a cohort with moderate and strong SDHD expression and CD4+IL‐17+ cells per CD4+ T cells < 43.90% (n = 23; light purple line) and for a cohort with negative or weak SDHD expression and CD4+IL‐17+ cells per CD4+ T cells > 43.90% (n = 27; purple line). Median recurrence‐free survival was 64 months for the cohort with negative or weak SDHD expression and CD4+IL‐17+ cells per CD4+ T cells > 43.90%. Comparison of survival analysis was performed using log‐rank (Mantel‐Cox) test; Chi‐square: 31.61, ***P < 0.0001.
Fig. 7
Fig. 7
Schematic presentation of the role of Th17 cells in cervical cancer progression: Th17‐induced miR‐142‐5p‐dependent reduction in SDHC and SDHD expression favors cervical cancer invasiveness and increased frequencies of Th17 cells and reduced SDHD expression related to cervical cancer recurrence (scheme was generated with the biorender software, Toronto, Ontario, Canada).

Similar articles

Cited by

References

    1. Arbyn M, Weiderpass E, Bruni L, de Sanjose S, Saraiya M, Ferlay J, et al. Estimates of incidence and mortality of cervical cancer in 2018: a worldwide analysis. Lancet Glob Health. 2020;8:e191–e203. 10.1016/S2214-109X(19)30482-6 - DOI - PMC - PubMed
    1. Serkies K, Jassem J. Systemic therapy for cervical carcinoma – current status. Chin J Cancer Res. 2018;30:209–221. 10.21147/j.issn.1000-9604.2018.02.04 - DOI - PMC - PubMed
    1. Elit L, Fyles AW, Oliver TK, Devries‐Aboud MC, Fung‐Kee‐Fung M, Members of the Gynecology Cancer Disease Site Group of Cancer Care Ontario's Program in Evidence‐Based Care . Follow‐up for women after treatment for cervical cancer. Curr Oncol. 2010;17:65–69. 10.3747/co.v17i3.514 - DOI - PMC - PubMed
    1. Ferrall L, Lin KY, Roden RBS, Hung CF, Wu TC. Cervical cancer immunotherapy: facts and hopes. Clin Cancer Res. 2021;27:4953–4973. 10.1158/1078-0432.CCR-20-2833 - DOI - PMC - PubMed
    1. Heeren AM, Koster BD, Samuels S, Ferns DM, Chondronasiou D, Kenter GG, et al. High and interrelated rates of PD‐L1+CD14+ antigen‐presenting cells and regulatory T cells mark the microenvironment of metastatic lymph nodes from patients with cervical cancer. Cancer Immunol Res. 2015;3:48–58. 10.1158/2326-6066.CIR-14-0149 - DOI - PubMed

MeSH terms