Princeton RAtlas: A Common Coordinate Framework for Fully cleared, Whole Rattus norvegicus Brains
- PMID: 37900100
- PMCID: PMC10603261
- DOI: 10.21769/BioProtoc.4854
Princeton RAtlas: A Common Coordinate Framework for Fully cleared, Whole Rattus norvegicus Brains
Abstract
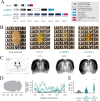
Whole-brain clearing and imaging methods are becoming more common in mice but have yet to become standard in rats, at least partially due to inadequate clearing from most available protocols. Here, we build on recent mouse-tissue clearing and light-sheet imaging methods and develop and adapt them to rats. We first used cleared rat brains to create an open-source, 3D rat atlas at 25 μm resolution. We then registered and imported other existing labeled volumes and made all of the code and data available for the community (https://github.com/emilyjanedennis/PRA) to further enable modern, whole-brain neuroscience in the rat. Key features • This protocol adapts iDISCO (Renier et al., 2014) and uDISCO (Pan et al., 2016) tissue-clearing techniques to consistently clear rat brains. • This protocol also decreases the number of working hours per day to fit in an 8 h workday. Graphical overview.
Keywords: Image registration; Light-sheet imaging; Neuroscience; Rat; Rattus norvegicus; Tissue clearing; iDISCO; uDISCO.
©Copyright : © 2023 The Authors; This is an open access article under the CC BY license.
Conflict of interest statement
Competing interestsThe authors have no competing interests to declare.
Figures


References
-
- Ahrens M. B., Orger M. B., Robson D. N., Li J. M. and Keller P. J.(2013). Whole-brain functional imaging at cellular resolution using light-sheet microscopy. Nat. Methods 10(5): 413-420. - PubMed
-
- Bezgin G., Reid A. T., Schubert D. and Kötter R.(2009). Matching Spatial with Ontological Brain Regions using Java Tools for Visualization, Database Access, and Integrated Data Analysis. Neuroinformatics 7(1): 7-22. - PubMed
-
- Branch A., Tward D., Kolstad A. C., Pulyadi V., Vogelstein J. T., Wu Z. and Gallagher M.(2019). An optimized tissue clearing protocol for rat brain labeling, imaging, and high throughput analysis. bioRxiv: e1101/639674.
-
- Chung K. and Deisseroth K.(2013). CLARITY for mapping the nervous system. Nat. Methods 10(6): 508-513. - PubMed
-
- Henning Y., Osadnik C., and Malkemper E. P.(2019). EyeCi: Optical clearing and imaging of immunolabeled mouse eyes using light-sheet fluorescence microscopy. Exp. Eye Res. 180:137-145. - PubMed
Grants and funding
LinkOut - more resources
Full Text Sources
Research Materials

