. 2023 Oct 12:14:1268909.
doi: 10.3389/fimmu.2023.1268909. eCollection 2023.

Vancomycin-induced gut microbial dysbiosis alters enteric neuron-macrophage interactions during a critical period of postnatal development

Affiliations

Vancomycin-induced gut microbial dysbiosis alters enteric neuron-macrophage interactions during a critical period of postnatal development

Ellen Merrick Schill et al. Front Immunol. .

Abstract

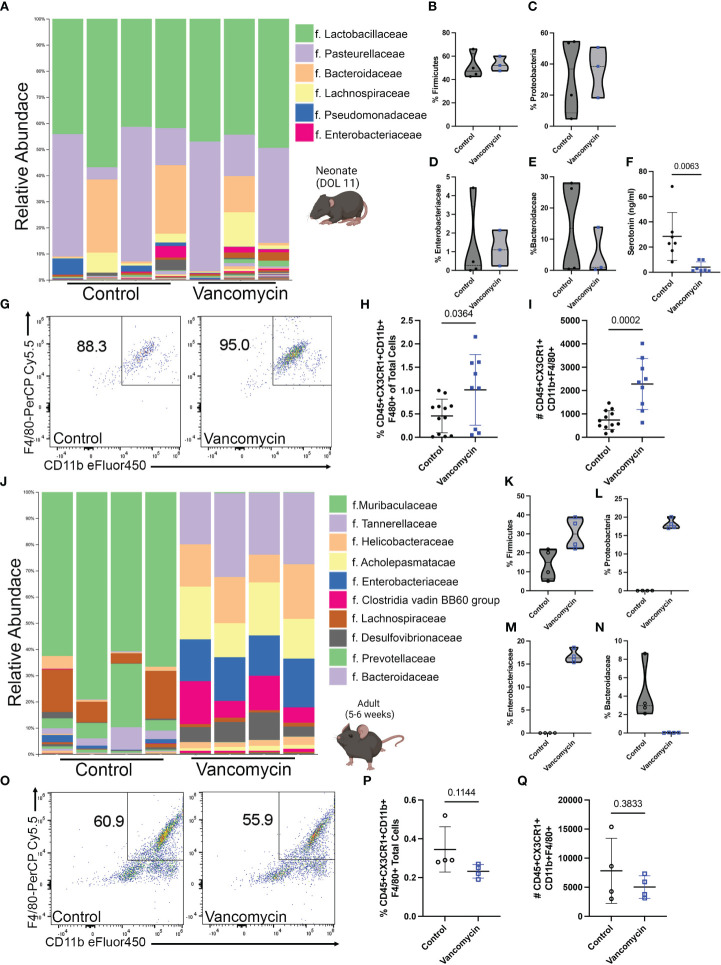
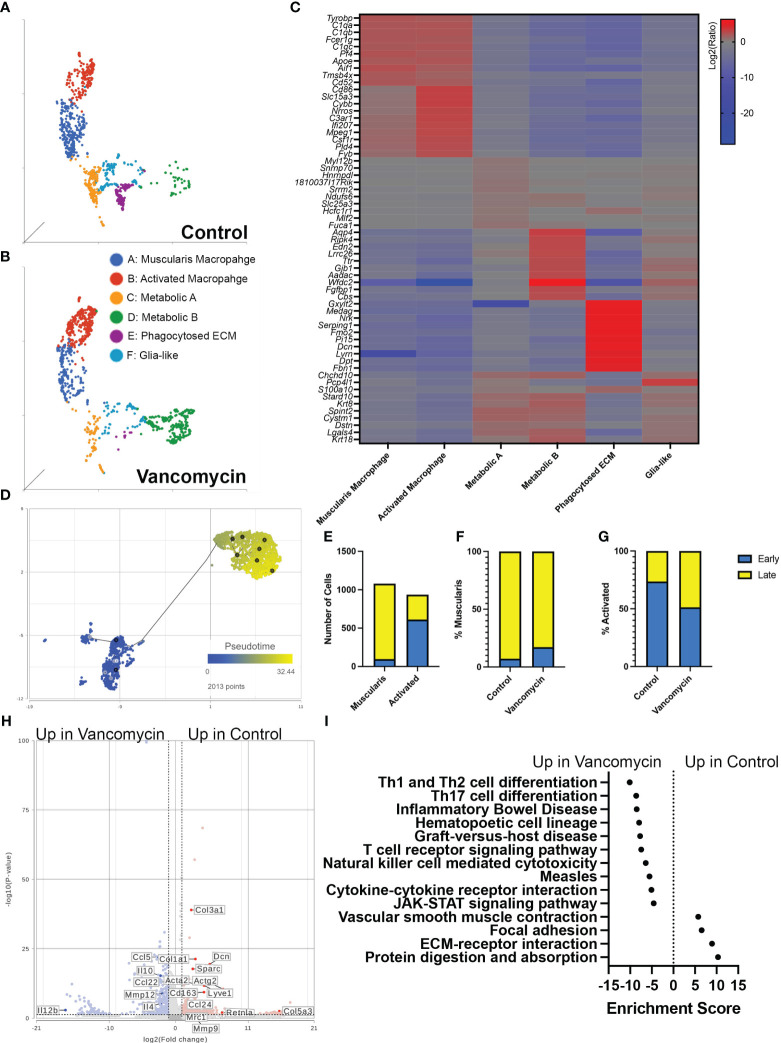
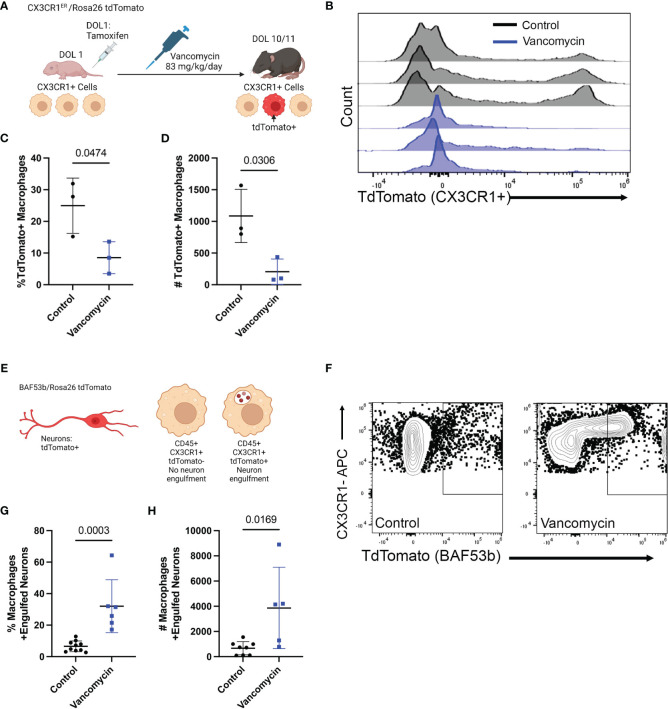
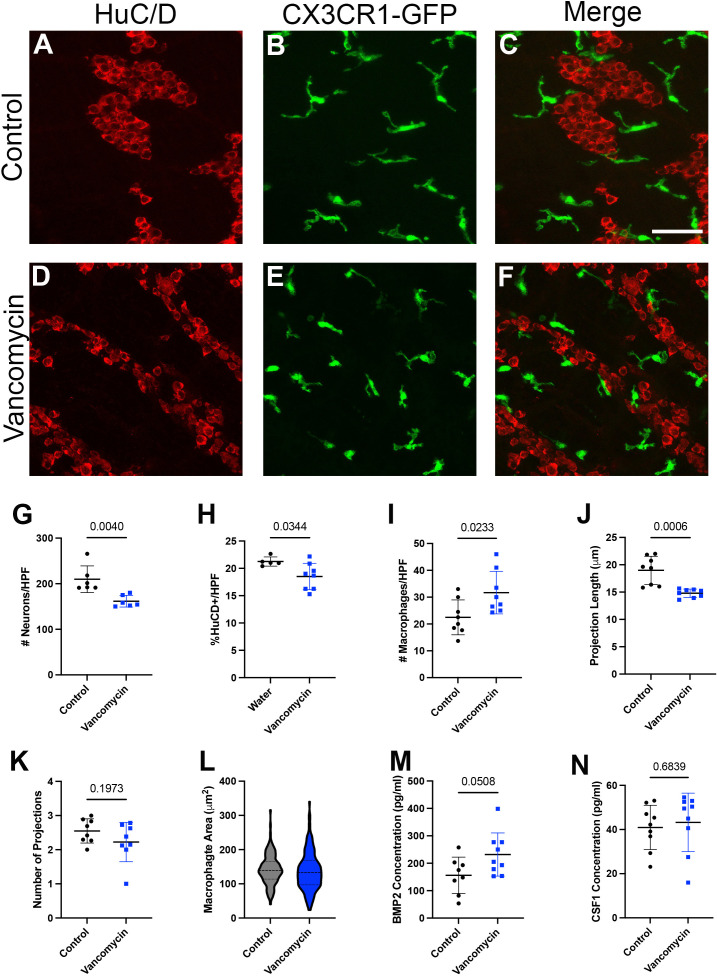
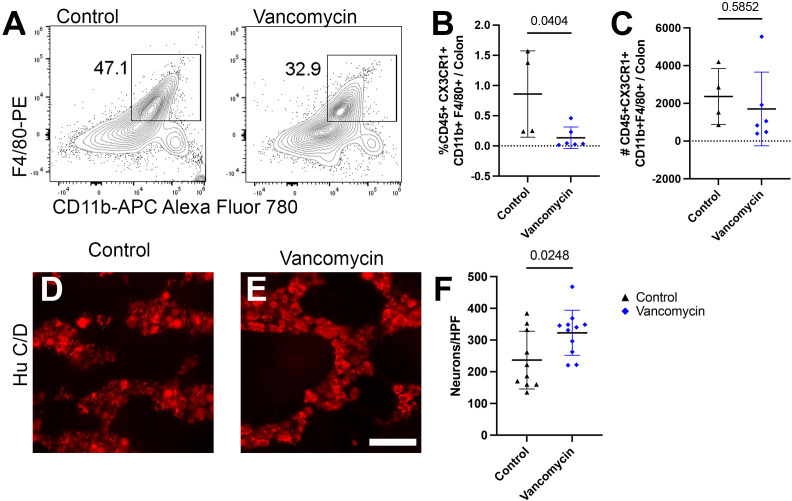
Vancomycin is a broad-spectrum antibiotic widely used in cases of suspected sepsis in premature neonates. While appropriate and potentially lifesaving in this setting, early-life antibiotic exposure alters the developing microbiome and is associated with an increased risk of deadly complications, including late-onset sepsis (LOS) and necrotizing enterocolitis (NEC). Recent studies show that neonatal vancomycin treatment disrupts postnatal enteric nervous system (ENS) development in mouse pups, which is in part dependent upon neuroimmune interactions. This suggests that early-life antibiotic exposure could disrupt these interactions in the neonatal gut. Notably, a subset of tissue-resident intestinal macrophages, muscularis macrophages, has been identified as important contributors to the development of postnatal ENS. We hypothesized that vancomycin-induced neonatal dysbiosis impacts postnatal ENS development through its effects on macrophages. Using a mouse model, we found that exposure to vancomycin in the first 10 days of life, but not in adult mice, resulted in an expansion of pro-inflammatory colonic macrophages by increasing the recruitment of bone-marrow-derived macrophages. Single-cell RNA sequencing of neonatal colonic macrophages revealed that early-life vancomycin exposure was associated with an increase in immature and inflammatory macrophages, consistent with an influx of circulating monocytes differentiating into macrophages. Lineage tracing confirmed that vancomycin significantly increased the non-yolk-sac-derived macrophage population. Consistent with these results, early-life vancomycin exposure did not expand the colonic macrophage population nor decrease enteric neuron density in CCR2-deficient mice. Collectively, these findings demonstrate that early-life vancomycin exposure alters macrophage number and phenotypes in distinct ways compared with vancomycin exposure in adult mice and results in altered ENS development.

Keywords: early life antibiotics; enteric nervous system; monocyte recruitment; muscularis macrophage; neonatal dysbiosis.


Conflict of interest statement

The authors declare that the research was conducted in the absence of any commercial or financial relationships that could be construed as a potential conflict of interest.

Figures

Figure 1
Figure 1
Vancomycin treatment expands the colonic macrophage population in neonatal but not adult mice. C57B6/J mouse pups were treated with 83 mg/kg/day of vancomycin orally from DOL 1 to 10/11 before analysis on DOL 10/11. (A) Taxonomic bar plots at the family level demonstrating the relative abundance of bacteria of control and vancomycin-treated litters. Relative abundance of bacteria in the (B) Firmicute [data presented as median (25–75 percentile); control 47.25 (43.07–62.06)%, n = 4 litters, 3–4 pups per litter; vancomycin 52.08 (47.45–59.99)%, n = 3 litters, 3–4 pups per litter] and (C) Proteobacteria [control 36.77 (8.59–54.18)%, vancomycin 38.54 (18.27–50.73)%] phyla. Relative abundance of bacteria in the (D) Enterobacteriaceae [control 0.27 (0.021–3.43)%, vancomycin 1.1 (0.24–2.15)%] and (E) Bacteroidaceae [control 13.5 (0.53–25.57)%, vancomycin 0.99 (0.27–13.84)%] families. P-value = 0.63 for all four comparisons by the Mann–Whitney test. (F) Serotonin concentration in colonic content as measured by ELISA was significantly reduced by vancomycin treatment (data presented as mean ± standard deviation): control 28.5 ± 19.1 ng/ml, n = 7 litters, 3–4 pups per litter; vancomycin 4.1 ± 4.1 ng/ml, n = 7 litters, 2–4 pups per litter. (G) Representative density plots of singlet CD45+ CX3CR1+ cells gated for CD11b and F4/80 on control and vancomycin-treated mice, respectively. Vancomycin increased the population of CD45+ CX3CR1+ CD11b- F4/80+ or macrophages both by the (H) percentage of total cells in the colon (control 0.45% ± 0.35%, n = 12; vancomycin 1.02% ± 0.75%, n = 9) and (I) absolute cell numbers (control 740 ± 404.7 cells, n = 12; vancomycin 2,283 ± 1,093 cells, n = 9). In comparison, adult male mice were treated with 0.5 g/L of vancomycin in their drinking water for 10 days prior to analysis. (J) Taxonomic bar plots at the family level demonstrating the relative abundance of bacteria from control or vancomycin-treated adult male mice. Relative abundance of bacteria in the (K) Firmicute [data presented as median (25–75 percentile); control 14.96 (6.29–21.45)%, n = 4; vancomycin 29.99 (22.81–37.98)%, n = 4] and (L) Proteobacteria [control 0.04 (0.01–0.05)%, vancomycin 17.7 (17.05–19.59)%] phyla. Relative abundance of bacteria in the (M) Enterobacteriaceae [control 0.02 (0.004–0.03)%, vancomycin 16.32 (5.52–18.11)%] and (N) Bacteroidaceae [control 2.97 (2.27–7.26)%, vancomycin 0.03 (0.005–0.05)%] families. P-value = 0.03 for all four comparisons by the Mann–Whitney test. (O) Representative density plots of singlet CD45+ CX3CR1+ cells gated for CD11b and F4/80 on adult control and vancomycin-treated mice, respectively. There was no difference in the (P) percentage (data presented as mean ± standard deviation; control 0.35% ± 0.12%, n = 4; vancomycin 0.23% ± 0.04%, n = 4) or (Q) absolute number (control 7,819 ± 5,586, n = 4; vancomycin 5,038 ± 1,939, n = 4) of macrophages between control and vancomycin-treated mice.
Figure 2
Figure 2
Vancomycin promotes the expression of pro-inflammatory genes in neonatal colonic macrophages. Clustering of CD45+ CX3CR1+ CD11c−/lo cells from control (A) and vancomycin-treated (B) DOL 11 CX3CR1GFP heterozygous mice based on downsampled counts to visualize the relative abundance of cell clusters between conditions. (C) Heatmap displaying the top 10 biomarkers visualized by the log2 ratio between the expression of the target cluster compared with the expression in all other clusters. (D) The muscularis and activated macrophage clusters were subsequently assessed by pseudotime and visualized per two-dimension UMAP plot with a place in pseudotime denoted by color from early (blue) to late (yellow). (E) Quantification of cells identified as early compared with late on trajectory analysis demonstrated a significant increase in early cells in the activated cohort compared with the muscularis cluster (P < 0.0001, chi-square test). Percentage of early and late cells in the (F) muscularis (control: early 7.18%, late 92.82%; vancomycin: early 17.24%, late 82.76%) and (G) activated cells (Control: early 73.65% late 26.35%; Vancomycin: early 51.31% late 48.69%) was altered by vancomycin treatment with a greater percentage of muscularis cells coded as early in the vancomycin-treated group and an increase in activated cells coded as late in the vancomycin-treated group. (H) Volcano plot demonstrating differential gene expression between control and vancomycin-treated colons of the pooled population of muscularis and activated macrophages. (I) KEGG gene expression pathways upregulated in vancomycin treatment (negative enrichment scores) compared with control (positive enrichment scores).
Figure 3
Figure 3
Recruitment of pro-inflammatory bone-marrow-derived macrophages drives vancomycin-induced changes in the neonatal colonic macrophage population. (A) Schematic demonstrating the mating and treatment protocol to label CX3CR1 expressing cells with tdTomato expression on DOL 1 and to assess the percentage of tdTomato+ macrophages on DOL 11. CX3CR1ERT2/tdTomato pups were treated with one dose of tamoxifen on DOL 1. Mice were then treated with vancomycin until analysis on DOL 10/11. (B) Histogram of tdTomato expression in CD45+ CX3CR1+ CD11b+ F4/80+ cells in control and vancomycin-treated P11 mice. Vancomycin-treated mice have significantly fewer tdTomato+ macrophages by both (C) percentage (control 24.97% ± 8.7% of macrophages, n = 3; vancomycin 8.54% ± 5.03% of macrophages, n = 3) and (D) absolute number of cells (control 1,086 ± 419.8 cells, vancomycin 205.7 ± 206.6 cells). (E) Schematic depicting tdTomato+ neurons as driven by the pan-neuronal BAF53b Cre. Macrophages were identified by flow cytometry, and the number of macrophages positive for tdTomato (i.e., had phagocytosed neurons) was quantified on DOL 11. (F) Representative flow plots from control and vancomycin-treated mice of singlet CD45+ CX3CR1+ cells. There are significantly more macrophages that have engulfed neurons (identified as CX3CR1+ tdTomato+ cells) by (G) percentage (control 6.57% ± 3.38% macrophages, n = 10; vancomycin 32.03% ± 16.8% of macrophages, n = 6) and (H) absolute number (control 668.8 ± 526.9 cells, vancomycin 3,865 ± 3,230 cells) indicating increased neuronal engulfment by macrophages in vancomycin-treated mice.
Figure 4
Figure 4
Neonatal neuron/macrophage interactions are disrupted by vancomycin treatment. Colon myenteric plexus from (A–C) control and (D–F) vancomycin-treated DOL 11 CX3CR1GFP heterozygous mice. Scale bar = 50 µm. Vancomycin-exposed mice have reduced neuronal density in the colon myenteric plexus as measured by the number of (G) cell bodies (control 209.9 ± 29.23 neurons/high-power field (HPF), n = 6; vancomycin 161.6 ± 12.71 neurons/HPF, n = 6) and (H) field area covered by neuronal staining (control 21.25% ± 0.08%, n = 5; vancomycin 18.51% ± 2.42%, n = 8). (I) Vancomycin-treated mice have increased density of CX3CR1GFP+ macrophages in the muscularis (control 22.48 ± 6.48 macrophages/HPF, n = 8; vancomycin 31.71 ± 7.95 macrophages/HPF, n = 8). (J) The average projection length of muscularis CX3CR1+ cells was shorter in vancomycin-treated mice compared with controls (control 18.98 ± 2.58 µm, n = 8; vancomycin 14.8 ± 0.77 µm, n = 8). (K) There was no significant difference in the number of projections on CX3CR1GFP+ cells in the muscularis between the control and vancomycin-treated mice (control 2.55 ± 0.36 projections, n = 8; vancomycin 2.23 ± 0.58 projections, n = 8). (L) The area of macrophages was calculated from z-max projections of z stacks, and vancomycin-treated mice had increased variation in macrophage area compared with controls (control 142.2 ± 43.63 mm2, n = 145 macrophages; vancomycin 136.8 ± 55.5 mm2, n = 177 macrophages; Kolmogorov–Smirnov test, control P > 0.1, vancomycin P = 0.0469, non-normal distribution). ELISA was performed to measure the concentration of the growth factors (M) BMP2 (control 156.2 ± 66.22 pg/ml, n = 8; vancomycin 231.8 ± 78.83 pg/ml, n = 9) and (N) CSF1 (control 40.93 ± 10.03 pg/ml, n = 9; vancomycin 43.23 ± 13.24 pg/ml, n = 9) in total colonic lysate of control and vancomycin-treated mice pups.
Figure 5
Figure 5
Vancomycin effects on neuronal or macrophage density are abrogated in mice deficient in bone-marrow-derived macrophage recruitment. (A) Representative density plots of singlet CD45+ CX3CR1+ CD11b+ F4/80+ cells from control and vancomycin-treated CCR2-deficient mice, respectively. There was a decrease in CD45+ CX3CR1+ CD11b+ F4/80+ cells in vancomycin-treated CCR2-deficient mice when compared with controls by (B) percentage (control 0.86% ± 0.71% of total cells, n = 4; vancomycin 0.13% ± 0.18% of total cells, n = 6), but there was no change in the (C) absolute number of cells (control 2,360 ± 1,483 cells, n = 4; vancomycin 1,702 ± 1,955 cells, n = 6). (D, E) Colonic myenteric plexus stained for neurons with HuC/D in CCR2-deficient control and vancomycin-treated pups. Scale bar = 50 µm. (F) Quantification of neurons/HPF demonstrated an increase in neuronal density in vancomycin-treated CCR2-deficient mice compared with controls (control 236.7 ± 90.9 neurons/HPF, n = 10; vancomycin 322.9 ± 71 neurons/HPF, n = 11).

References

    1. Flannery DD, Ross RK, Mukhopadhyay S, Tribble AC, Puopolo KM, Gerber JS. Temporal trends and center variation in early antibiotic use among premature infants. JAMA Netw Open (2018) 1(1):e180164. doi: 10.1001/jamanetworkopen.2018.0164 - DOI - PMC - PubMed
    1. Hsieh EM, Hornik CP, Clark RH, Laughon MM, Benjamin DK, Smith PB, Jr, et al. Medication use in the neonatal intensive care unit. Am J Perinatol (2014) 31(9):811–21. doi: 10.1055/s-0033-1361933 - DOI - PMC - PubMed
    1. Gasparrini AJ, Crofts TS, Gibson MK, Tarr PI, Warner BB, Dantas G. Antibiotic perturbation of the preterm infant gut microbiome and resistome. Gut Microbes (2016) 7(5):443–9. doi: 10.1080/19490976.2016.1218584 - DOI - PMC - PubMed
    1. Gasparrini AJ, Wang B, Sun X, Kennedy EA, Hernandez-Leyva A, Ndao IM, et al. Persistent metagenomic signatures of early-life hospitalization and antibiotic treatment in the infant gut microbiota and resistome. Nat Microbiol (2019) 4(12):2285–97. doi: 10.1038/s41564-019-0550-2 - DOI - PMC - PubMed
    1. Niu X, Daniel S, Kumar D, Ding EY, Savani RC, Koh AY, et al. Transient neonatal antibiotic exposure increases susceptibility to late-onset sepsis driven by microbiota-dependent suppression of type 3 innate lymphoid cells. Sci Rep (2020) 10(1):12974. doi: 10.1038/s41598-020-69797-z - DOI - PMC - PubMed

Publication types