

NetAllergen, a random forest model integrating MHC-II presentation propensity for improved allergenicity prediction
- PMID: 37901344
- PMCID: PMC10603389
- DOI: 10.1093/bioadv/vbad151
NetAllergen, a random forest model integrating MHC-II presentation propensity for improved allergenicity prediction
Abstract
Motivation: Allergy is a pathological immune reaction towards innocuous protein antigens. Although only a narrow fraction of plant or animal proteins induce allergy, atopic disorders affect millions of children and adults and cost billions in healthcare systems worldwide. In silico predictors can aid in the development of more innocuous food sources. Previous allergenicity predictors used sequence similarity, common structural domains, and amino acid physicochemical features. However, these predictors strongly rely on sequence similarity to known allergens and fail to predict protein allergenicity accurately when similarity diminishes.
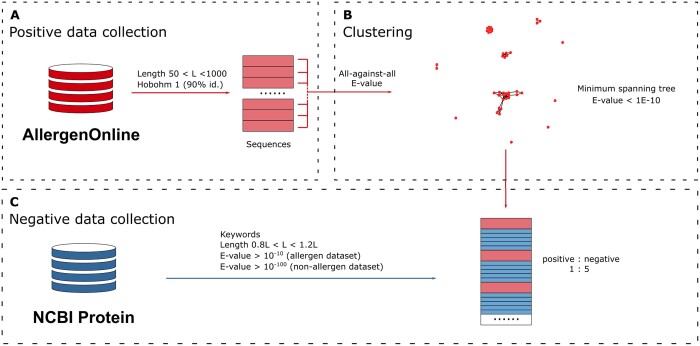
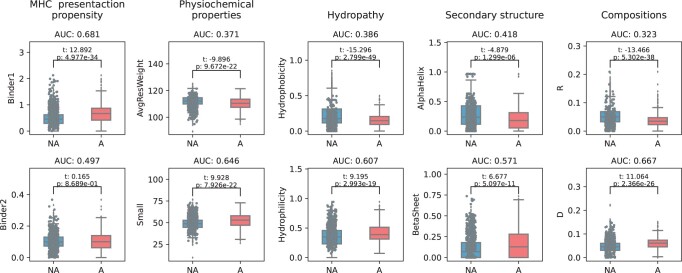
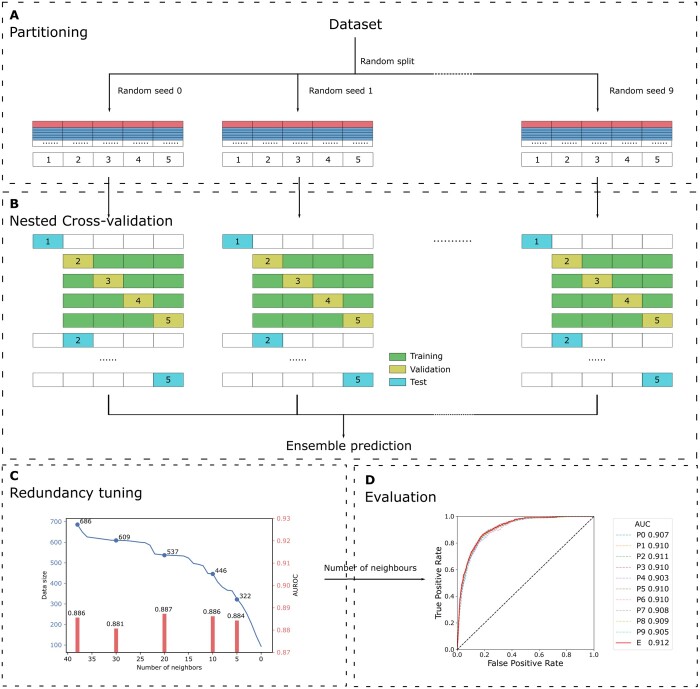
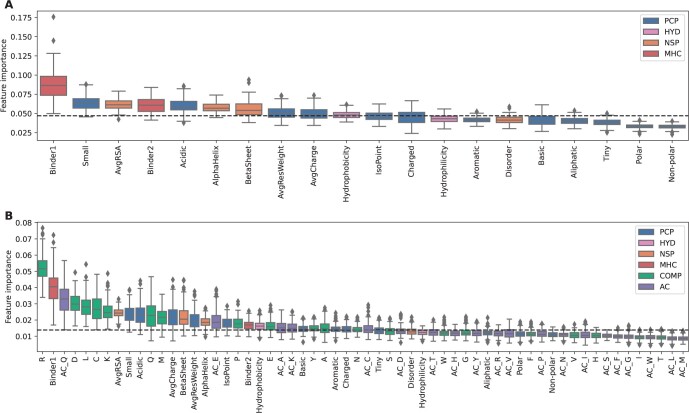
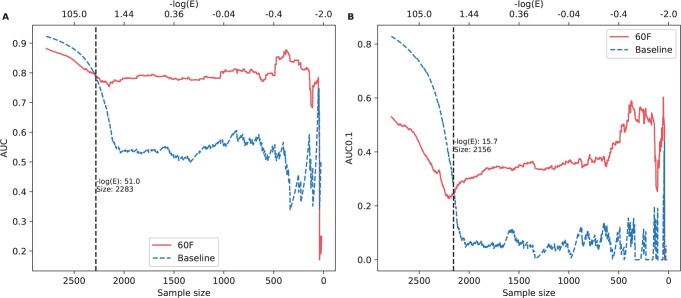
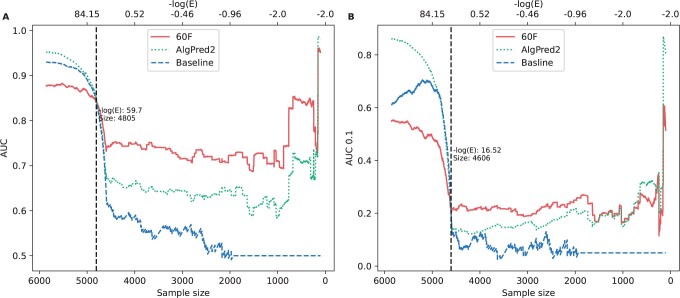
Results: To overcome these limitations, we collected allergens from AllergenOnline, a curated database of IgE-inducing allergens, carefully removed allergen redundancy with a novel protein partitioning pipeline, and developed a new allergen prediction method, introducing MHC presentation propensity as a novel feature. NetAllergen outperformed a sequence similarity-based BLAST baseline approach, and previous allergenicity predictor AlgPred 2 when similarity to known allergens is limited.
Availability and implementation: The web service NetAllergen and the datasets are available at https://services.healthtech.dtu.dk/services/NetAllergen-1.0/.
© The Author(s) 2023. Published by Oxford University Press.
Conflict of interest statement
None declared.
Figures
Similar articles
-
In silico tools to assess the potential allergenicity of shiitake mushrooms (Lentinula edodes).J Sci Food Agric. 2023 Jan 30;103(2):877-890. doi: 10.1002/jsfa.12199. Epub 2022 Sep 20. J Sci Food Agric. 2023. PMID: 36057923
-
AllerTOP--a server for in silico prediction of allergens.BMC Bioinformatics. 2013;14 Suppl 6(Suppl 6):S4. doi: 10.1186/1471-2105-14-S6-S4. Epub 2013 Apr 17. BMC Bioinformatics. 2013. PMID: 23735058 Free PMC article.
-
Identification of putative and potential cross-reactive chickpea (Cicer arietinum) allergens through an in silico approach.Comput Biol Chem. 2013 Dec;47:149-55. doi: 10.1016/j.compbiolchem.2013.08.003. Epub 2013 Sep 17. Comput Biol Chem. 2013. PMID: 24099701
-
Why are some proteins allergenic? Implications for biotechnology.Crit Rev Food Sci Nutr. 1996 Jul;36(6):553-64. doi: 10.1080/10408399609527739. Crit Rev Food Sci Nutr. 1996. PMID: 8841731 Review.
-
AllergenOnline: A peer-reviewed, curated allergen database to assess novel food proteins for potential cross-reactivity.Mol Nutr Food Res. 2016 May;60(5):1183-98. doi: 10.1002/mnfr.201500769. Epub 2016 Mar 3. Mol Nutr Food Res. 2016. PMID: 26887584 Review.
Cited by
-
Multimodal deep learning for allergenic proteins prediction.BMC Biol. 2025 Jul 31;23(1):232. doi: 10.1186/s12915-025-02347-z. BMC Biol. 2025. PMID: 40745646 Free PMC article.
-
SpanSeq: similarity-based sequence data splitting method for improved development and assessment of deep learning projects.NAR Genom Bioinform. 2024 Aug 16;6(3):lqae106. doi: 10.1093/nargab/lqae106. eCollection 2024 Sep. NAR Genom Bioinform. 2024. PMID: 39157582 Free PMC article.
-
The receiver operating characteristic curve accurately assesses imbalanced datasets.Patterns (N Y). 2024 May 31;5(6):100994. doi: 10.1016/j.patter.2024.100994. eCollection 2024 Jun 14. Patterns (N Y). 2024. PMID: 39005487 Free PMC article.
-
AutoEpiCollect, a Novel Machine Learning-Based GUI Software for Vaccine Design: Application to Pan-Cancer Vaccine Design Targeting PIK3CA Neoantigens.Bioengineering (Basel). 2024 Mar 27;11(4):322. doi: 10.3390/bioengineering11040322. Bioengineering (Basel). 2024. PMID: 38671743 Free PMC article.
References
-
- Altschul SF, Gish W, Miller W. et al. Basic local alignment search tool. J Mol Biol 1990;215:403–10. - PubMed
-
- Betts MJ, Russell RB.. Amino acid properties and consequences of substitutions. In: Barnes, M.R. and Gray, I.C. (eds) Bioinformatics for Geneticists. John Wiley & Sons, Ltd., 2003, 289–316.
LinkOut - more resources
Full Text Sources
Research Materials
