

Transcriptomic and metabolomic analyses to study the key role by which Ralstonia insidiosa induces Listeria monocytogenes to form suspended aggregates
- PMID: 37901811
- PMCID: PMC10601645
- DOI: 10.3389/fmicb.2023.1260909
Transcriptomic and metabolomic analyses to study the key role by which Ralstonia insidiosa induces Listeria monocytogenes to form suspended aggregates
Abstract
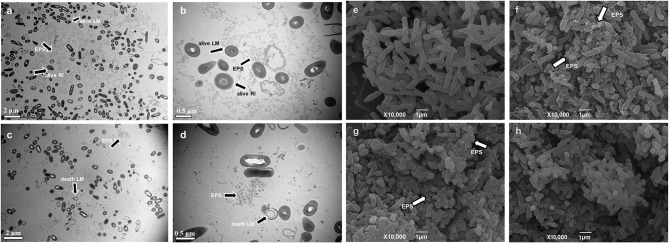
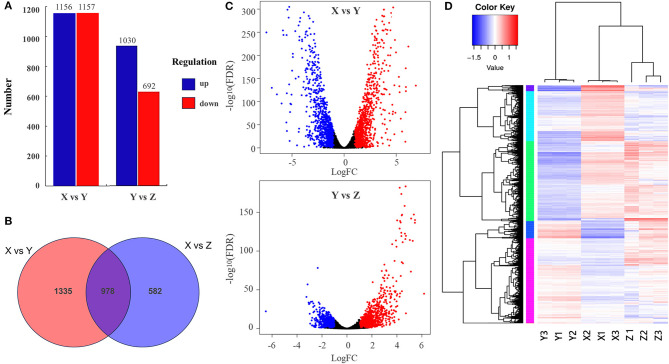
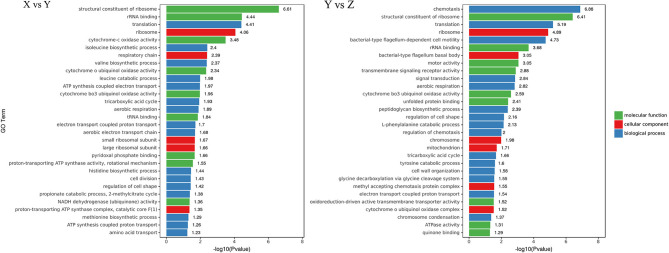
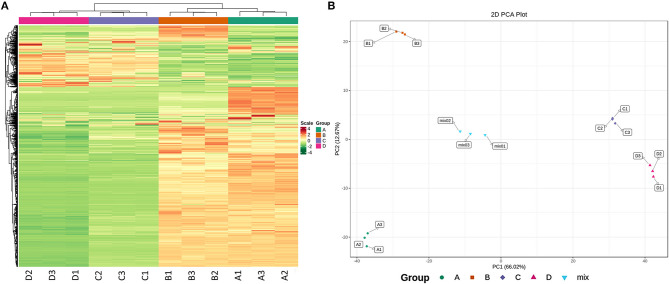
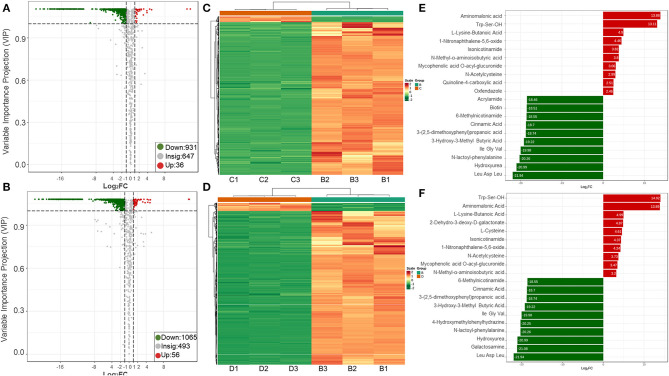
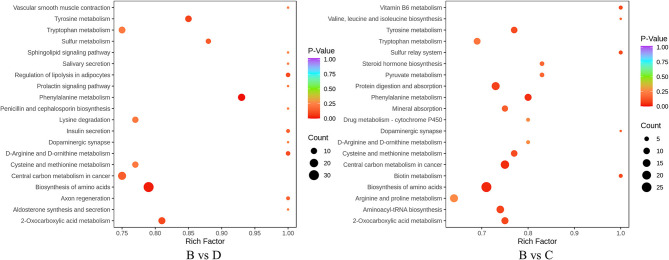
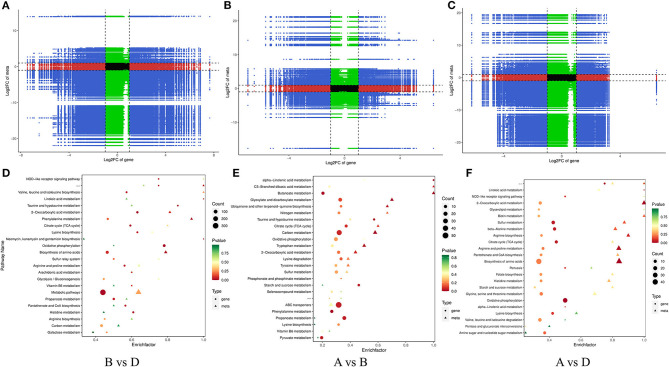
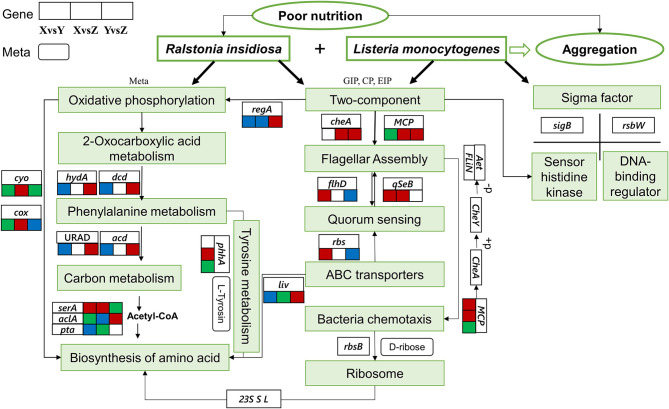
Ralstonia insidiosa can survive in a wide range of aqueous environments, including food processing areas, and is harmful to humans. It can induce Listeria monocytogenes to form suspended aggregates, resulting from the co-aggregation of two bacteria, which allows for more persistent survival and increases the risk of L. monocytogenes contamination. In our study, different groups of aggregates were analyzed and compared using Illumina RNA sequencing technology. These included R. insidiosa under normal and barren nutrient conditions and in the presence or absence of L. monocytogenes as a way to screen for differentially expressed genes (DEGs) in the process of aggregate formation. In addition, sterile supernatants of R. insidiosa were analyzed under different nutrient conditions using metabolomics to investigate the effect of nutrient-poor conditions on metabolite production by R. insidiosa. We also undertook a combined analysis of transcriptome and metabolome data to further investigate the induction effect of R. insidiosa on L. monocytogenes in a barren environment. The results of the functional annotation analysis on the surface of DEGs and qPCR showed that under nutrient-poor conditions, the acdx, puuE, and acs genes of R. insidiosa were significantly upregulated in biosynthetic processes such as carbon metabolism, metabolic pathways, and biosynthesis of secondary metabolites, with Log2FC reaching 4.39, 3.96, and 3.95 respectively. In contrast, the Log2FC of cydA, cyoB, and rpsJ in oxidative phosphorylation and ribosomal pathways reached 3.74, 3.87, and 4.25, respectively. Thirty-one key components were identified while screening for differential metabolites, which mainly included amino acids and their metabolites, enriched to the pathways of biosynthesis of amino acids, phenylalanine metabolism, and methionine metabolism. Of these, aminomalonic acid and Proximicin B were the special components of R. insidiosa that were metabolized under nutrient-poor conditions.
Keywords: Listeria monocytogenes; Ralstonia insidiosa; metabolome; sterile supernatants; suspended aggregates; transcriptome.
Copyright © 2023 Zuo, Chen, Zhang, Guo, Cheng and Zhang.
Conflict of interest statement
The authors declare that the research was conducted in the absence of any commercial or financial relationships that could be construed as a potential conflict of interest.
Figures


Similar articles
-
Gene Analysis of Listeria monocytogenes Suspended Aggregates Induced by Ralstonia insidiosa Cell-Free Supernatants under Nutrient-Poor Environments.Microorganisms. 2021 Dec 15;9(12):2591. doi: 10.3390/microorganisms9122591. Microorganisms. 2021. PMID: 34946191 Free PMC article.
-
Enhanced biofilm formation in dual-species culture of Listeria monocytogenes and Ralstonia insidiosa.AIMS Microbiol. 2017 Sep 11;3(4):774-783. doi: 10.3934/microbiol.2017.4.774. eCollection 2017. AIMS Microbiol. 2017. PMID: 31294188 Free PMC article.
-
Nosocomial bloodstream infection and the emerging carbapenem-resistant pathogen Ralstonia insidiosa.BMC Infect Dis. 2019 Apr 23;19(1):334. doi: 10.1186/s12879-019-3985-4. BMC Infect Dis. 2019. PMID: 31014269 Free PMC article.
-
A case of meningitis caused by Ralstonia insidiosa, a rare opportunistic pathogen.BMC Infect Dis. 2023 Aug 22;23(1):548. doi: 10.1186/s12879-023-08506-3. BMC Infect Dis. 2023. PMID: 37608277 Free PMC article. Review.
-
Ralstonia spp.: emerging global opportunistic pathogens.Eur J Clin Microbiol Infect Dis. 2014 Mar;33(3):291-304. doi: 10.1007/s10096-013-1975-9. Epub 2013 Sep 21. Eur J Clin Microbiol Infect Dis. 2014. PMID: 24057141 Review.
Cited by
-
Integrating multi-layered biological priors to improve genomic prediction accuracy in beef cattle.Biol Direct. 2024 Dec 31;19(1):147. doi: 10.1186/s13062-024-00574-y. Biol Direct. 2024. PMID: 39741345 Free PMC article.
-
Integrated Co-extraction Protocol for Transcriptomic and H NMR Metabolomic Analysis of Multi-species Biofilms.Bio Protoc. 2025 Mar 5;15(5):e5237. doi: 10.21769/BioProtoc.5237. eCollection 2025 Mar 5. Bio Protoc. 2025. PMID: 40084078 Free PMC article.
References
-
- Alaşehir E. A., Ipek B. Ö., Thomas D. T., Sitar M. E., Ercan T. E. (2020). Ralstonia insidiosa neonatal sepsis: a case report and review of the literature. J. Pediatr. Infect. Dis. 15, 148–151. 10.1055/s-0038-1648243 - DOI
-
- Anversa L., Romani C. D., Caria E. S., Saeki E. K., Nascentes G. A. N., Garbelotti M., et al. . (2022). Quality of dialysis water and dialysate in haemodialysis centres: highlight for occurrence of non-fermenting gram-negative bacilli. J. Appl. Microbiol. 132, 3416–3429. 10.1111/jam.15470 - DOI - PubMed
-
- Benjamini Y., Hochberg Y. (2000). On the adaptive control of the false discovery fate in multiple testing with independent statistics. J. Educ. Behav. Stat. 25, 60–83. 10.3102/10769986025001060 - DOI
-
- Biswas A., Chattopadhyay G. (2022). New results for adaptive false discovery rate control with p-value weighting. Stat. Pap. [Epub ahead of print]. 10.1007/s00362-022-01369-x - DOI
LinkOut - more resources
Full Text Sources
Molecular Biology Databases