

Luminal breast cancer identity is determined by loss of glucocorticoid receptor activity
- PMID: 37902007
- PMCID: PMC10701603
- DOI: 10.15252/emmm.202317737
Luminal breast cancer identity is determined by loss of glucocorticoid receptor activity
Abstract
Glucocorticoid receptor (GR) is a transcription factor that plays a crucial role in cancer biology. In this study, we utilized an in silico-designed GR activity signature to demonstrate that GR relates to the proliferative capacity of numerous primary cancer types. In breast cancer, the GR activity status determines luminal subtype identity and has implications for patient outcomes. We reveal that GR engages with estrogen receptor (ER), leading to redistribution of ER on the chromatin. Notably, GR activation leads to upregulation of the ZBTB16 gene, encoding for a transcriptional repressor, which controls growth in ER-positive breast cancer and associates with prognosis in luminal A patients. In relation to ZBTB16's repressive nature, GR activation leads to epigenetic remodeling and loss of histone acetylation at sites proximal to cancer-driving genes. Based on these findings, epigenetic inhibitors reduce viability of ER-positive breast cancer cells that display absence of GR activity. Our findings provide insights into how GR controls ER-positive breast cancer growth and may have implications for patients' prognostication and provide novel therapeutic candidates for breast cancer treatment.
Keywords: ZBTB16; breast cancer; glucocorticoids; luminal breast cancer subtypes; nuclear receptors.
© 2023 Netherlands Cancer Institute. Published under the terms of the CC BY 4.0 license.
Conflict of interest statement
SL receives research funding to her institution from Agendia, AstraZeneca, Eurocept pharmaceuticals, Genentech, GSK (formerly Tesaro), Immunomedics, Merck, Novartis, and Roche; has acted as a consultant (not compensated) for Cergentis and Philips Health; has acted as a consultant (paid to her institution) for AstraZeneca and IBM; and has received educational funding to her institution from Bayer and Daiichi‐Sankyo. In addition, SL has a patent UN23A01/P‐EP pending. Other authors declare no competing interests.
Figures
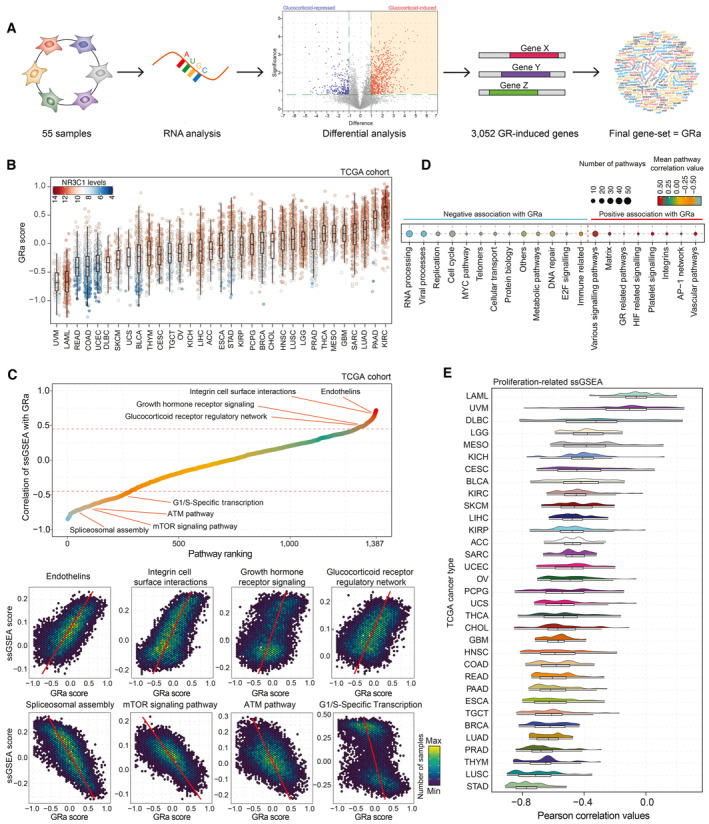
Schematic representation of GR activity signature development.
GR activity calculations for sample of the TCGA cohort (n = 9,874) split by cancer type. Color of each data point represents NR3C1 mRNA levels (red, white, and blue represent high, intermediate, and low levels, respectively). The box begins in the first quartile (25%) and ends in the third (75%), while the line represents the median value. The lines represent segments to furthest data without accounting for outliers.
(top) Correlation analysis of single‐sample gene‐set enrichment analysis (ssGSEA) scores calculated per TCGA sample (n = 9,829), and GR activity, with several top pathways highlighted. (bottom) Pearson correlation plots depicting pathway scores and GR activity for pathways highlighted in the panel above. Each hex represents a group of patients with similar values, and the color of the hex represents how many samples fall into that particular space.
Significantly correlating single‐sample GSEA families (number of pathways grouped is reflected by the point size) with the average correlation with GR activity signature reported as a color gradient. Only pathway families with strong Pearson correlation are displayed (R < −0.45 or > 0.45).
Distribution of Pearson correlation values for all the proliferation‐related ssGSEA signatures and GR activity for each TCGA tumor type independently. Under the distribution graph, a boxplot is depicted. The box itself spans from the first quartile (25%) to the third quartile (75%), representing the interquartile range where the central 50% of data values fall. Inside the box, a line denotes the median value. The whiskers of the boxplot extend from the ends of the box to the minimum and maximum values.
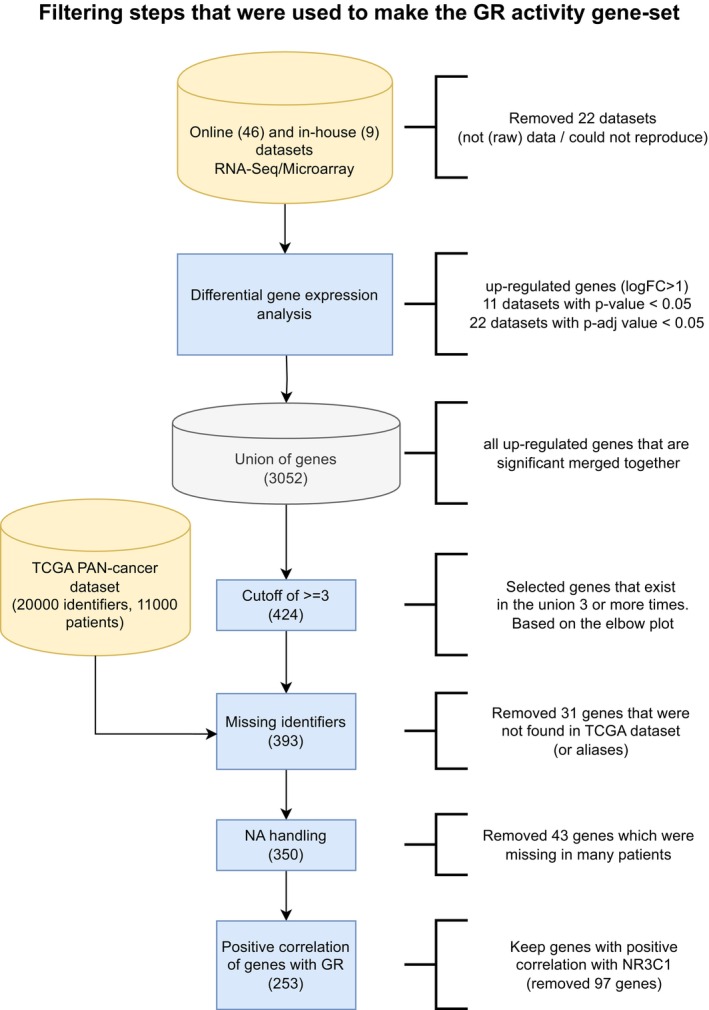
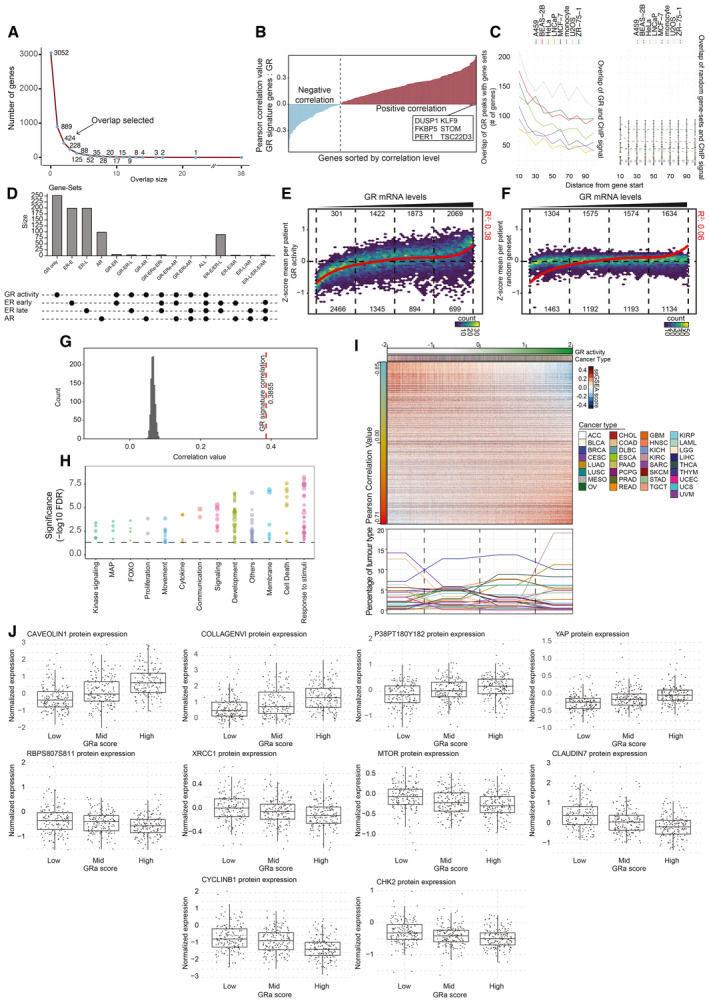
Elbow plot depicting overlap between models. This analysis aided refinement of the signature to a consensus list of number of genes shared among at least three independent models, yielding a total list of 424 genes.
Expression correlation analyses of NR3C1 mRNA levels with expression levels of genes represented in the signature in cancer samples. Only positively correlating genes were included for further analyses, yielding a final set of 253 genes.
Enrichment of GR binding in vicinity of GRa (right, full line) or random (left, dashed line; n = 1,000 iterations; error bars represent mean ± SD) genes in ChIP‐sequencing experiments from various cell lines (full lines, A549, BEAS‐2B, HeLa, LNCaP, MCF‐7, THP1, U2OS, and ZR‐75‐1).
Overlap of GR activity signature, with ER (gene‐set reference: M5906 and M5907) and AR (gene‐set reference: M5908) gene signatures.
Correlation of NR3C1 mRNA levels with GR activity across samples represented in the TCGA dataset. Color indicates the number of samples in each bin.
Correlation of GR mRNA levels with random gene set of equivalent size to GR activity signature among samples represented in the TCGA dataset. Color indicates the number of samples in each bin.
Histogram depicting correlation of random gene set of equivalent size to GR activity signature with NR3C1 mRNA levels in TCGA cancers; black line depicts the correlation of GR activity with NR3C1 mRNA levels in the same cohort.
Overrepresentation analysis of various gene sets within the GR activity signature. Each point represents a different pathway.
Pearson correlation analysis of single‐sample gene‐set enrichment analysis (ssGSEA) scores for each of the TCGA samples (n = 9,829) and GR activity. Representation of the different tumor types is depicted below.
Normalized (phospho)protein expression in human breast cancer samples of the TCGA (n = 747) grouped based on GR activity. The central mark indicates the median, and the bottom and top edges of the box indicate the 25th and 75th percentiles, respectively. The maximum whisker lengths are specified as 1.5 times the interquartile range.
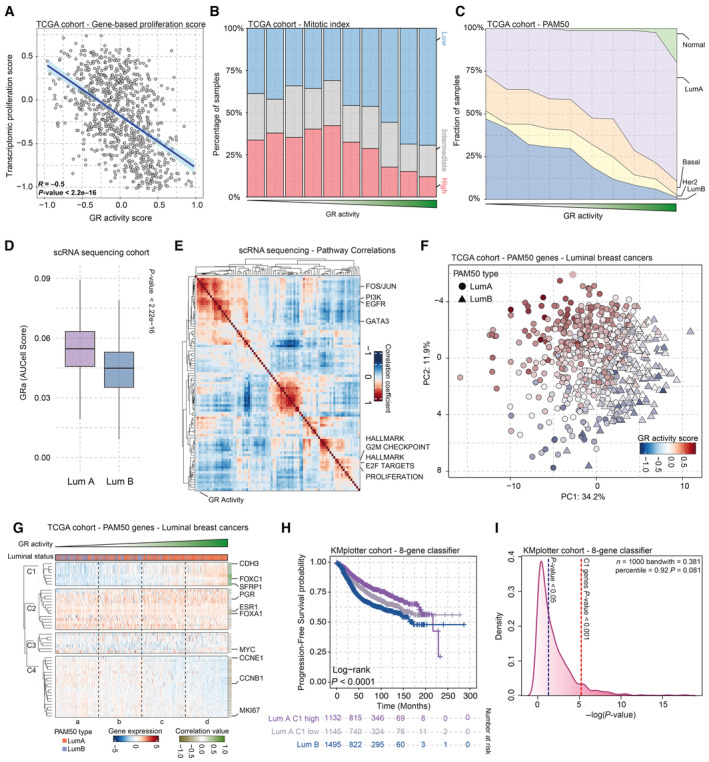
Scatterplot depicting the inverse correlation of GR activity signature with transcriptomic cell proliferation gene set in breast cancer samples of the TCGA. n = 628.
Pathological mitotic index analyses in breast cancer, relative to GR activity signature split in deciles, depicted as percentage of samples with low, intermediate, and high mitotic scores. High GR activity score is associated with low tumor cell mitotic index.
Distribution of PAM50 molecular breast cancer subtypes in relation to GR activity levels, in the TCGA cohort. High GR activity is associated with enrichment of luminal A breast cancers, while low GR activity is associated with luminal B tumors. n = 850.
Single‐cell RNA‐sequencing analyses, exclusively analyzing tumor cells. Higher level of GR activity is found in Luminal A (Lum A; n = 7,943) cells than in Luminal B (Lum B; n = 4,204) cells. The box begins in the first quartile (25%) and ends in the third (75%), while the line represents the median value. The lines represent segments to furthest data without accounting for outliers. P‐values were determined by the Wilcoxon t‐test.
Pearson correlation heatmap of various pathways including GR activity signature based on data of single‐cell RNA sequencing of cells annotated with Luminal A and B cancer cells. The pathway enrichment scores were calculated using AUCell.
PCA analyses of bulk RNA‐sequencing data, focused on PAM50 genes. GR activity separates the ER‐positive breast cancers on PAM50‐based Luminal A (LumA—circle) and B (LumB—triangle) status. n = 613.
k‐Means clustering analysis of luminal breast cancer samples based on PAM50 genes. n = 613.
Progression‐free survival probabilities of breast cancer patients (n = 3,772) grouped by transcriptomics‐based 8‐gene classifier (Luminal A high expression = purple, Luminal A low expression = gray, and Luminal B = blue). Progression‐free survival probabilities in months are plotted for each group, and censored patients are shown as vertical tick marks.
Prognostic power as determined by SigCheck of the 8‐gene classifier (red dotted line) with 1,000 random gene sets of the same size (P‐value < 0.05 is indicated by the blue dotted line) for progression‐free survival parameter in KMplot breast cancer cohort (n = 3,772).
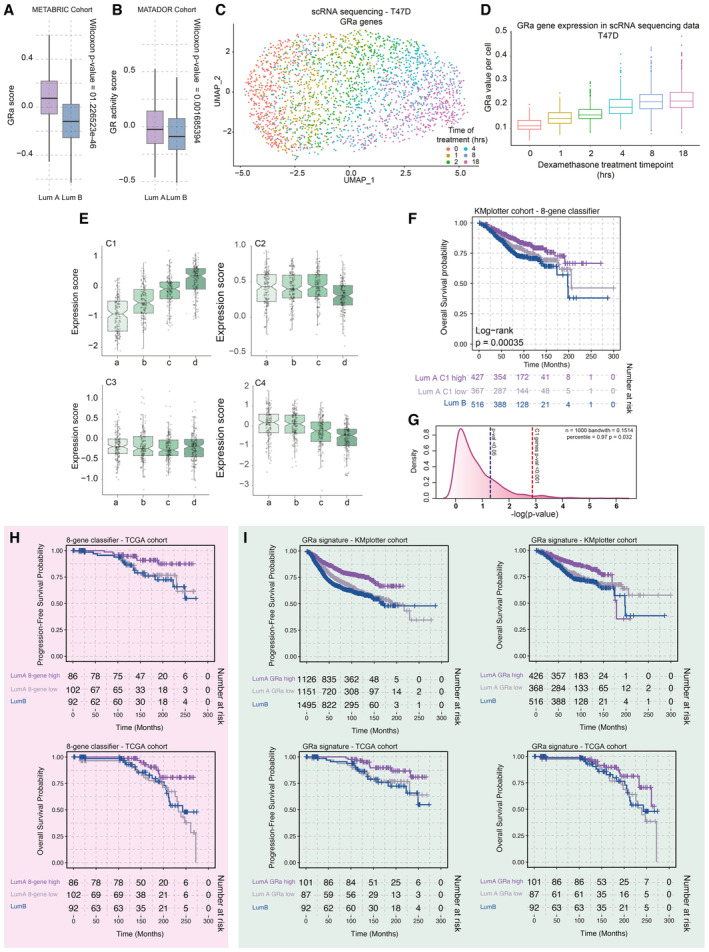
Boxplots depicting GR activity signature in Luminal A and B cancers of the METABRIC cohort (n = 1,134 luminal samples). The box begins in the first quartile (25%) and ends in the third (75%), while the line represents the median value. The lines represent segments to furthest data without accounting for outliers. P‐values were determined by the Wilcoxon t‐test.
Boxplots depicting GR activity signature in Luminal A and B cancers of the MATADOR trial (n = 415 luminal samples). P‐values were determined by the Wilcoxon t‐test. The box begins in the first quartile (25%) and ends in the third (75%), while the line represents the median value. The lines represent segments to furthest data without accounting for outliers.
The UMAP analysis of time‐course experiments performed with T47D cell line utilizing the GRa genes. Each cell is colored according to the treatment time points—0, 1, 2, 4, 8, and 18 h.
Boxplot depicting the value of GR activity per cell per time point of the time course (400 cells). The central mark indicates the median, and the bottom and top edges of the box indicate the 25th and 75th percentiles, respectively. The lines represent segments to furthest data without accounting for outliers.
Average gene expression of genes corresponding to clusters identified by k‐means clustering of PAM50 genes in luminal breast cancer patient samples. The box begins in the first quartile (25%) and ends in the third (75%), while the line represents the median value. The lines represent segments to furthest data without accounting for outliers.
Overall survival probabilities of breast cancer patients (n = 1,310) grouped by transcriptomics‐based 8‐gene classifier (Luminal A high expression = purple, Luminal A low expression = gray, and Luminal B = blue). Overall survival probabilities in months are plotted for each group, and censored patients are shown as vertical tick marks.
Prognostic power as determined by SigCheck of the 8‐gene classifier (red dotted line) with 1,000 random gene sets of the same size (P‐value < 0.05 is indicated by the blue dotted line) for overall survival parameter in KMplotter breast cancer cohort (n = 1,310).
Overall survival probabilities of breast cancer patients (TCGA cohort n = 280) grouped by transcriptomics‐based 8‐gene classifier (Luminal A high expression = purple, Luminal A low expression = gray, and Luminal B = blue). Overall survival probabilities in months are plotted for each group, and censored patients are shown as vertical tick marks. First 300 months were included in the analysis.
Overall survival probabilities of breast cancer patients (KMplotter cohort n = 3,772; TCGA cohort n = 280) grouped by GR activity signature (Luminal A high expression = purple, Luminal A low expression = gray, and Luminal B = blue). Overall survival probabilities in months are plotted for each group, and censored patients are shown as vertical tick marks. First 300 months were included in the analysis.
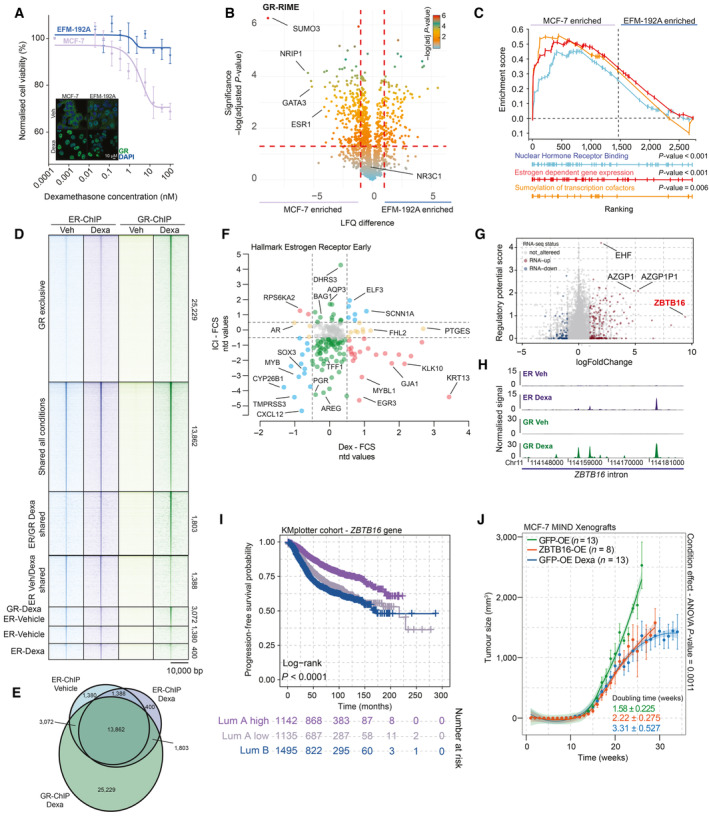
Normalized cancer cell viability in response to glucocorticoid (Dexa) treatment. While EFM‐192A cells (Luminal B) are not affected in their viability following GR activation, MCF‐7 (luminal A) viability was decreased after GR activation, in a dose‐dependent manner. n = 4. Mean values ± SEM depicted. In the bottom left corner is a representative immunofluorescence image depicting staining of GR (green) and DAPI (blue) in Luminal A cell line MCF‐7 and Luminal B cell line EFM‐192A. In both cell lines, GR is readily expressed and readily translocated to the nucleus following activation by Dexa. n = 3.
Volcano plot depicting differentially enriched interactors in GR‐RIME experiments between MCF‐7 and EFM‐192A cell lines. n = 3. P‐values were determined by two‐sided t‐test.
Nuclear hormone receptor binding (gene‐set reference: GO:0035257), estrogen‐dependent gene expression (gene‐set reference: R‐HSA‐9018519), and sumoylation of transcription factors (gene‐set reference: R‐HSA‐3232118) GSEA enrichment profiles based on GR‐RIME data comparison between MCF‐7 and EFM‐192 cell lines. n = 4.
Heatmap of ChIP‐sequencing signal for ER and GR around peak midpoint for all sites detected across the genome in Veh and Dexa conditions. n = 3.
Venn diagram, depicting shared and unique ChIP‐sequencing‐detected binding sites for ER and GR, in the absence or presence of Dexa. n = 3.
Effect of ICI (y‐axis) and Dexa (x‐axis) treatment on expression of ER targets, determined in an RNA‐sequencing experiment. n = 3.
Regulatory potential analysis of Dexa‐induced ER‐binding sites in relation to gene regulation by Dexa. Genes not altered by Dexa are colored gray, while the up‐ and downregulated genes are depicted as red and blue points, respectively. n = 3.
Normalized ChIP signal for ER (top, purple) and GR (bottom, green) at ZBTB16 in MCF‐7 cell line, untreated (Veh) or glucocorticoid treated (Dexa). N = 3.
Progression‐free survival probabilities of breast cancer patients (n = 3,772) grouped by ZBTB16 mRNA expression (Luminal A high expression = purple, Luminal A low expression = gray, and LUMINAL B = blue). Progression‐free survival probabilities in months are plotted for each group, and censored patients are shown as vertical tick marks.
Normalized tumor growth in xenograft, mammary intraductal models of MCF‐7 cells overexpressing V5‐GFP (green = Veh; blue = Dexa) or V5‐ZBTB16 (orange) in NOD‐SCID‐γ mice. Arrows indicate when treatment was initiated for the Dexa‐treated group. Mean values ± SEM depicted (GFP Veh n = 13, GFP Dexa n = 13, and ZBTB16 n = 8 animals). Condition effect P‐value was determined by mixed‐model ANOVA (Tukey's multiple‐comparison test).
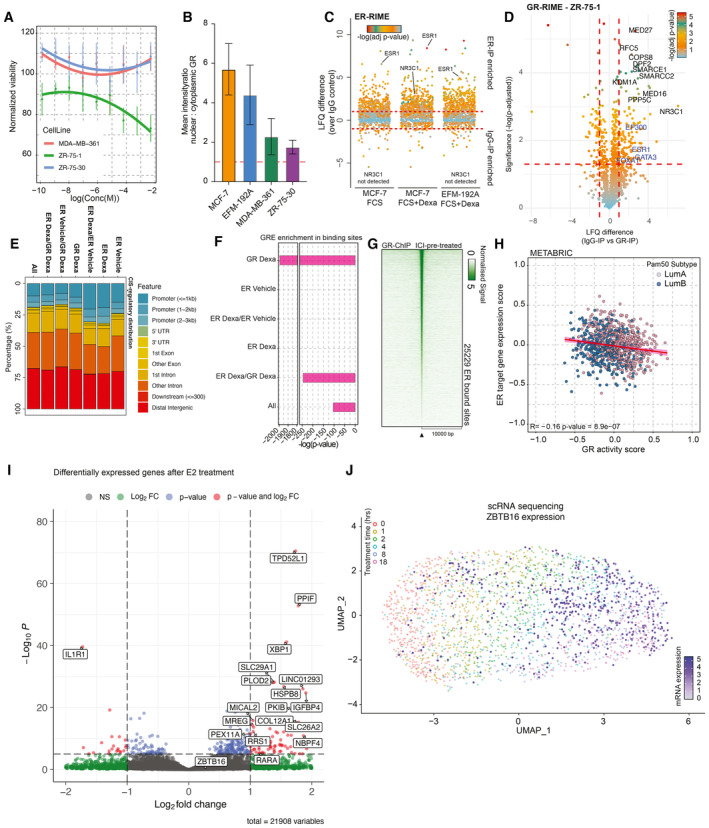
Normalized cancer cell viability (lines depict polynomial fit) in response to GR agonist (Dexa) treatment. n = 4. Mean values ± SEM depicted.
Bar plot depicting nuclear‐to‐cytoplasmic ratio of GR in various cell lines. n = 3. Mean values ± SEM depicted.
Jitter plot depicting differentially enriched interactors in ER‐RIME experiments between Veh‐treated MCF‐7 and Dexa‐treated MCF‐7 and EFM‐192A cell lines. n = 4. P‐values were determined by two‐sided t‐test.
Volcano plot depicting enriched (in comparison to IgG‐IP control) interactors in GR‐RIME experiments in ZR‐75‐1 cell line. n = 3. P‐values were determined by two‐sided t‐test.
Genomic distribution analyses for all the sites detected in ChIP‐sequencing experiments. n = 3.
HOMER motif analysis of P‐value for GREs across different categories of sites.
Heatmap of ChIP‐sequencing signal for GR around peak midpoint for all sites detected across the genome after 24 h pre‐treatment with ICI and subsequent 2 h treatment with Dexa. n = 3.
Scatterplot depicting the absence of correlation of GR activity with ER target gene expression in luminal breast cancers.
Volcano plot depicting transcriptomic differences between DCC‐treated and DCC+E2‐treated MCF‐7 (n = 4). Adjusted P‐values were determined by DESeq2 (Wald test P‐values corrected for multiple testing using Benjamini and Hochberg method).
The UMAP analysis of time‐course experiments performed with T47D cell line utilizing the GRa genes. Each cell is colored according to the treatment time points—0, 1, 2, 4, 8, and 18 h, and the values of ZBTB16 gene expression are projected on top (white‐to‐blue gradient).
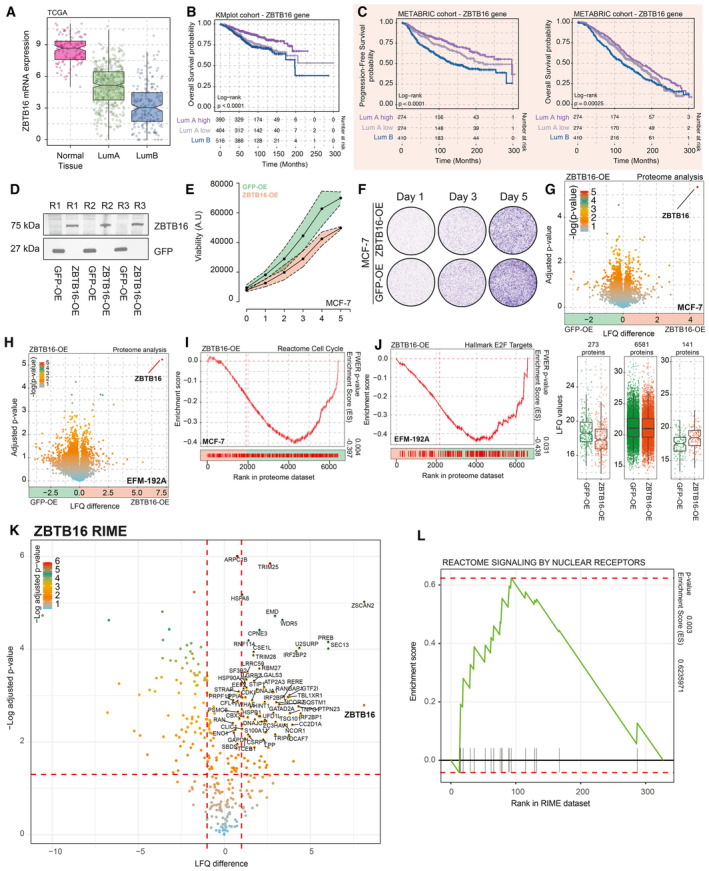
Boxplot depicting ZBTB16 mRNA expression in normal breast tissues, Luminal A, as well as Luminal B cancer samples (TCGA cohort n = 702). The box begins in the first quartile (25%) and ends in the third (75%), while the line represents the median value. The lines represent segments to furthest data without accounting for outliers.
Overall survival probabilities of breast cancer patients (KMplotter meta dataset; n = 1,310) grouped by ZBTB16 mRNA expression (Luminal A high expression = purple, Luminal A low expression = gray, and Luminal B = blue). Overall survival probabilities in months are plotted for each group, and censored patients are shown as vertical tick marks.
Progression‐free and overall survival probabilities of breast cancer patients (METABRIC dataset) grouped by ZBTB16 mRNA expression (Luminal A high expression = purple, Luminal A low expression = gray, and Luminal B = blue). Progression‐free and overall survival probabilities in months are plotted for each group, censored patients are shown as vertical tick marks.
Western blot showing expression of V‐5‐tagged GFP and ZBTB16. n = 3.
Normalized cancer cell viability for MCF‐7 GFP (green) and ZBTB16 (orange) overexpression models. n = 4.
Representative crystal violet assay image for MCF‐7 GFP and ZBTB16 overexpression models. n = 3.
Upper panel, volcano plot depicting differences in protein expression between GFP‐OE and ZBTB16‐OE models in MCF‐7 cells. Significance is depicted as a color gradient; lower panel, intensity (LFQ) values per category (decrease in expression, same levels, and increase in expression upon ZBTB16 overexpression). n = 4. The box begins in the first quartile (25%) and ends in the third (75%), while the line represents the median value. The lines represent segments to furthest data without accounting for outliers.
Volcano plot depicting differences in protein expression between GFP‐OE and ZBTB16‐OE models in EFM‐192A cells. n = 4.
Reactome cell cycle (gene‐set reference: R‐HSA‐1640170) GSEA enrichment profiles based on whole‐proteome data comparison between GFP‐OE and ZBTB16‐PE in MCF‐7 cell line.
Hallmark E2F targets (gene‐set reference: M5925) GSEA enrichment profiles based on whole‐proteome data comparison between GFP‐OE and ZBTB16‐PE in EFM‐192A cell line.
Volcano plot depicting differentially enriched (over IgG control) interactors in ZBTB16‐RIME experiments in MCF‐7 cells. n = 4. P‐values were determined by two‐sided t‐test.
GSEA enrichment profiles for “Reactome Signaling by nuclear receptors” gene sets based on IgG versus ZBTB‐16 RIME comparison (n = 4).
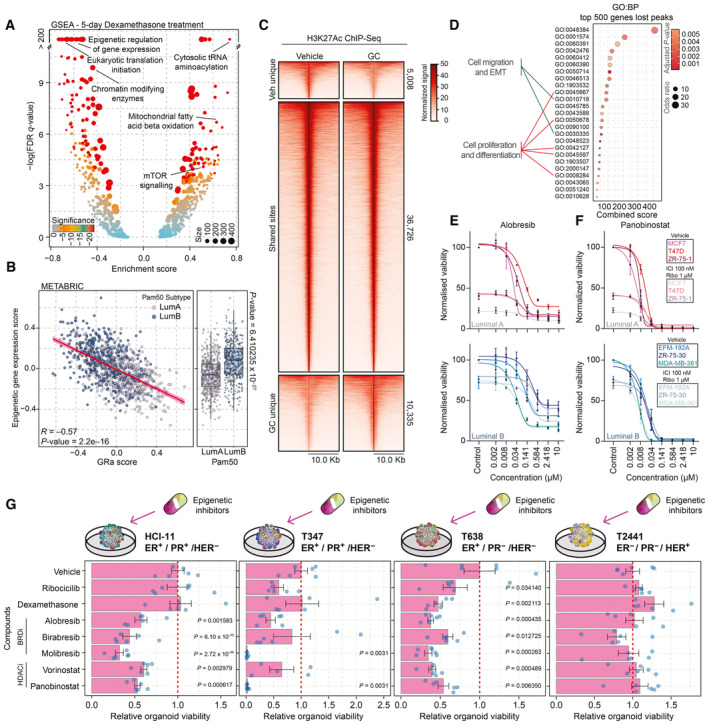
Volcano plot depicting GSEA results of whole‐proteome data corresponding to 5‐day Dexa treatment of MCF‐7 cells. Significance is depicted as a color gradient, and the size of the dots represents the size of the gene set. n = 4.
Scatterplot showing correlation of GR activity signature with the mean expression of various epigenetic regulators (gene‐set reference: R‐HSA‐212165) in luminal breast cancer samples of the METABRIC cohort. n = 958. Pearson R‐ and P‐value are reported.
Heatmap of H3K27Ac ChIP‐seq signal in MCF‐7 cells treated with vehicle or Dexa for 7 days. Data are centered at H3K27Ac peaks, depicting a ±10 kb window around the peak center. Data represent the average of three biological replicates.
Pathway overrepresentation analysis (GO:BP) for the top 500 genes found to be potentially regulated by the vehicle unique H3K27Ac peaks. Significant pathways are depicted, and pathways involved in cell migration and EMT as well as cell proliferation and differentiation are highlighted.
Normalized cancer cell viability of Luminal A (MCF‐7, T47D, and ZR‐75‐1) and Luminal B (EFM‐192A, ZR‐75‐30, and MDA‐MB‐361) cell lines in response to BRD inhibitor (Alobresib) treatment. Treatment lasted for 5 days. n = 4. Lines (sigmoidal fit) and mean value ± SEM depicted.
Normalized cancer cell viability of Luminal A (MCF‐7, T47D, and ZR‐75‐1) and Luminal B (EFM‐192A, ZR‐75‐30, and MDA‐MB‐361) cell lines in response to HDAC inhibitor (Panobinostat) treatment. Treatment lasted for 5 days. n = 4. Lines (sigmoidal fit) and mean value ± SEM depicted.
Bar chart showing response to various compounds for four breast cancer organoid lines (HCI‐11, T347, T638, and T2441) alongside key tumor characteristics displayed on top of the graphs. Drug concentrations (dexamethasone 100 nM, ribociclib 1,000 nM, alobresib 100 nM, birabresib 500 nM, vorinostat 500 nM, panobinostat 10 nM, and molibresib 500 nM). n = 6. Error bars represent mean ± SEM. P‐values were determined by Dunnett's test and only displayed if under the P‐value of 0.05 cutoff.
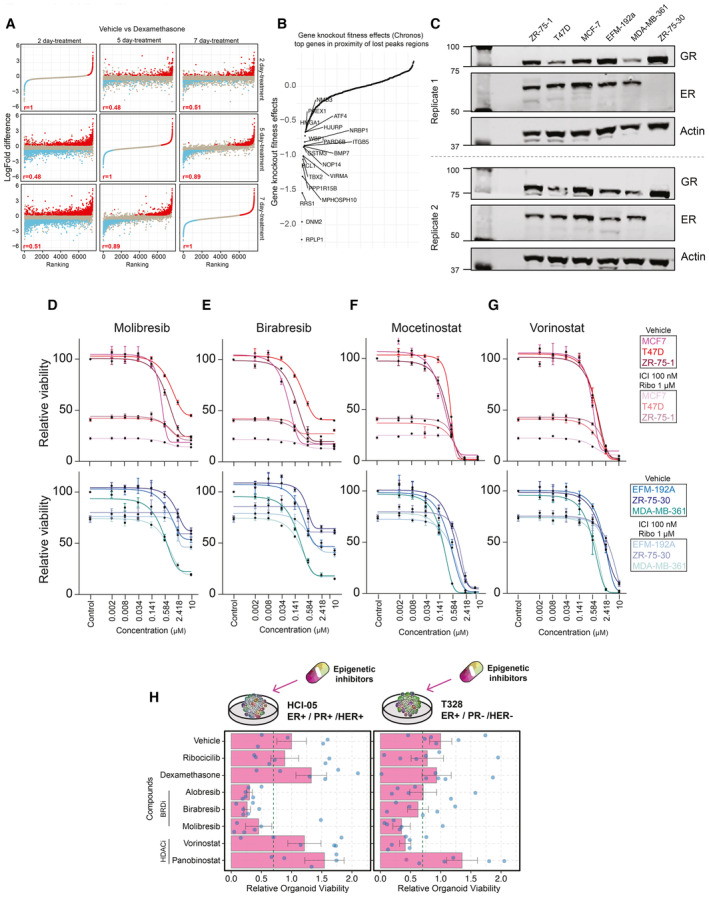
Comparison of Dexa‐induced proteomic changes in proteomics experiments across different time points (2‐ vs. 5‐ vs. 7‐day treatment). n = 4. Adjusted P‐values (Padj) were determined by t‐test (P‐values corrected for multiple testing using Benjamini and Hochberg method). Pearson correlation value is reported.
Snake plot depicting the gene knockout fitness effects (Chronos) for top genes potentially regulated by vehicle unique H3K27Ac sites.
Western blot showing expression of GR and ER in all the breast cancer cell line models used in the manuscript, with actin as a loading control (n = 2).
Normalized cancer cell viability in response to BRD inhibitor (Molibresib) treatment. n = 4.
Normalized cancer cell viability in response to BRD inhibitor (Birabresib) treatment. n = 4.
Normalized cancer cell viability in response to HDAC inhibitor (Mocetinostat) treatment. n = 4.
Normalized cancer cell viability in response to HDAC inhibitor (Vorinostat) treatment. n = 4.
Bar chart showing response to various inhibitors for each of the organoid lines alongside key tumor characteristics. Drug concentrations (dexamethasone 100 nM, ribociclib 1,000 nM, alobresib 100 nM, birabresib 500 nM, vorinostat 500 nM, panobinostat 10 nM, and molibresib 500 nM). Error bars represent mean ± SEM. n = 6.
Comment in
-
Estrogen receptor- and progesterone receptor-positive breast tumors have higher mRNA levels of NR3C1 and ZBTB16, with implications in prognosis for luminal A subtype.Hum Cell. 2024 Jan;37(1):376-379. doi: 10.1007/s13577-023-01014-1. Epub 2023 Nov 24. Hum Cell. 2024. PMID: 37999919 No abstract available.
References
-
- Barna M, Merghoub T, Costoya JA, Ruggero D, Branford M, Bergia A, Samori B, Pandolfi PP (2002) Plzf mediates transcriptional repression of HoxD gene expression through chromatin remodeling. Dev Cell 3: 499–510 - PubMed
-
- Buxant F, Engohan‐Aloghe C, Noël J (2010) Estrogen receptor, progesterone receptor, and glucocorticoid receptor expression in normal breast tissue, breast in situ carcinoma, and invasive breast cancer. Appl Immunohistochem Mol Morphol 18: 254–257 - PubMed
-
- Colleoni M, Sun Z, Price KN, Karlsson P, Forbes JF, Thürlimann B, Gianni L, Castiglione M, Gelber RD, Coates AS (2016) Annual hazard rates of recurrence for breast cancer during 24 years of follow‐up: results from the international breast cancer study group trials I to V. J Clin Oncol 34: 927–935 - PMC - PubMed
Publication types
MeSH terms
Substances
Associated data
- Actions
Grants and funding
LinkOut - more resources
Full Text Sources
Medical
Molecular Biology Databases
