Skeletal muscle myosin heavy chain expression and 3D capillary network changes in streptozotocin-induced diabetic female mice
- PMID: 37902457
- PMCID: PMC11088899
- DOI: 10.17305/bb.2023.9843
Skeletal muscle myosin heavy chain expression and 3D capillary network changes in streptozotocin-induced diabetic female mice
Abstract
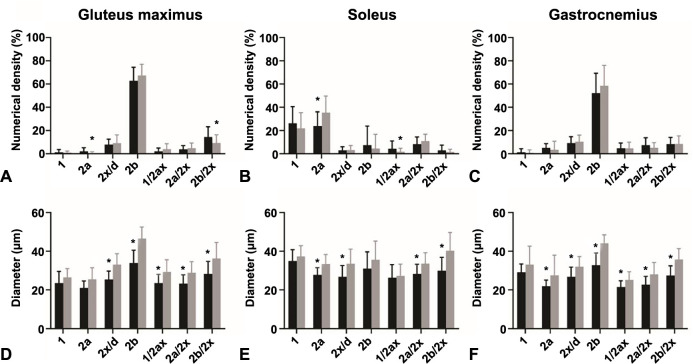
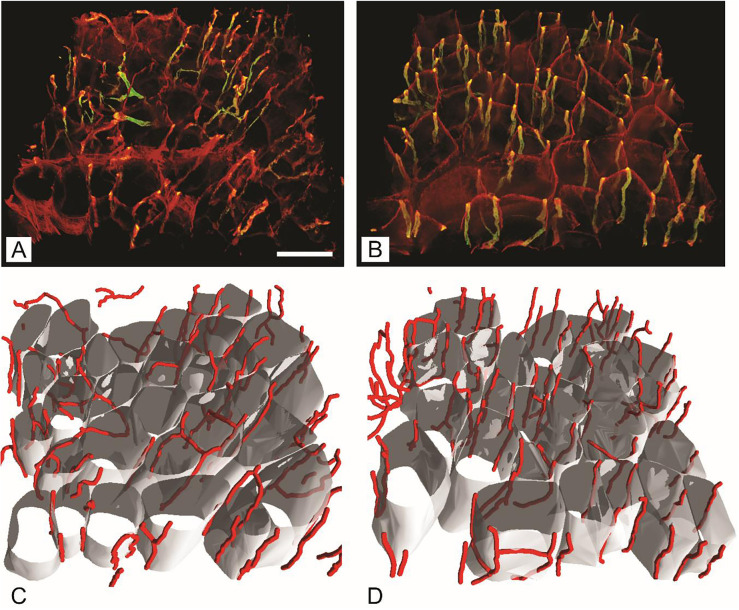
It is not well-understood how type 1 diabetes (T1DM) affects skeletal muscle histological phenotype, particularly capillarisation. This study aimed to analyze skeletal muscle myosin heavy chain (MyHC) fibre type changes and 3D capillary network characteristics in experimental T1DM mice. Female C57BL/6J-OlaHsd mice were categorized into streptozotocin (STZ)-induced diabetic (n = 12) and age-matched non-diabetic controls (n =12). The muscle fibre phenotype of the soleus, gluteus maximus, and gastrocnemius muscles were characterized based on the expression of MyHC isoforms, while capillaries of the gluteus maximus were assessed with immunofluorescence staining, confocal laser microscopy and 3D image analysis. STZ-induced diabetic mice exhibited elevated glucose levels, reduced body weight, and prolonged thermal latency, verifying the T1DM phenotype. In both T1DM and non-diabetic mice, the gluteus maximus and gastrocnemius muscles predominantly expressed fast-twitch type 2b fibers, with no significant differences noted. However, the soleus muscle in non-diabetic mice had a greater proportion of type 2a fibers and comparable type 1 fiber densities (26.2 ± 14.6% vs 21.9 ± 13.5%) relative to diabetic mice. T1DM mice showed reduced fiber diameters (P = 0.026), and the 3D capillary network analysis indicated a higher capillary length per muscle volume in the gluteus maximus of diabetic mice compared to controls (P < 0.05). Overall, T1DM induced significant changes in the skeletal muscle, including shifts in MyHC fibre types, decreased fibre diameters, and increased relative capillarisation, possibly due to muscle fibre atrophy. Our findings emphasize the superior detail provided by the 3D analytical method for characterizing skeletal muscle capillary architecture, highlighting caution in interpreting 2D data for capillary changes in T1DM.
Conflict of interest statement
Conflicts of interest: Authors declare no conflicts of interest.
Figures
Similar articles
-
3D analysis of capillary network in skeletal muscle of obese insulin-resistant mice.Histochem Cell Biol. 2019 Nov;152(5):323-331. doi: 10.1007/s00418-019-01810-7. Epub 2019 Aug 31. Histochem Cell Biol. 2019. PMID: 31473807
-
Myosin isoforms and muscle fiber characteristics in equine gluteus medius muscle.Anat Rec. 1996 Apr;244(4):444-51. doi: 10.1002/(SICI)1097-0185(199604)244:4<444::AID-AR3>3.0.CO;2-V. Anat Rec. 1996. PMID: 8694280
-
Diabetic myopathy differs between Ins2Akita+/- and streptozotocin-induced Type 1 diabetic models.J Appl Physiol (1985). 2009 May;106(5):1650-9. doi: 10.1152/japplphysiol.91565.2008. Epub 2009 Feb 26. J Appl Physiol (1985). 2009. PMID: 19246652
-
Capillary supply in relation to myosin heavy chain fibre composition of human intrinsic tongue muscles.Cells Tissues Organs. 2010;192(5):303-13. doi: 10.1159/000318645. Epub 2010 Jul 8. Cells Tissues Organs. 2010. PMID: 20616532
-
Characterization of the capillary network in skeletal muscles from 3D data.Physiol Res. 2011;60(1):1-13. doi: 10.33549/physiolres.931988. Epub 2010 Oct 15. Physiol Res. 2011. PMID: 20945967 Review.
Cited by
-
Perfusion Staining Methods for Visualization of Intact Microvascular Networks in Whole Mount Skeletal Muscle Preparations.J Vasc Res. 2025;62(1):37-50. doi: 10.1159/000542663. Epub 2024 Nov 19. J Vasc Res. 2025. PMID: 39561724 Free PMC article.
-
Fiber-type composition and 3D capillary analysis of the human splenius capitis muscle.Biomol Biomed. 2025 Apr 26;25(6):1351-1361. doi: 10.17305/bb.2024.10787. Biomol Biomed. 2025. PMID: 39340391 Free PMC article.
-
Cilostazol Ameliorates Motor Dysfunction and Schwann Cell Impairment in Streptozotocin-Induced Diabetic Rats.Int J Mol Sci. 2024 Jul 18;25(14):7847. doi: 10.3390/ijms25147847. Int J Mol Sci. 2024. PMID: 39063088 Free PMC article.
References
-
- Aughsteen AA, Billah Khair AM, Suleiman AA. Quantitative morphometric study of the skeletal muscles of normal and streptozotocin-diabetic rats. J Pancreas [Internet] 2006;7:382–9. Available from: http://www.joplink.net. - PubMed
-
- Ndisang JF, Vannacci A, Rastogi S. Insulin resistance, type 1 and type 2 diabetes, and related complications 2017. J Diabetes Res. 2017;2017:1–3. https://doi.org/10.1155/2017/1478294. - PMC - PubMed
-
- Kaul K, Apostolopoulou M, Roden M. Insulin resistance in type 1 diabetes mellitus. Metab Clin Exp. 2015;64:1629–39. https://doi.org/10.1016/j.metabol.2015.09.002. - PubMed
-
- Katsarou A, Gudbjörnsdottir S, Rawshani A, Dabelea D, Bonifacio E, Anderson BJ, et al. Type 1 diabetes mellitus. Nat Rev Dis Primers. 2017 Mar 30;3(1):17016. https://doi.org/10.1038/nrdp.2017.16. - PubMed
-
- Fazakerley DJ, Krycer JR, Kearney AL, Hocking SL, James DE. Muscle and adipose tissue insulin resistance: malady without mechanism? J Lipid Res. 2019 Oct;60(10):1720–32. https://doi.org/10.1194/jlr.R087510. - PMC - PubMed