. 2024 Jan 12;14(1):158-175.
doi: 10.1158/2159-8290.CD-23-0437.

GTP Signaling Links Metabolism, DNA Repair, and Responses to Genotoxic Stress

Affiliations

GTP Signaling Links Metabolism, DNA Repair, and Responses to Genotoxic Stress

Weihua Zhou et al. Cancer Discov. .

Abstract

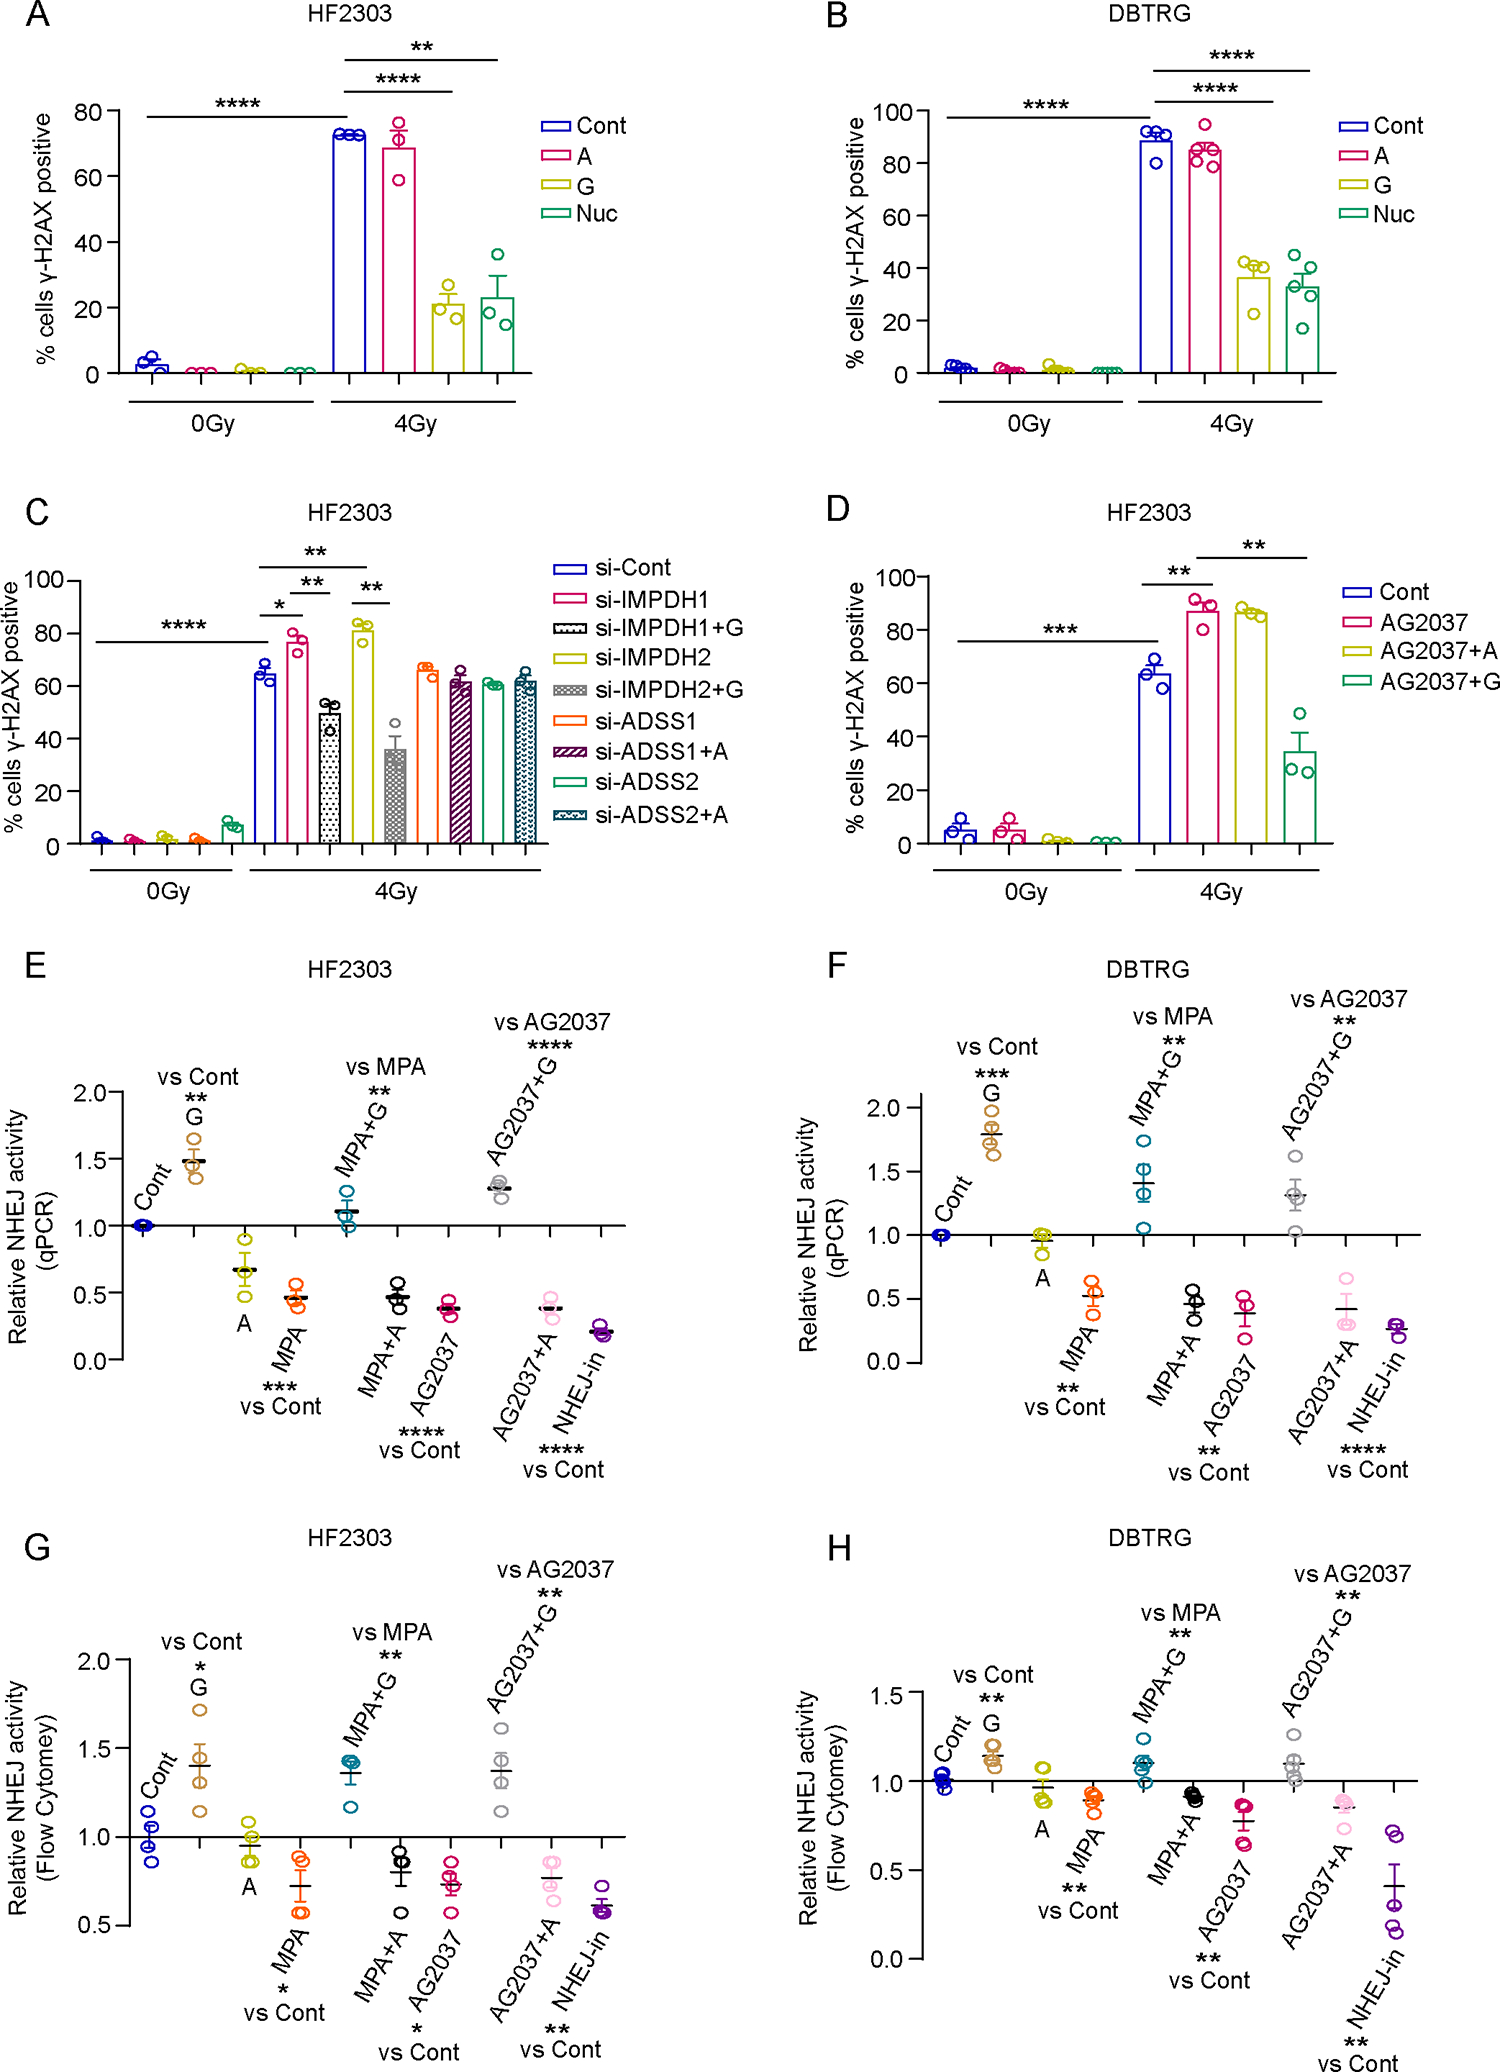
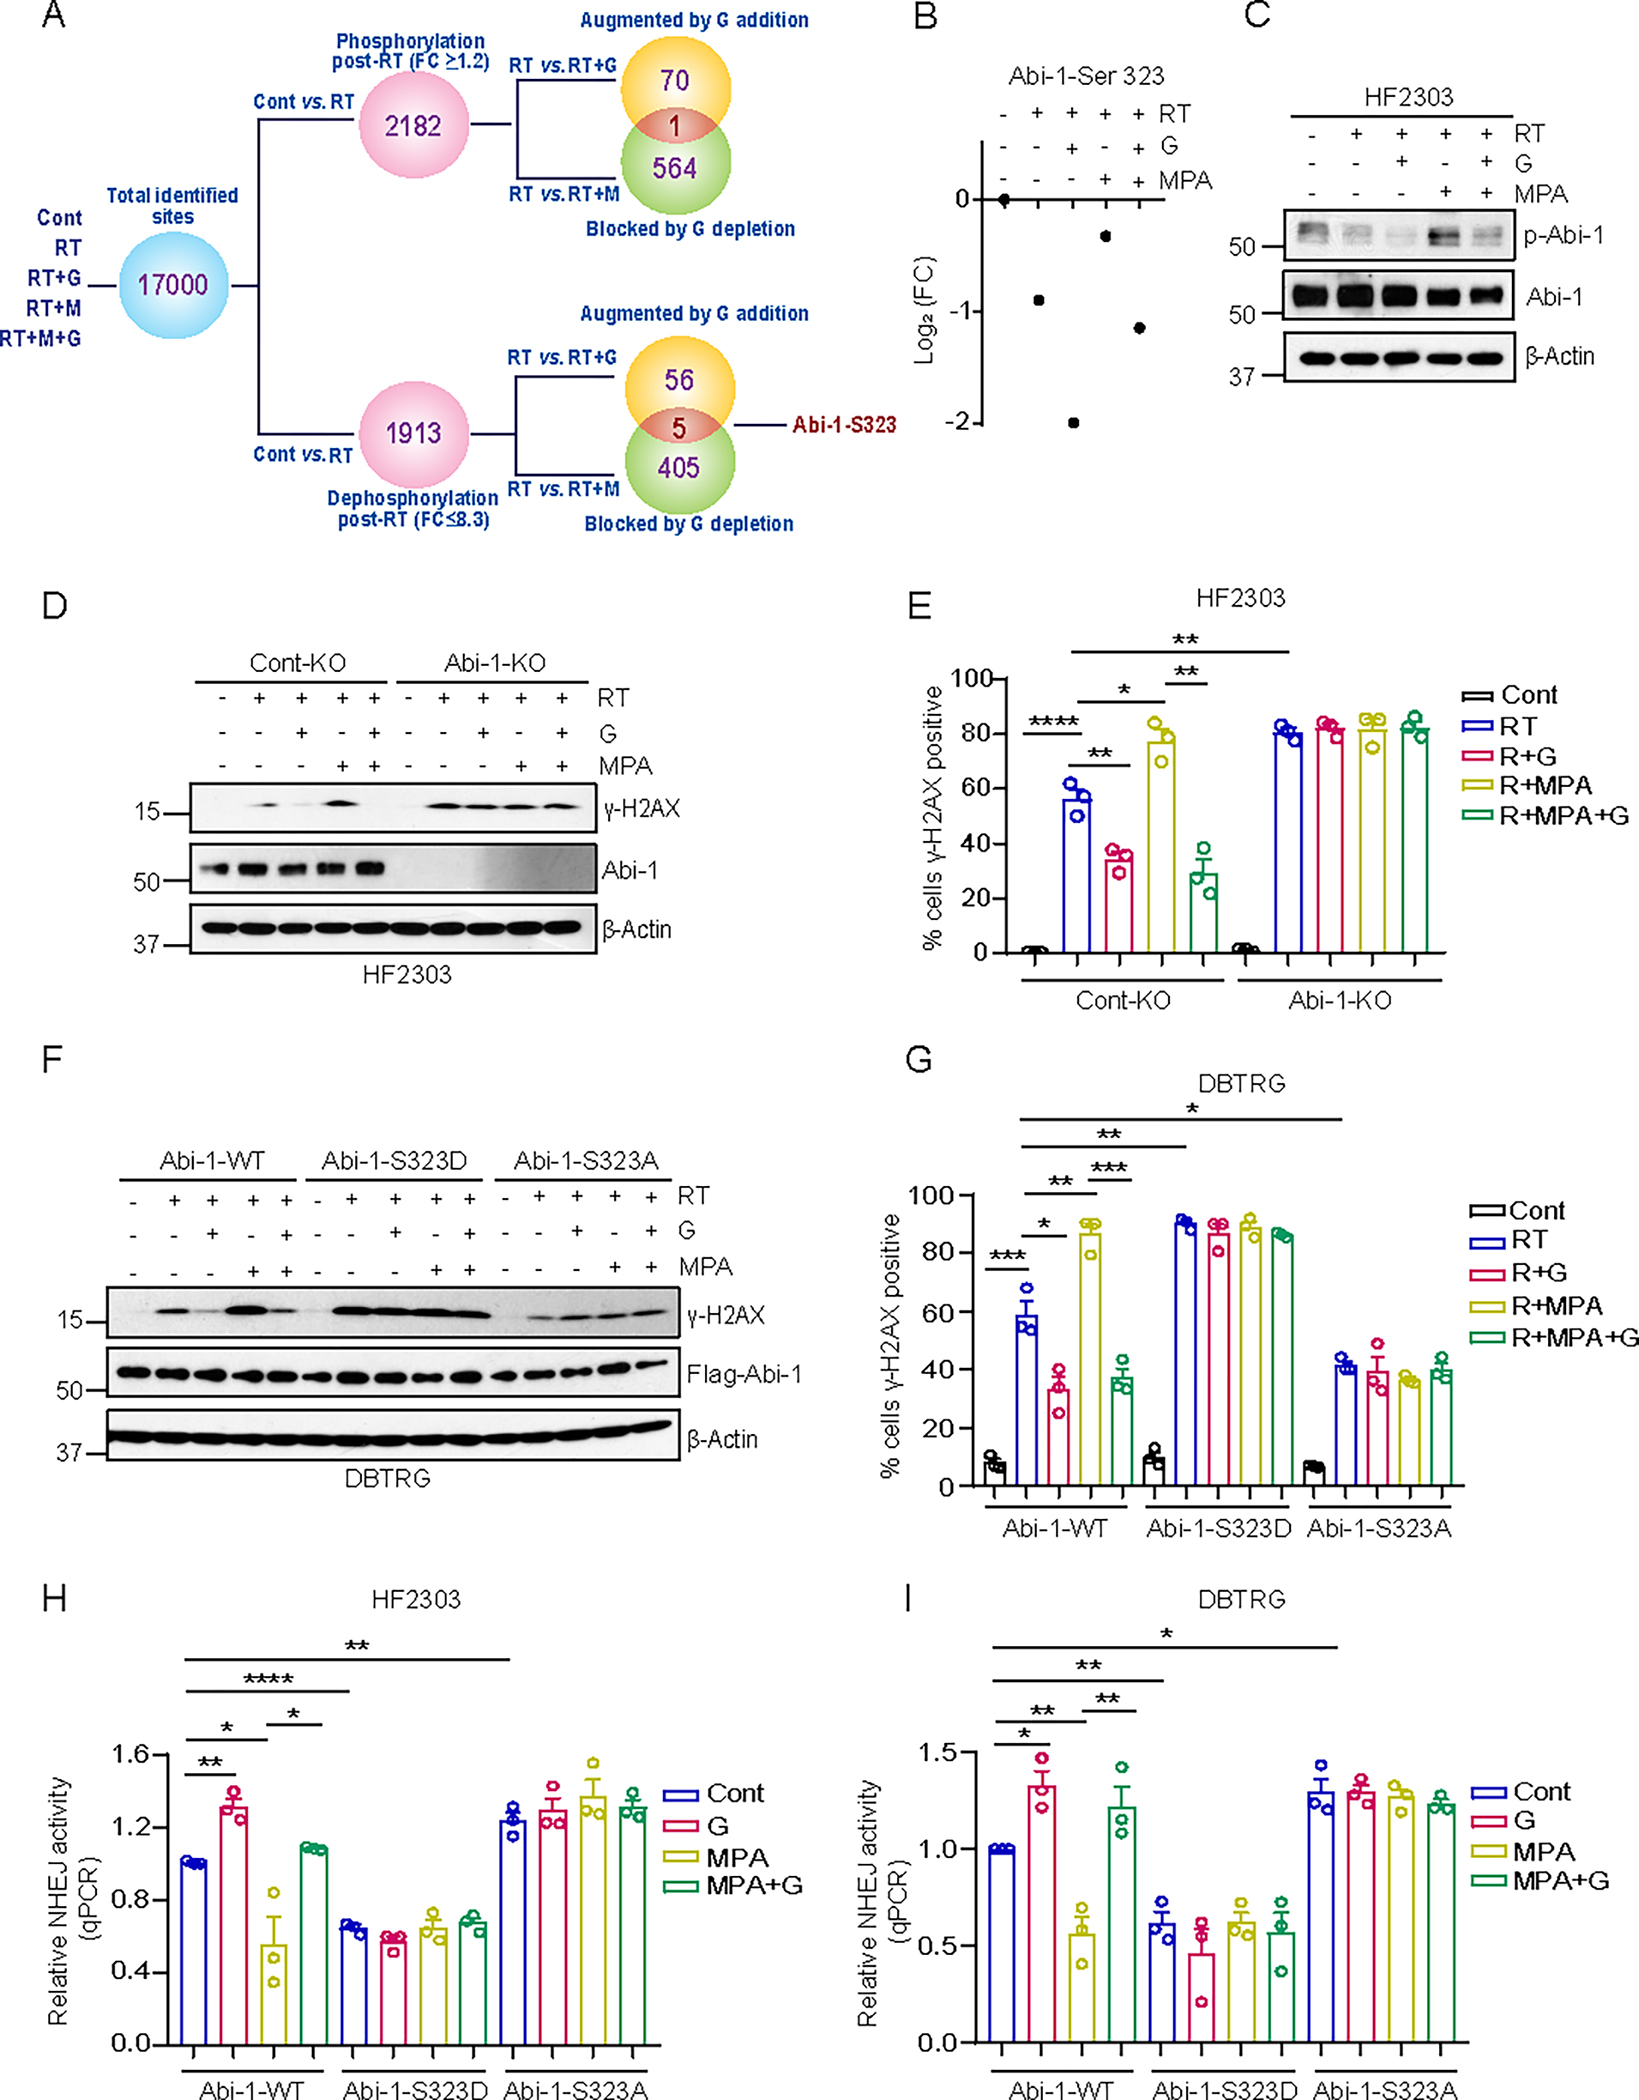
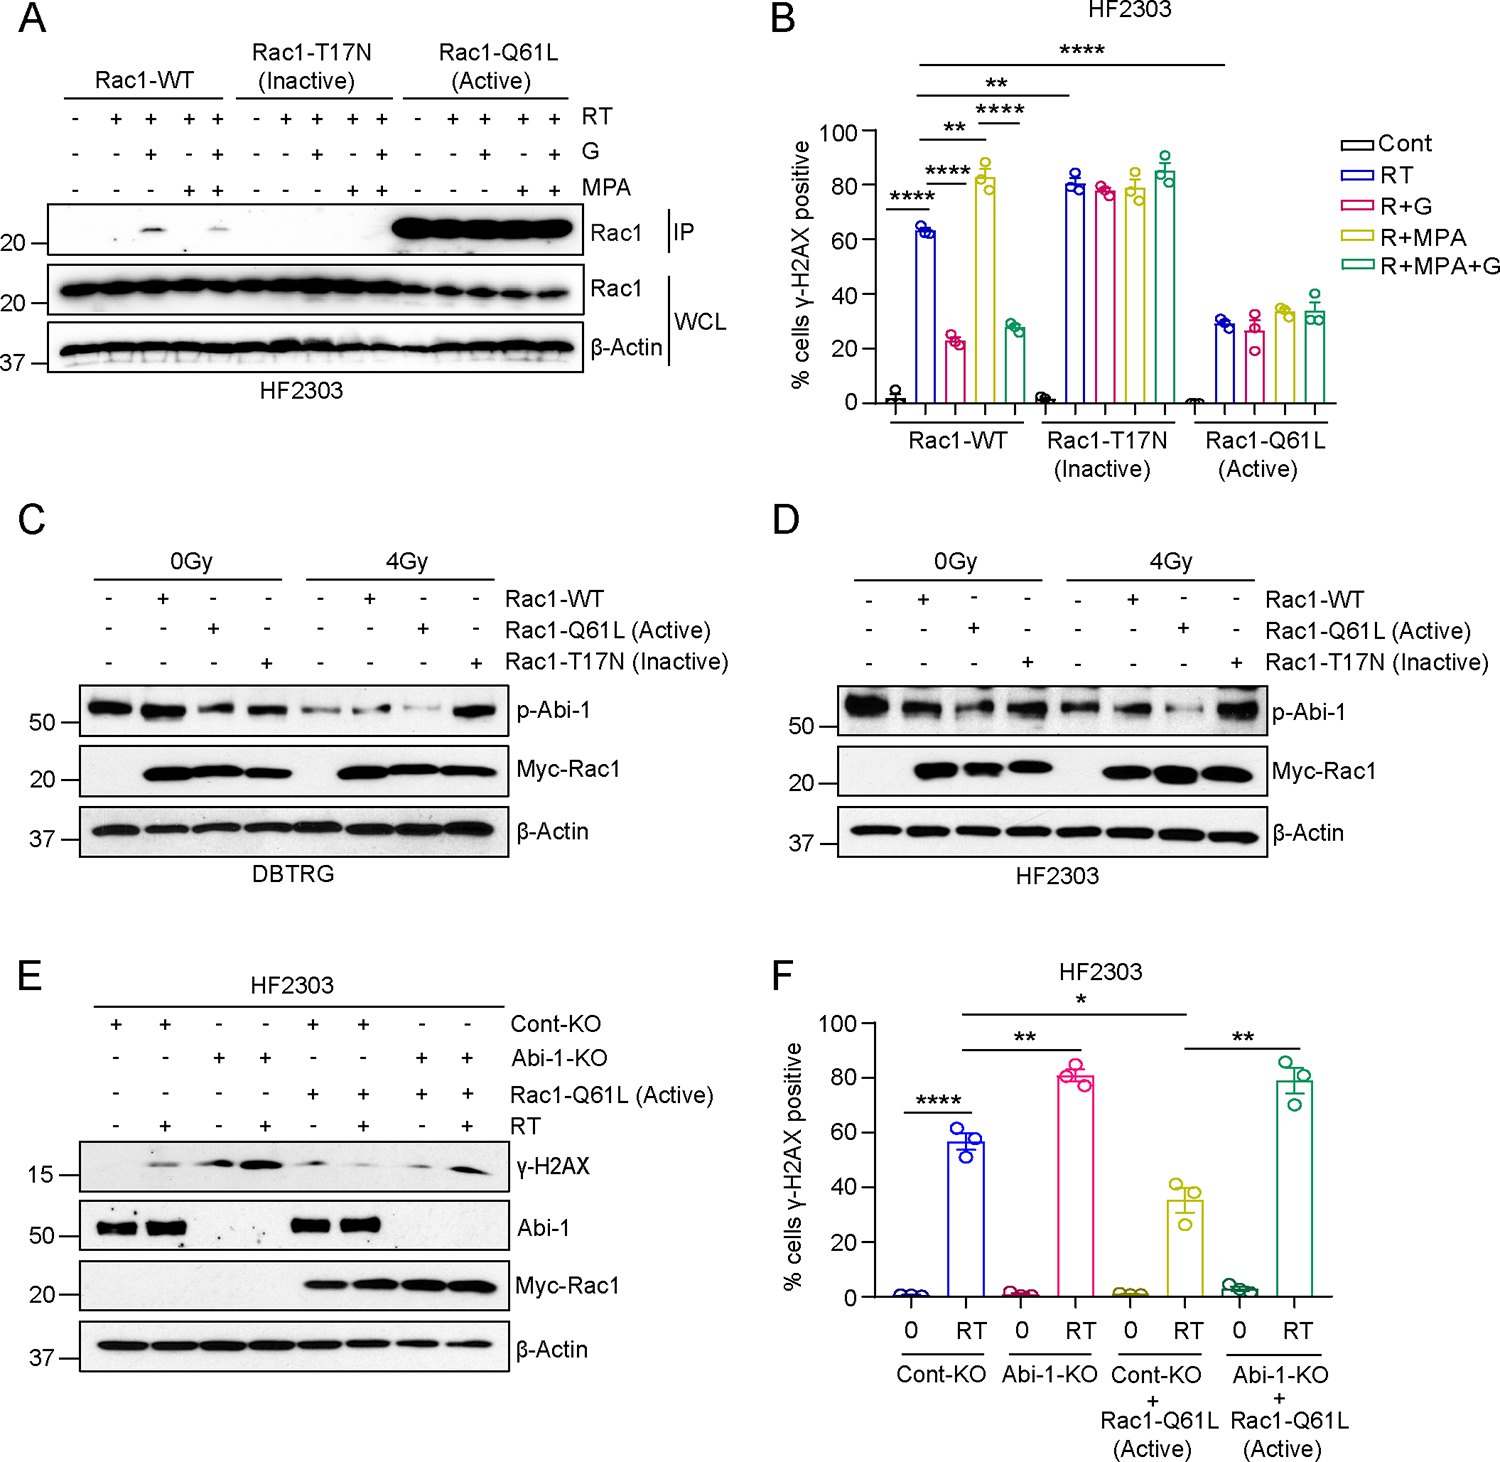
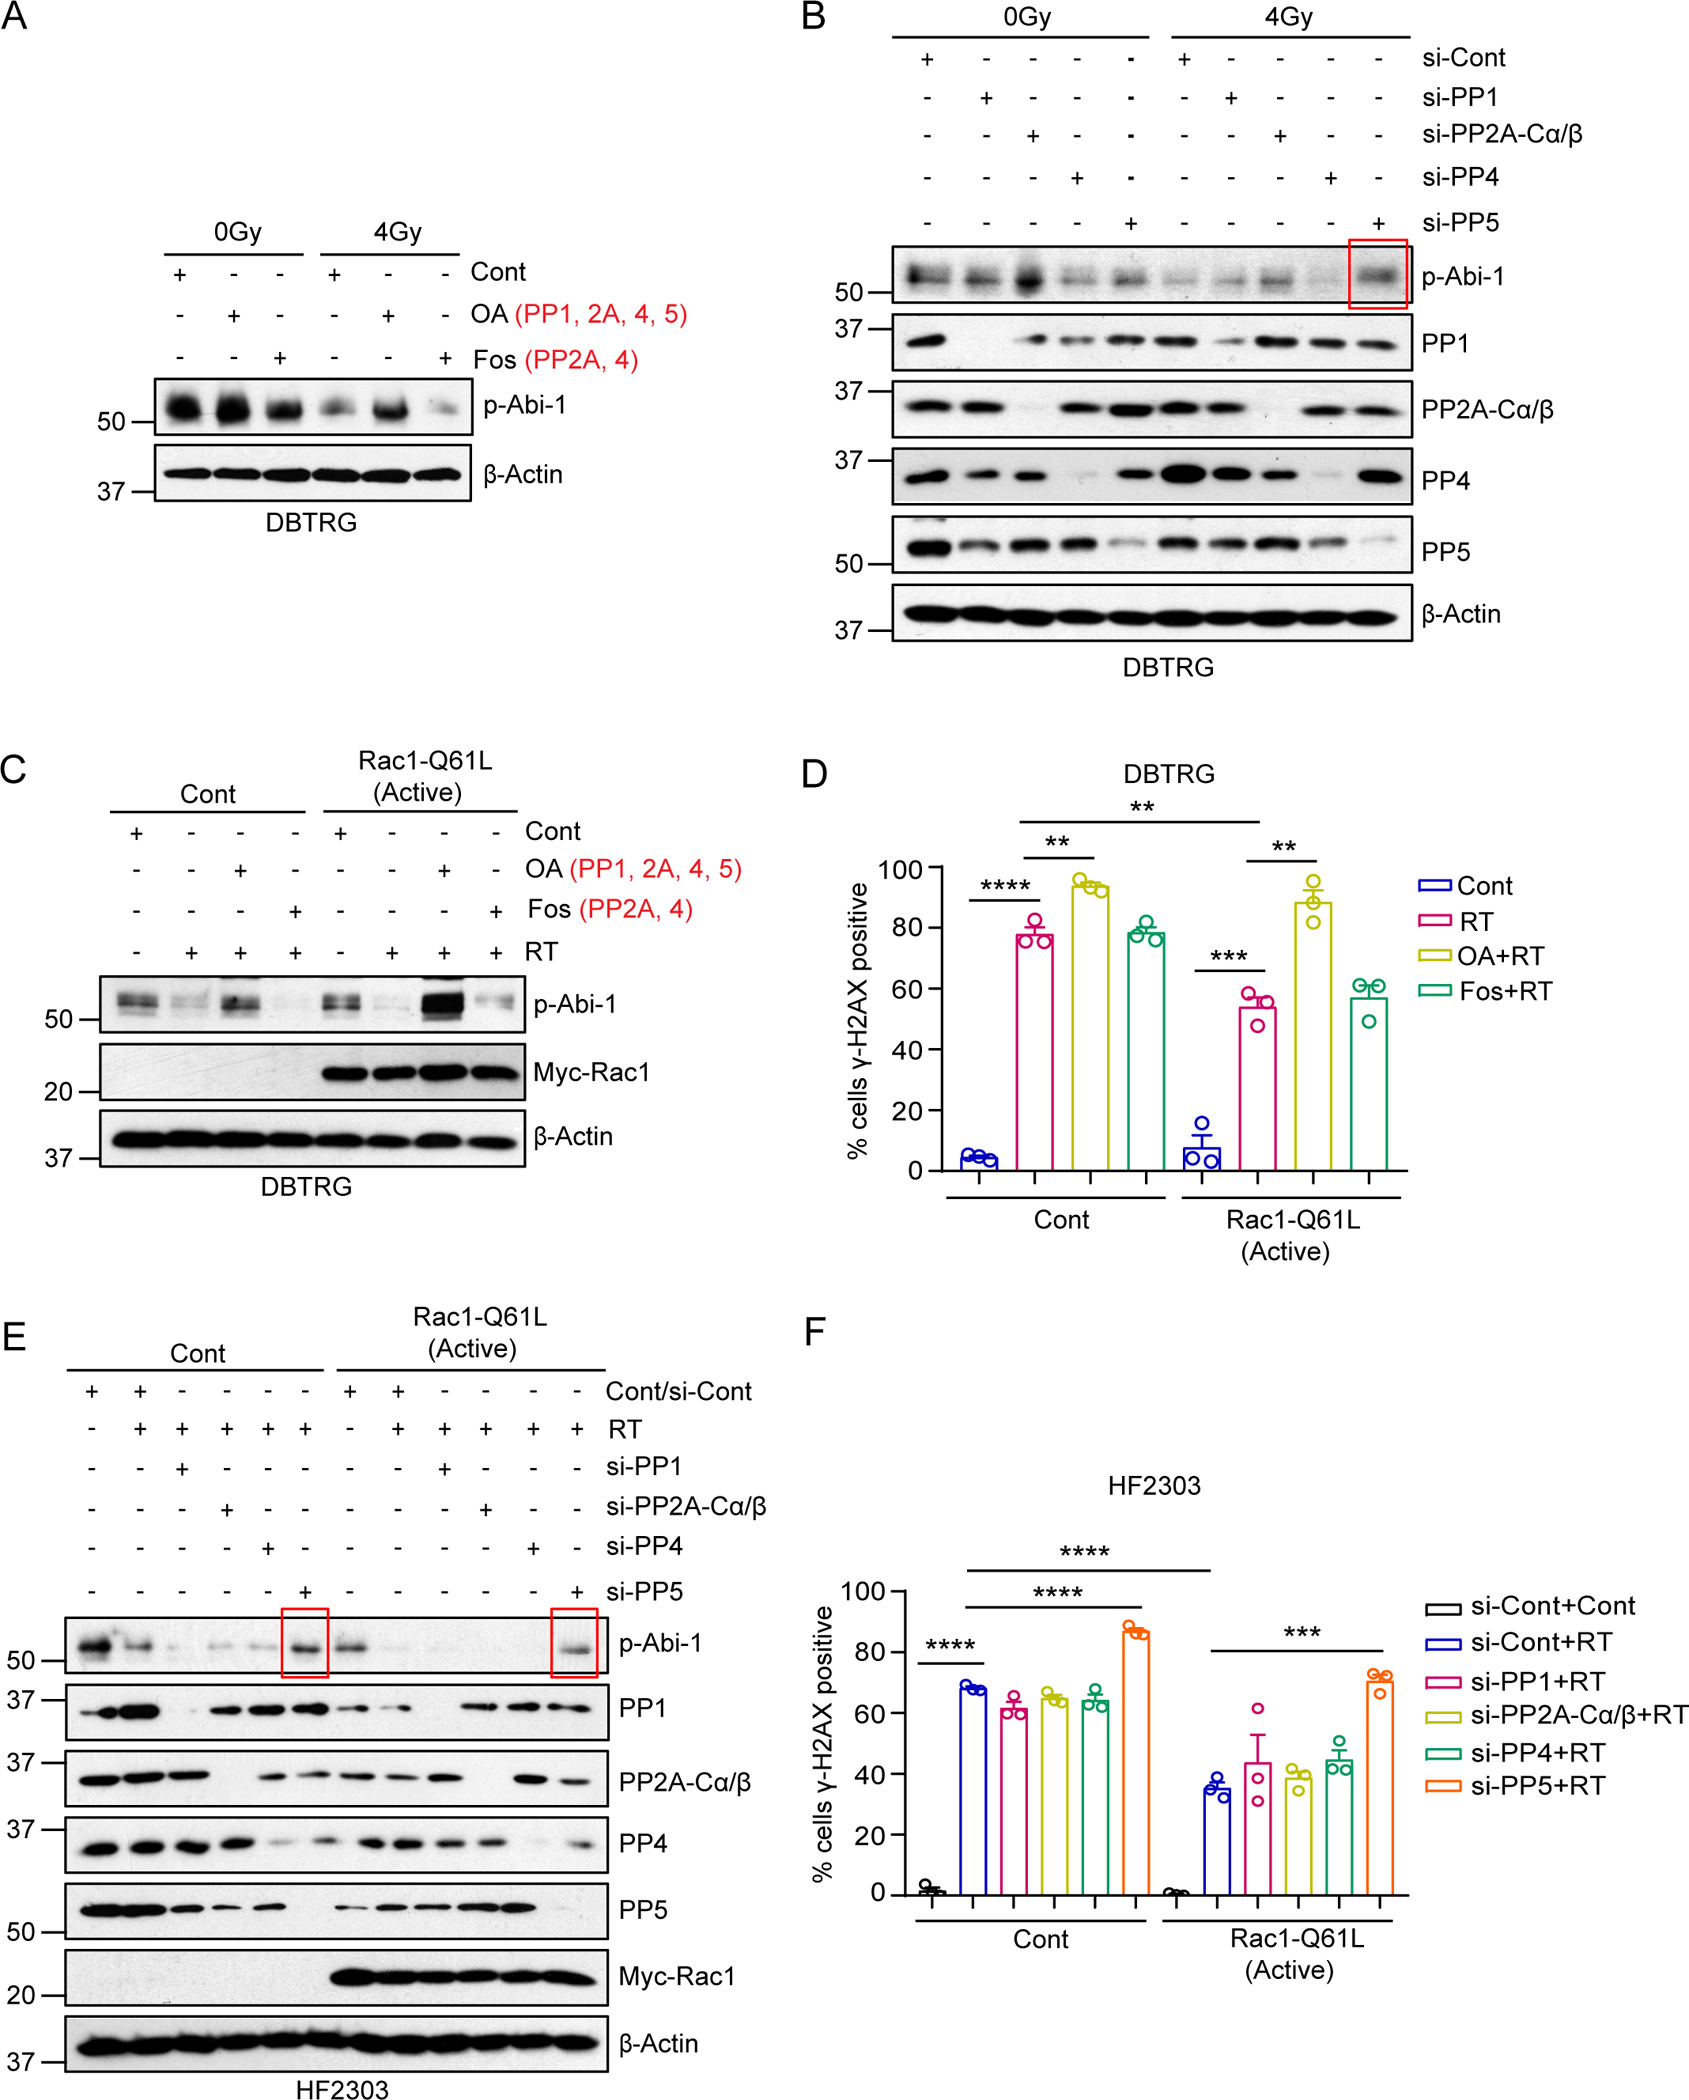
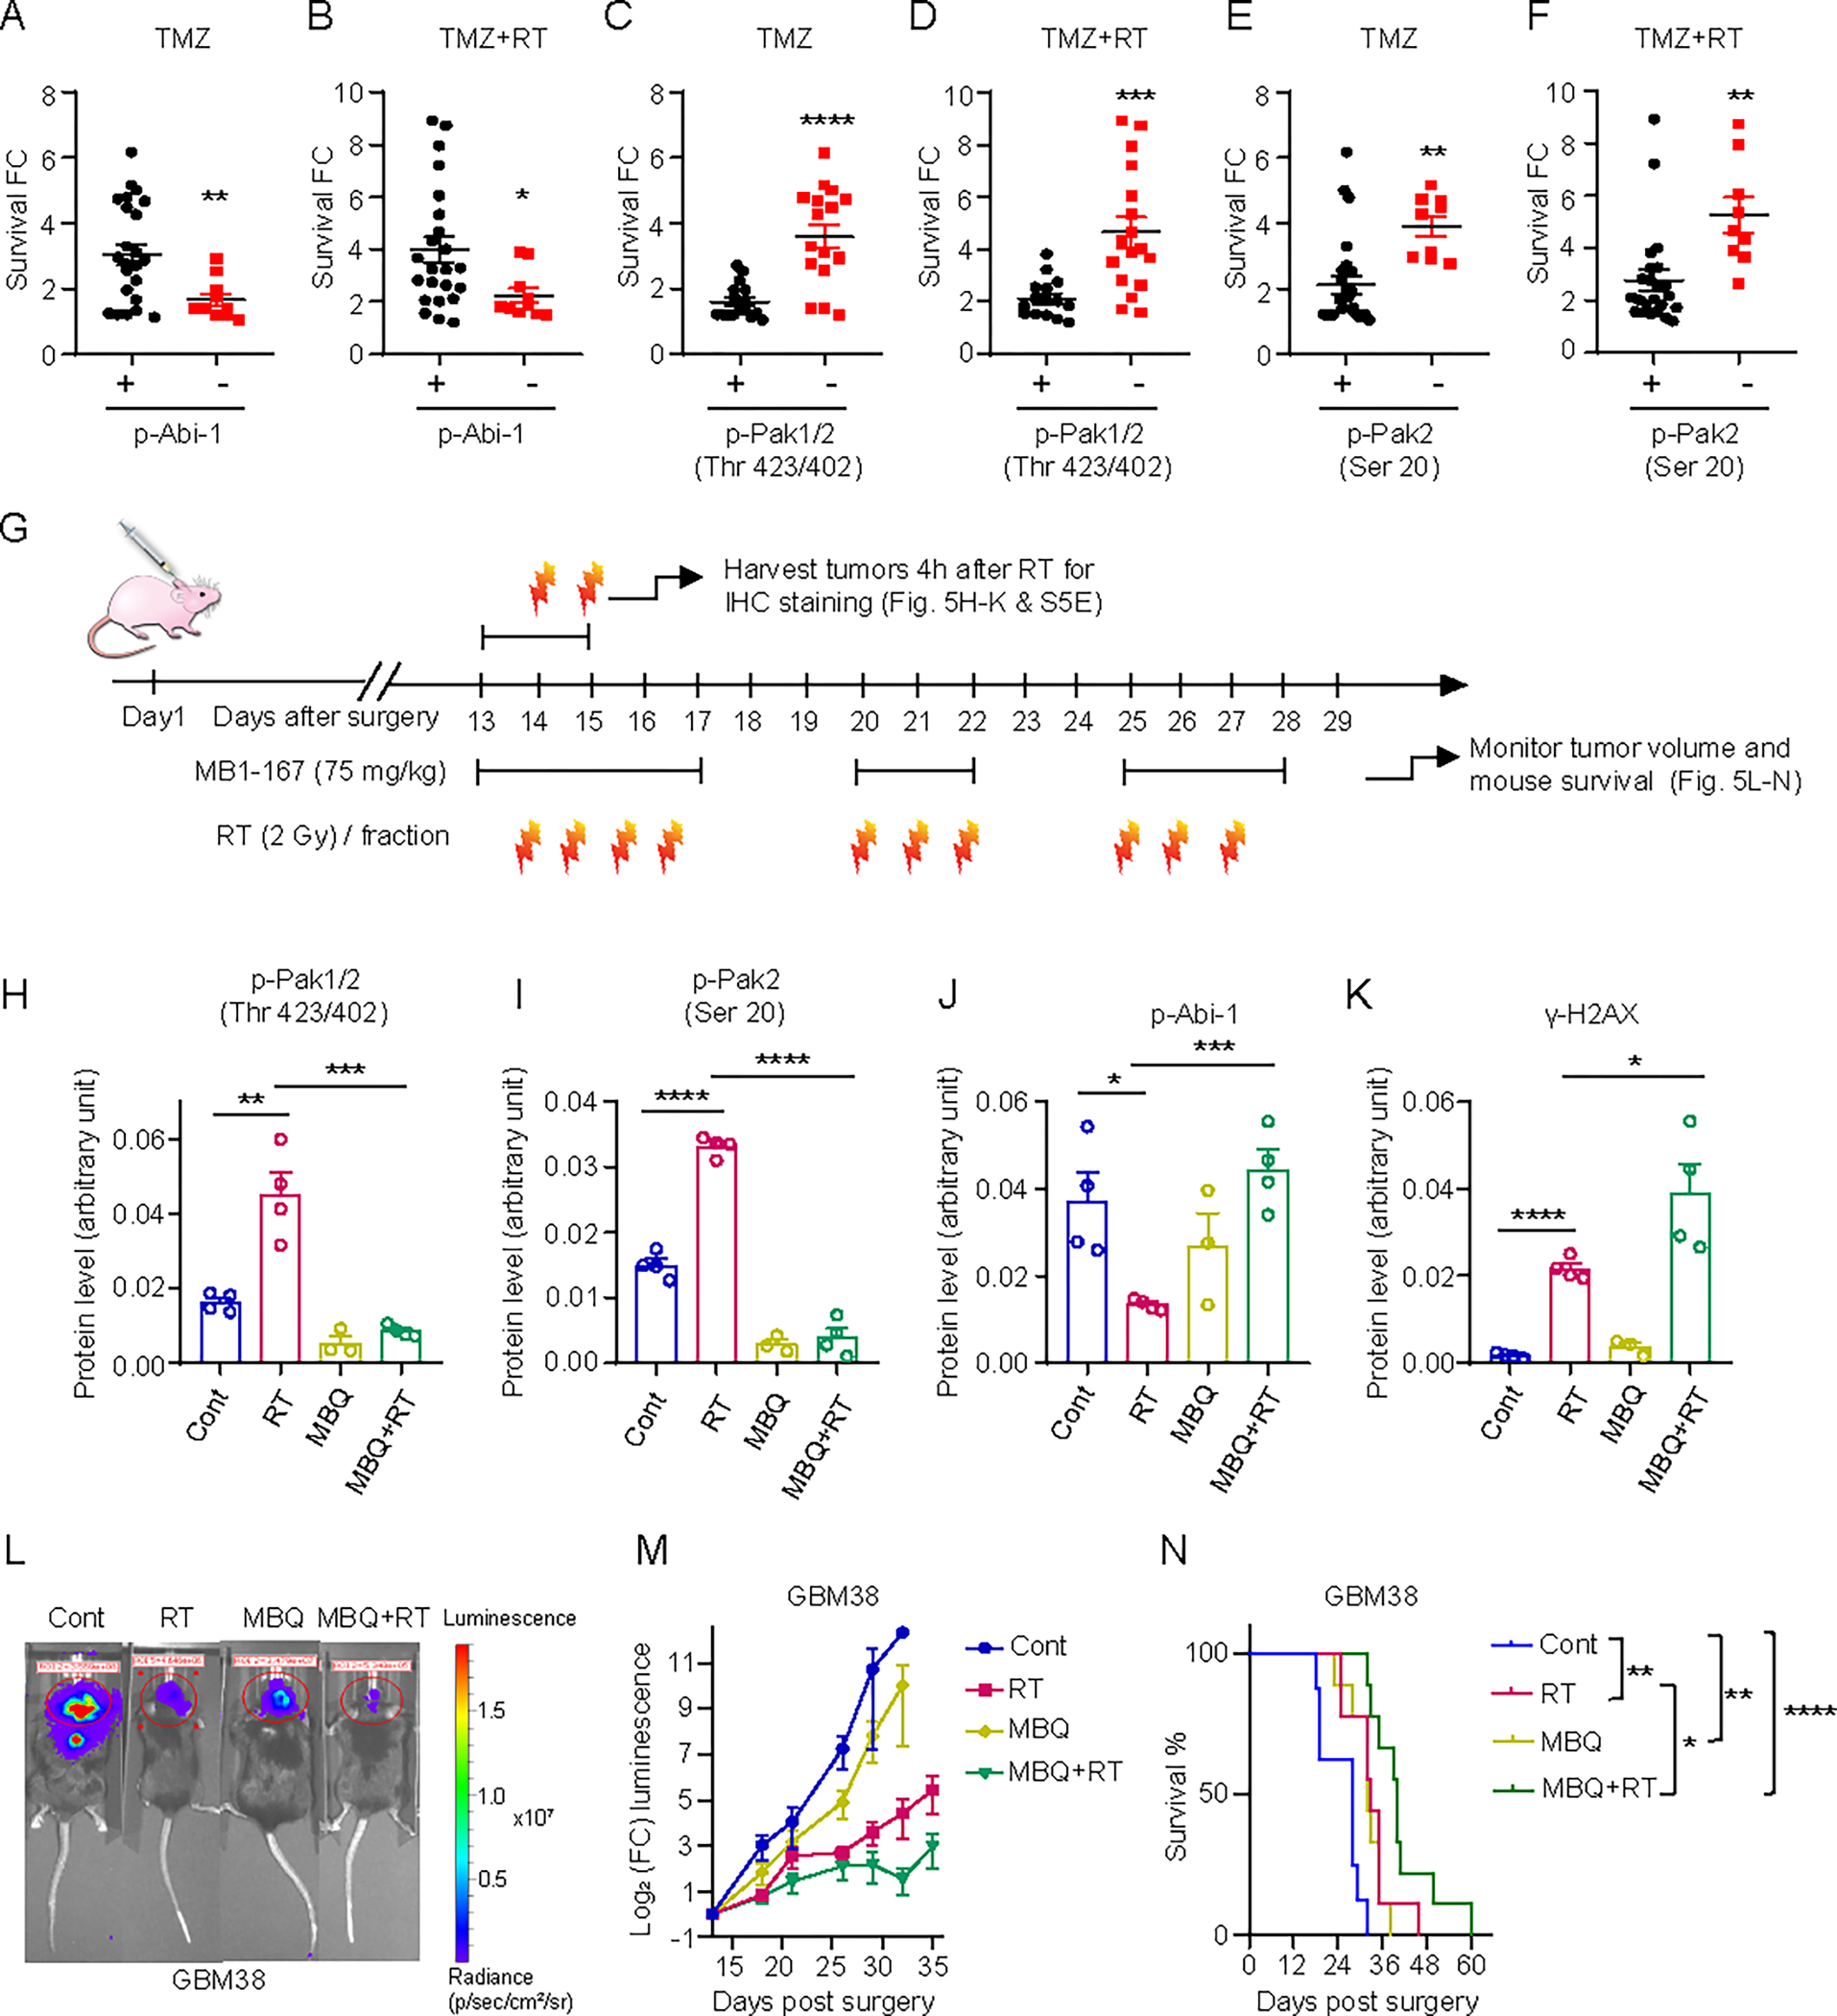
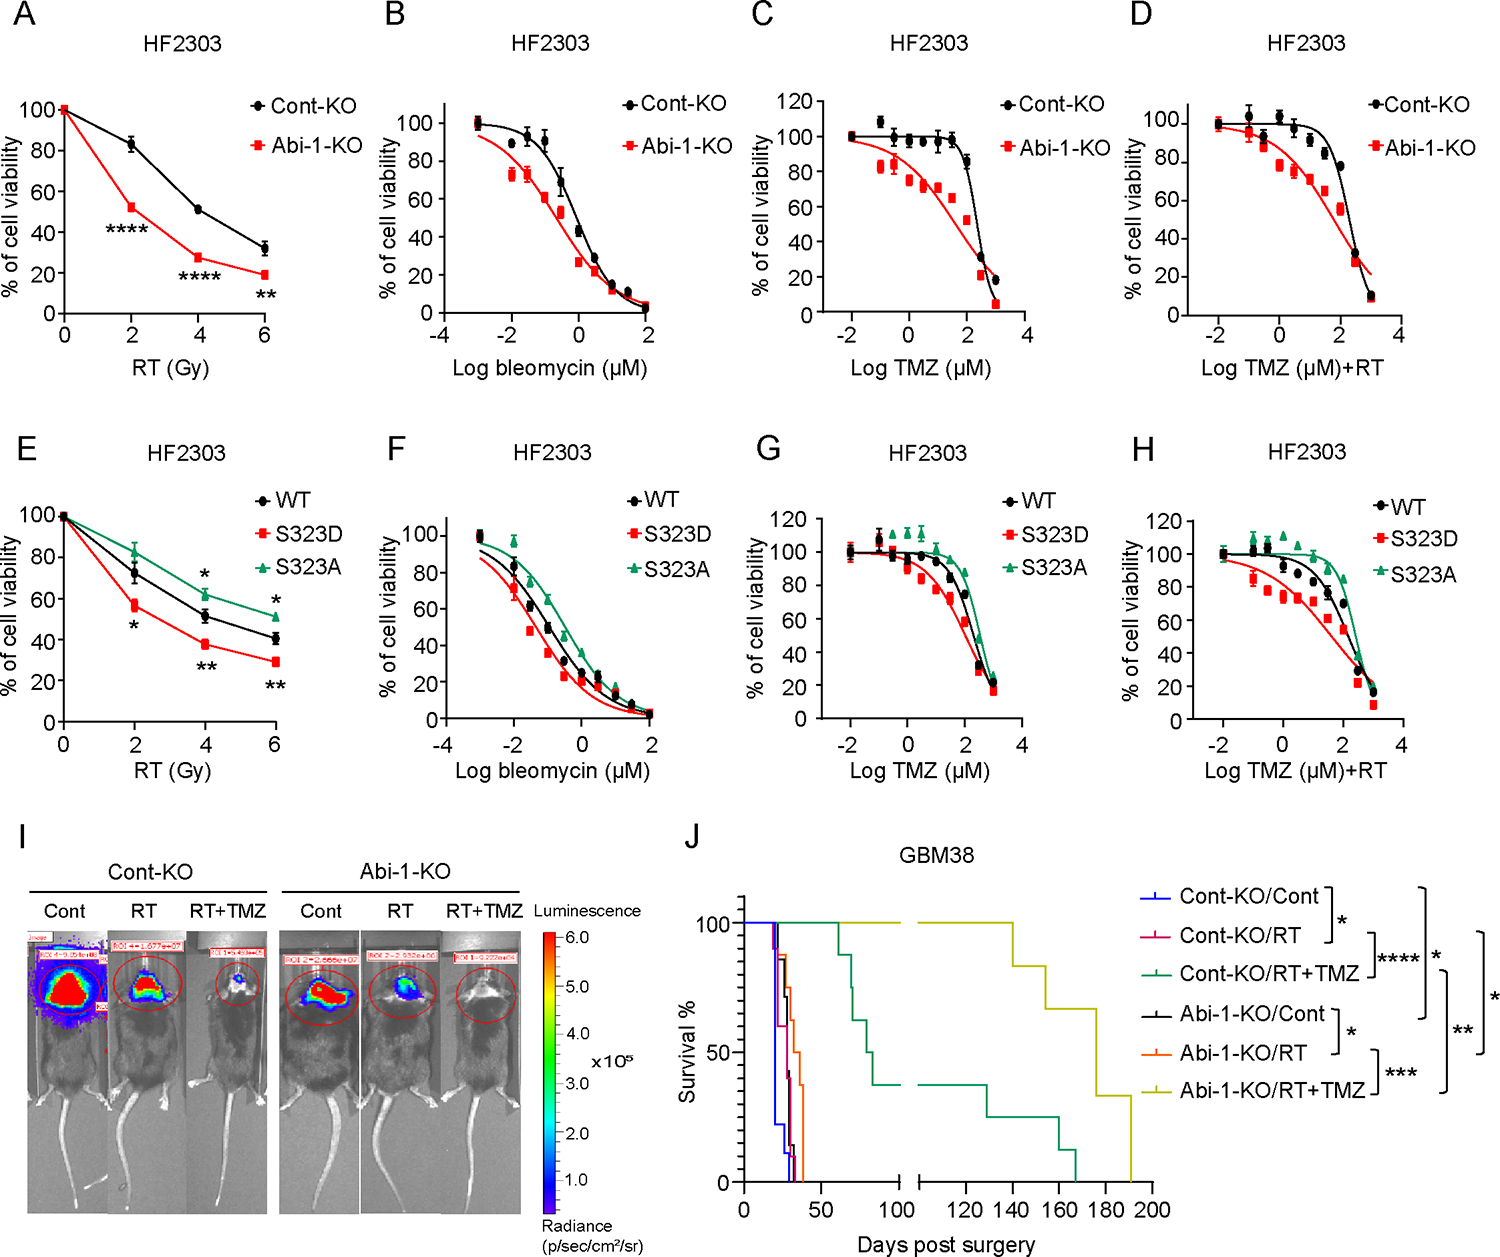
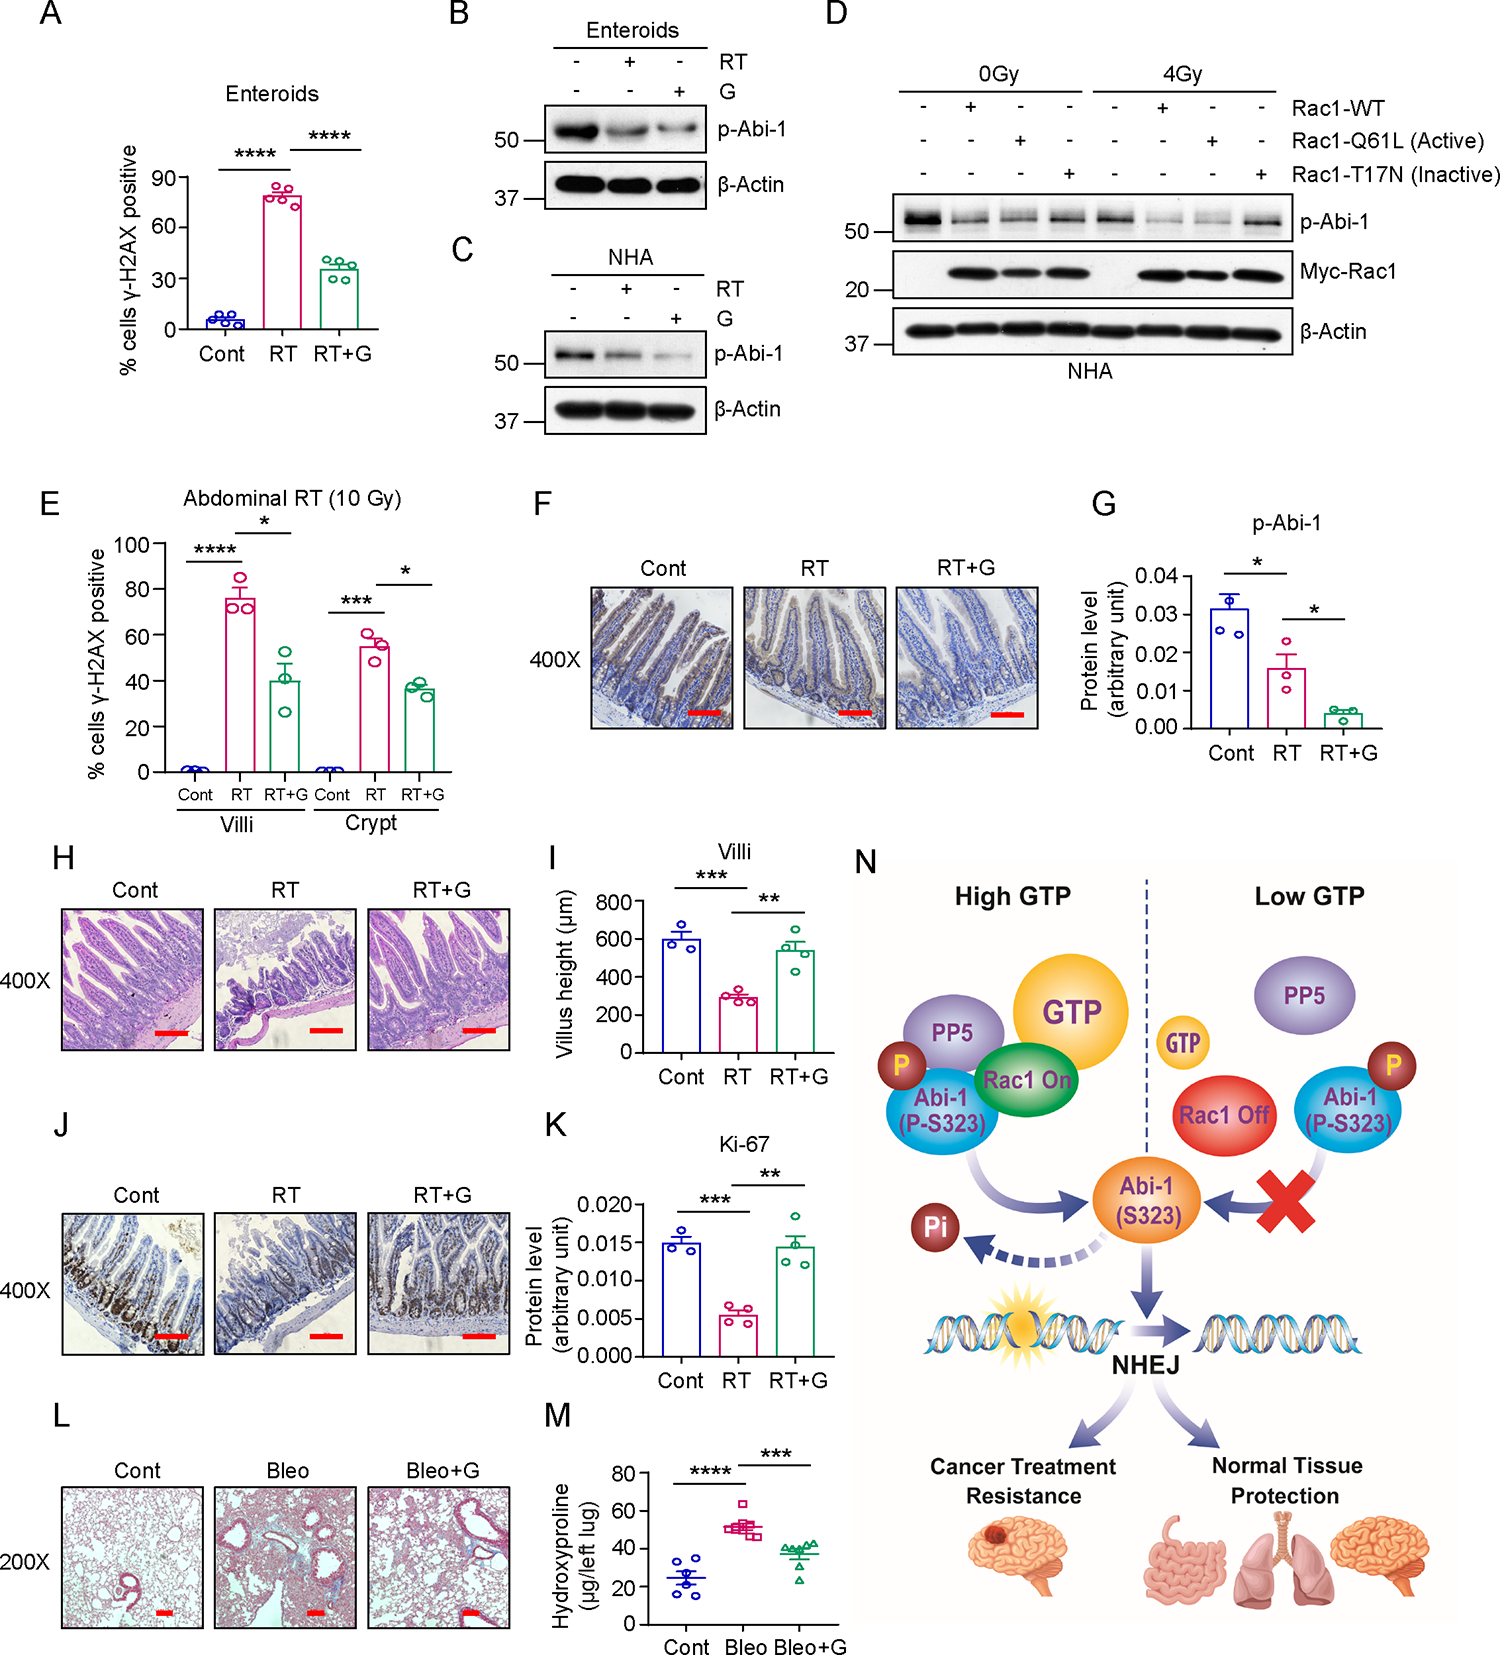
How cell metabolism regulates DNA repair is incompletely understood. Here, we define a GTP-mediated signaling cascade that links metabolism to DNA repair and has significant therapeutic implications. GTP, but not other nucleotides, regulates the activity of Rac1, a guanine nucleotide-binding protein, which promotes the dephosphorylation of serine 323 on Abl-interactor 1 (Abi-1) by protein phosphatase 5 (PP5). Dephosphorylated Abi-1, a protein previously not known to activate DNA repair, promotes nonhomologous end joining. In patients and mouse models of glioblastoma, Rac1 and dephosphorylated Abi-1 mediate DNA repair and resistance to standard-of-care genotoxic treatments. The GTP-Rac1-PP5-Abi-1 signaling axis is not limited to brain cancer, as GTP supplementation promotes DNA repair and Abi-1-S323 dephosphorylation in nonmalignant cells and protects mouse tissues from genotoxic insult. This unexpected ability of GTP to regulate DNA repair independently of deoxynucleotide pools has important implications for normal physiology and cancer treatment.

Significance: A newly described GTP-dependent signaling axis is an unexpected link between nucleotide metabolism and DNA repair. Disrupting this pathway can overcome cancer resistance to genotoxic therapy while augmenting it can mitigate genotoxic injury of normal tissues. This article is featured in Selected Articles from This Issue, p. 5.


Figures

Figure 1
Figure 1. GTP promotes DSB repair through NHEJ.
(A & B) Cells of the indicated line were treated with adenosine (A; 50 μM), guanosine (G; 50 μM) or pooled purine and pyrimidine nucleosides (Nuc; 8x) for 24 h and retreated with the same doses of individual purine or pooled nucleosides 2 h before RT and harvested for γ-H2AX (S139) quantification by IF 4 h post-RT (n = 3 for panel A; n = 5 for panel B). Data are presented as mean ± SEM for (B). (C) Cells were transfected with a SMARTpool mixture of 4 siRNAs to target key enzymes of GTP or ATP synthesis and then treated with individual purines and/or radiation as above, followed by γ-H2AX quantification by IF (n = 3). (D) Cells were treated with AG2037 (150 nM) alone or combination with purines (A or G). Cells were harvested 4 h post-RT for γ-H2AX quantification by IF (n = 3). (E & F) Cells of the indicated line were treated with A (50 μM), G (50 μM), the GTP-only inhibitor mycophenolic acid (MPA, 10 μM), the dual GTP/ATP inhibitor AG2037 (150 nM) or their combinations and NHEJ was assessed using the qPCR-based pEYFP NHEJ system and normalized to untreated cells (n = 3 for panel E; n =3~4 for panel F). The DNAPK inhibitor (NHEJ-in) M3814 was used as a positive control. (G & H) Cells stably expressing the I-Scel-NHEJ reporter construct were treated with conditions identical to panels E & F and DNA damage was induced by infection with I-Scel adenovirus and NHEJ was assessed by quantifying the percentage of cells GFP positive 48 h later and normalized to untreated cells (n = 4 for panel G; n = 5 and mean ± SEM for panel H). “n” indicates the number of biological replicates. Two-tailed unpaired student’s t test *p < 0.05, **p < 0.01, ***p < 0.001, ****p < 0.0001.
Figure 2
Figure 2. Dephosphorylation of Abi-1-S323 is crucial to GTP-induced NHEJ.
(A) Schematic of phosphoproteomic assay, analysis pipeline and nomination of Abi-1-S323. (B) Levels of p-Abi-1-S323 as determined by phosphoproteomic assay. There is a DNA damage-induced dephosphorylation of Abi-1-S323 that is augmented by guanosine supplementation but blocked by GTP deprivation with mycophenolic acid (MPA). The effects of MPA are abrogated when guanosine supplementation is combined with MPA treatment (n = 1). (C) Cells were treated with MPA (10 μM) and/or G (50 μM) for 24 h and retreated with G (50 μM) 2 h before RT, followed by cell harvesting 4 h after RT for immunoblot assay (n = 3). (D & E) Control knockout (Cont-KO) or Abi-1 knockout (Abi-1-KO) cells were treated with MPA, G, and/or RT as before and harvested to assess γ-H2AX levels by immunoblot (panel D, n = 3) or foci quantification (panel E, n = 3). (F & G) Abi-1-KO cells were transfected with plasmids encoding wild type Abi-1, phospho-mimetic Abi-1 (S323D) or dephospho-mimetic Abi-1 (S323A) and treated as above, followed by immunoblot (panel F, n = 3) or γ-H2AX foci assay (panel G, n = 3). (H & I) Abi-1-KO cells were transfected with individual Abi-1 plasmid and treated with MPA and/or G overnight and retreated with G 2 h before transfection of linearized pEYFP products, followed by cell harvesting 24 h post transfection and qPCR assay with data normalized to Abi-1-WT control (DMSO-treated) cells. “n” indicates the number of biological replicates. Representative figures were shown for Figure (C), (D), and (F). Two-tailed unpaired student’s t test *p < 0.05, **p < 0.01, ***p < 0.001, ****p < 0.0001.
Figure 3
Figure 3. Rac1 controls the GTP-dependent dephosphorylation of Abi-1-S323.
(A & B) Cells were transfected with plasmids encoding Rac1-WT, -T17N (dominant negative), or -Q61L (constitutively active), and treated with MPA, G, or RT as in Figure 2. Cells were harvested 4 h post RT to assess Rac1 activity (panel A, n = 3) or γ-H2AX foci by immunofluorescence (panel B, n = 3). (C & D) Cells were transfected with indicated Rac1 plasmids (WT, constitutively active Q61L or dominant negative T17N) and irradiated with 4 Gy, followed by cell harvesting 4 h post-RT to assess p-Abi1-S323 by immunoblot (n = 3 for both panel C & D). (E & F) Con-KO or Abi-KO cells were transfected with Rac1-Q61L plasmid and treated with radiation and harvested for immunoblot (panel E, n = 3) or γ-H2AX foci IF staining (panel F, n = 3). “n” indicates the number of biological replicates. Representative figures were shown for Figure (A), (C), (D), and (E). Two-tailed unpaired student’s t test *p < 0.05, **p < 0.01, ****p < 0.0001.
Figure 4
Figure 4. Protein phosphatase 5 mediates the GTP/Rac1-depdendent dephosphorylation of Abi-1 (S323) and downstream DSB repair.
(A & B) Cells were treated with the phosphatase inhibitors okadaic acid (OA; 15 nm) or fostricein (Fos; 100 nm) 1 h before RT (panel A, n = 3), or first transfected with siRNAs of pan PP1, mixture of PP2A catalytic (PP2A-C) subunit α/β, PP4 and PP5 for 48 h and irradiated after transfection (panel B, n = 3), followed by cell harvesting 4 h post-RT for immunoblot. (C-F) Cells were transfected with constitutively active Rac1-Q61L and then treated with okadaic acid (15 nM) or fostricein (100 nM) 1 h before RT (C & D), or transfected with individual phosphatase siRNA pool, along with overexpression of Rac1-Q61L or control (E & F), followed by immunoblot (panel C & E, n = 3) or γ-H2AX foci IF staining (panel D & F, n = 3). “n” indicates the number of biological replicates. Representative figures were shown for Figure (A), (B), (C), and (E). Two-tailed unpaired student’s t test **p < 0.01, ***p < 0.001, ****p < 0.0001.
Figure 5
Figure 5. Rac1 activity influences GBM treatment responses.
(A-F) IHC staining was performed to detect expression of p-Abi-1 and two downstream proteins of active Rac1 (PAK1 and PAK2) in GBM PDX tissue arrays. Survival FC indicates the fold increase in median survival with the indicated treatment compared to placebo control. Each dot indicates a different murine PDX model (n = 35 for panel A; n = 33 for panel B; n = 34 for panel C; n = 32 for panel D; n = 34 for panel E; n = 32 for panel F). Data are presented as mean ± SD. (G) A schematic timeline of GBM38 orthotopic mouse models. (H-K) A subset of mice (n = 5 mice/group) were treated with three doses of the Rac1 inhibitor MBQ-167 and two fractions (2 Gy/fraction) of radiation and tumors were harvested 4 h after receiving the second RT dose for IHC staining with indicated antibodies. (L-N) Another subset of mice (n = 7–9 mice/group) were treated with 12 doses of MBQ-167 and 10 fractions of radiation (2 Gy/fraction) were used for efficacy evaluation. Mice were treated with 150 mg/kg D-luciferin and imaged 10 min post-injection (L). Total flux of equal-area ROIs at each time point were normalized to flux at the first day of treatment for evaluating tumor progression (M). Mice were monitored daily and euthanized when they developed neurologic symptoms and Kaplan–Meier survival curve was plotted (N). “n” indicates sample size for Figure A-N. Two-tailed unpaired student’s t test *p < 0.05, **p < 0.01, ***p < 0.001, ****p < 0.0001 for Fig. 5A–5F and H–K; Log-rank (Mantel-Cox) test *p < 0.05, **p < 0.01, ****p < 0.0001 for Fig. 5N.
Figure 6
Figure 6. Abi-1 mediates genotoxic treatment efficacy in GBM.
(A-D) Con-KO or Abi-1-KO cells were treated with different doses of radiation (panel A, n = 5) or escalating concentrations of bleomycin (panel B; Con-KO vs Abi-KO IC50:0.89 μM ± 0.07 vs 0.41 μM ± 0.10, p = 0.004; n = 5), TMZ alone (panel C; 241 μM ± 13 vs 98 μM ± 28, p = 0.002; n = 5) or TMZ combined with RT (4 Gy) (panel D; 210 μM ± 22 vs 49 μM ± 12, p = 0.0002; n = 5) and cell viability was evaluated with long-term cell viability assay at day 7 post treatment. (E-H) Abi-KO cells were transiently transfected with Abi-1-WT, -S323D or -S323A, followed by irradiation (panel E, n = 5), bleomycin (panel F; IC50 of WT vs S323D:0.35 μM ± 0.08 vs 0.14 μM ± 0.05, p = 0.04; WT vs S323A:0.35 μM ± 0.08 vs 0.74 μM ± 0.15, p = 0.04; n = 5), TMZ alone (panel G; IC50 of WT vs S323D: 234 μM ± 28 vs 91 μM ± 25, p = 0.005; WT vs S323A: 234 μM ± 28 vs 320 μM ± 20, p = 0.04; n = 5) or TMZ combined with RT (4 Gy) (panel H; IC50 of WT vs S323D:172 μM ± 25 vs 47 μM ± 21, p = 0.001; WT vs S323A: 172 μM ± 25 vs 308 μM ± 31, p = 0.002; n = 5) treatment as discussed above. (I & J) Luciferase-positive, cont or Abi-1 knockout, and RT-resistant GBM38 patient-derived xenograft cells were orthotopically implanted and tumor-bearing mice were randomized (n = 7–10 mice/group). Mice were treated with 10 doses of TMZ (50 mg/kg) and 6 fractions (2 Gy/fraction) of radiation (as shown in Supplementary Fig. S6P). Tumors were imaged after D-luciferin injection and mouse survival was monitored. “n” in Figure A-H indicates the number of biological replicates. Data are presented as mean ± SEM for Figure 6A & E. Representative figures were shown for Fig. 6B–6D & 6F–6H (IC50 data are presented as mean ± SEM). Two-tailed unpaired student’s t test *p < 0.05, **p < 0.01, ***p < 0.001, ****p < 0.001 for Fig. 6A–6H; Log-rank (Mantel-Cox) test *p < 0.05, **p < 0.01, ***p < 0.001, ****p < 0.001, for Fig. 6J.
Figure 7
Figure 7. GTP protects normal tissues from genotoxicity through Rac1/Abi-1.
(A) Enteroids were treated with RT (4 Gy) alone or combined with G (50 μM) and harvested for IF staining 4 h post-RT (n = 5). Mean ± SEM. (B & C) Enteroids or normal human astrocytes (NHA) were treated as before and harvested for immunoblot (n = 3). (D) NHA were transfected with wild type (WT), constitutively active (Q61L) or dominant negative (T17N) Rac1 plasmids and treated as above, and cells were harvested 4 h post-RT for immunoblot (n = 3). (E-K) C57BL/6J mice were treated with 7 doses of guanosine (300 mg/kg) by oral gavage or combined with one dose (10 Gy) of abdominal radiation. A subset of mice were sacrificed, and jejunums were harvested 4 h after receiving radiation for γ-H2AX quantification by IF (panel E, n = 3) or p-Abi-1 protein evaluation by IHC staining (panel F & G, n = 3), respectively. Another subset of mice continued to receive the rest of guanosine treatment and jejunums were harvested at day 14 for H&E (panel H & I) and Ki-67 IHC staining (panel J & K, n = 3–4). (L & M) C57BL/6J mice were treated with 10 doses of guanosine (300 mg/kg) by oral gavage and/or a single oropharyngeal dose of bleomycin (1.5 units/kg). After 21 days, animals were sacrificed and fibrosis was quantified using Masson’s trichrome staining for collagen deposition (L) and hydroxyproline assay for lung hydroxyproline content (panel M, n = 6–9, Mean ± SEM). (N) A schematic summary of our study. Representative figures were shown for Fig. 7B–7D. Two-tailed unpaired student’s t test *p < 0.05, **p < 0.01, ***p < 0.001, ****p < 0.001, for Fig. 7A and 7E–7M.

Update of

Similar articles

Cited by

References

    1. Kocakavuk E, Anderson KJ, Varn FS, Johnson KC, Amin SB, Sulman EP, et al. Radiotherapy is associated with a deletion signature that contributes to poor outcomes in patients with cancer. Nat Genet 2021;53(7):1088–96 doi 10.1038/s41588-021-00874-3. - DOI - PMC - PubMed
    1. Rivera AL, Pelloski CE, Gilbert MR, Colman H, De La Cruz C, Sulman EP, et al. MGMT promoter methylation is predictive of response to radiotherapy and prognostic in the absence of adjuvant alkylating chemotherapy for glioblastoma. Neuro Oncol 2010;12(2):116–21 doi 10.1093/neuonc/nop020. - DOI - PMC - PubMed
    1. Pitter KL, Casey DL, Lu YC, Hannum M, Zhang Z, Song X, et al. Pathogenic ATM Mutations in Cancer and a Genetic Basis for Radiotherapeutic Efficacy. J Natl Cancer Inst 2021;113(3):266–73 doi 10.1093/jnci/djaa095. - DOI - PMC - PubMed
    1. Gotoff SP, Amirmokri E, Liebner EJ. Ataxia Telangiectasia: Neoplasia, Untoward Response to X -Irradiation, and Tuberous Sclerosis. American Journal of Diseases of Children 1967;114(6):617–25 doi 10.1001/archpedi.1967.02090270073006. - DOI - PubMed
    1. Heymann S, Delaloge S, Rahal A, Caron O, Frebourg T, Barreau L, et al. Radio-induced malignancies after breast cancer postoperative radiotherapy in patients with Li-Fraumeni syndrome. Radiation Oncology 2010;5(1):104 doi 10.1186/1748-717X-5-104. - DOI - PMC - PubMed

Substances