. 2023 Nov 7;120(45):e2301534120.
doi: 10.1073/pnas.2301534120. Epub 2023 Oct 30.

Aberrant DJ-1 expression underlies L-type calcium channel hypoactivity in dendrites in tuberous sclerosis complex and Alzheimer's disease

Affiliations

Aberrant DJ-1 expression underlies L-type calcium channel hypoactivity in dendrites in tuberous sclerosis complex and Alzheimer's disease

Farr Niere et al. Proc Natl Acad Sci U S A. .

Abstract

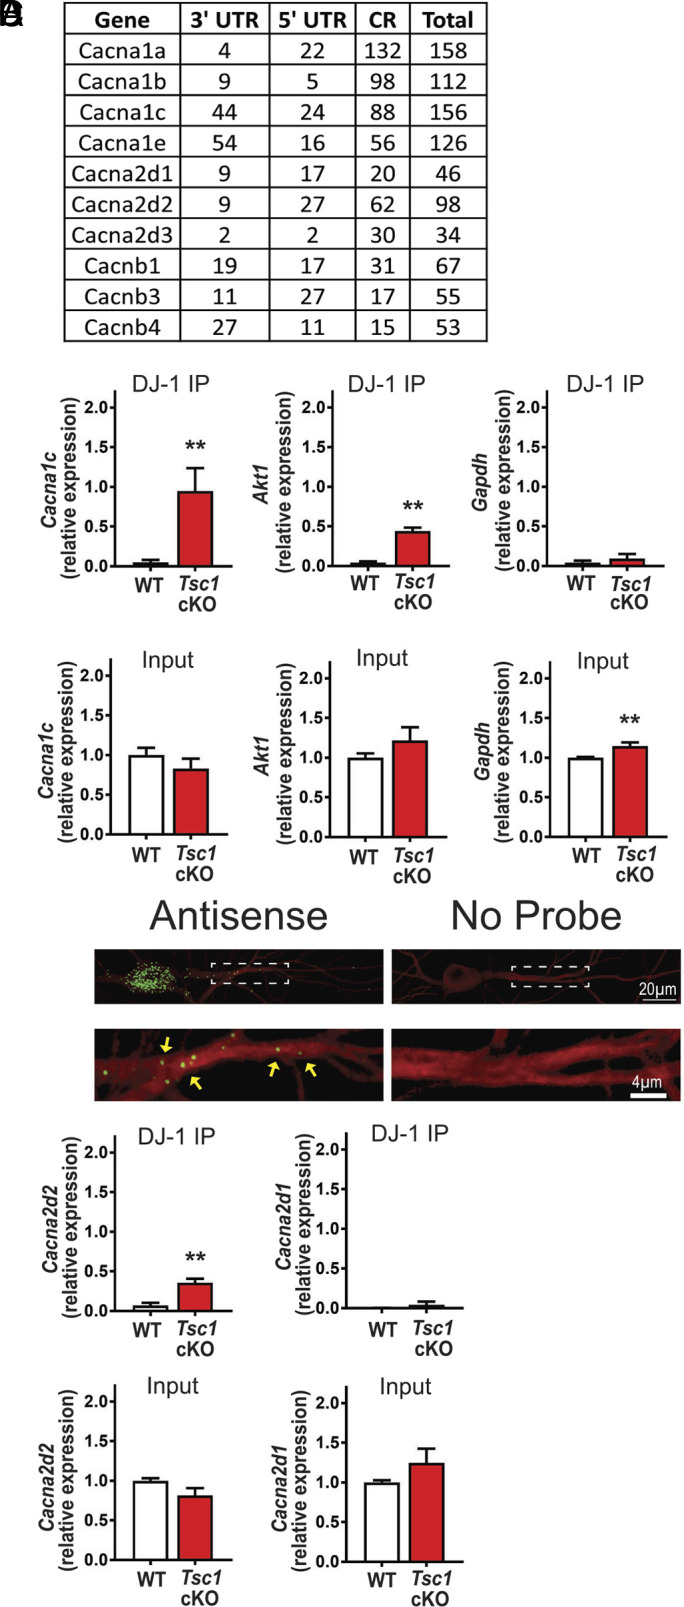
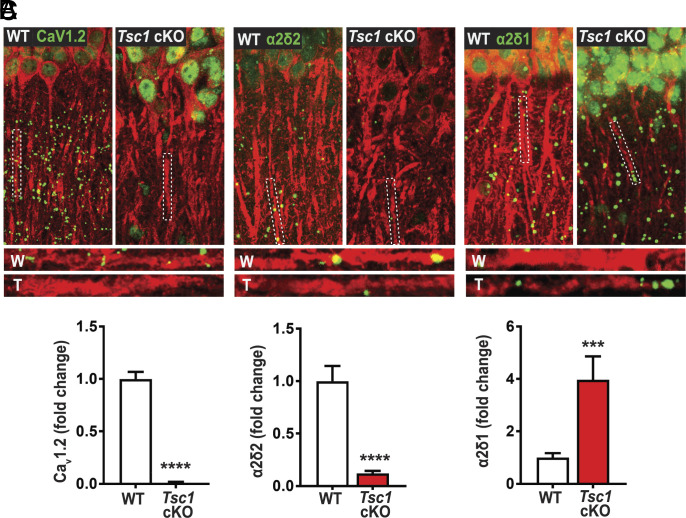
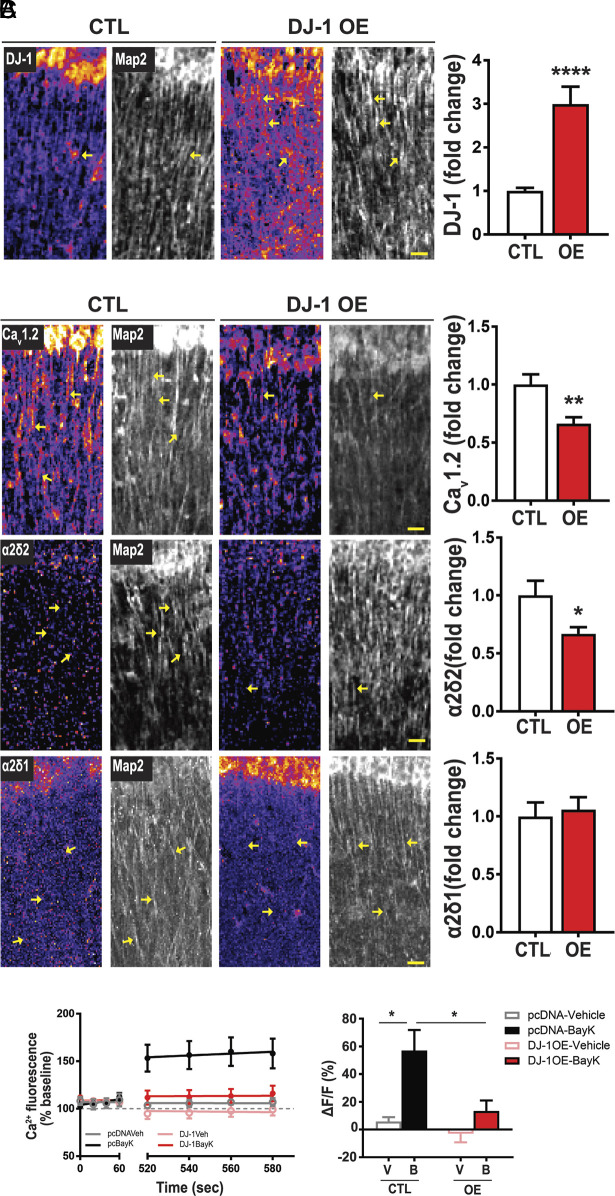
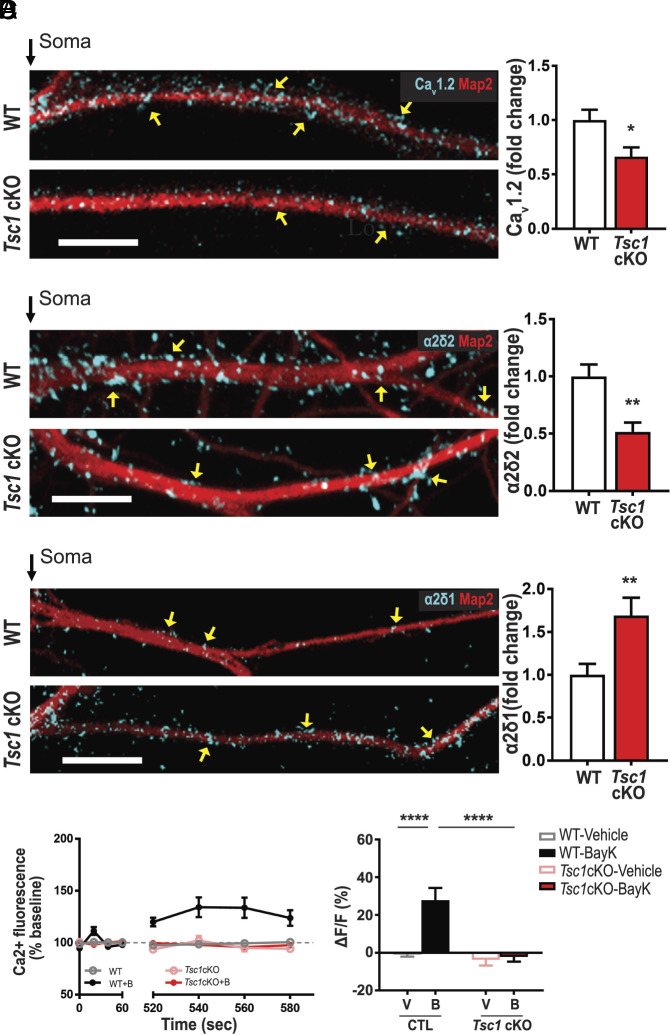
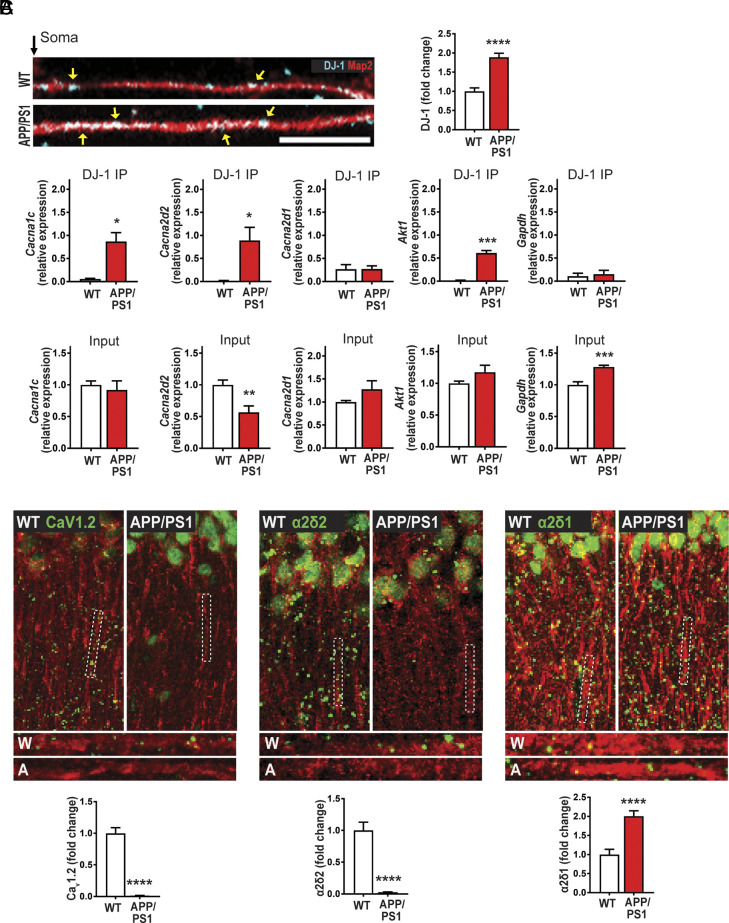
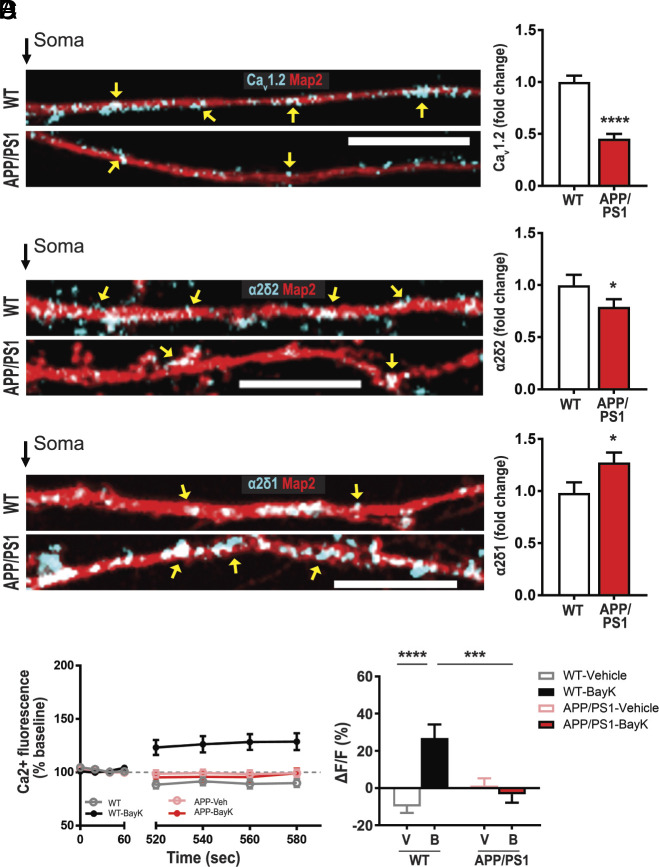
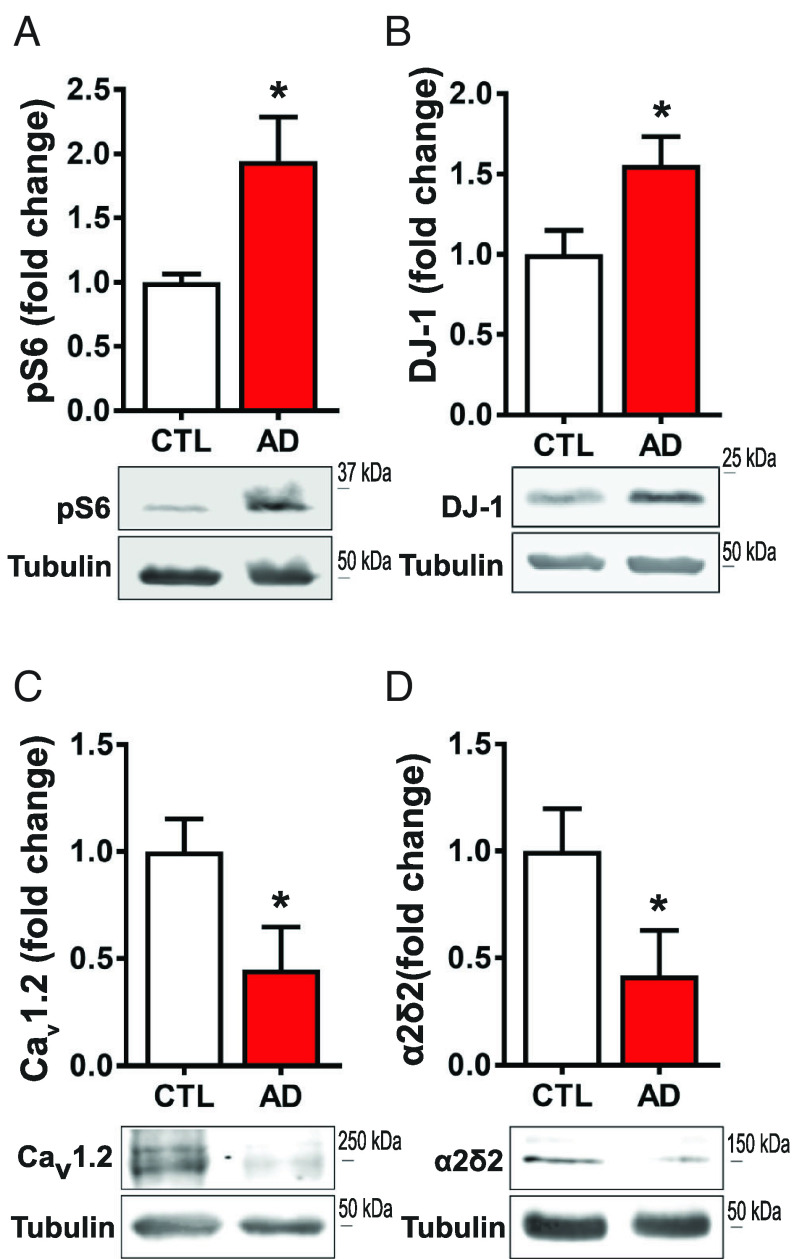
L-type voltage-gated calcium (Ca2+) channels (L-VGCC) dysfunction is implicated in several neurological and psychiatric diseases. While a popular therapeutic target, it is unknown whether molecular mechanisms leading to disrupted L-VGCC across neurodegenerative disorders are conserved. Importantly, L-VGCC integrate synaptic signals to facilitate a plethora of cellular mechanisms; however, mechanisms that regulate L-VGCC channel density and subcellular compartmentalization are understudied. Herein, we report that in disease models with overactive mammalian target of rapamycin complex 1 (mTORC1) signaling (or mTORopathies), deficits in dendritic L-VGCC activity are associated with increased expression of the RNA-binding protein (RBP) Parkinsonism-associated deglycase (DJ-1). DJ-1 binds the mRNA coding for the alpha and auxiliary Ca2+ channel subunits CaV1.2 and α2δ2, and represses their mRNA translation, only in the disease states, specifically preclinical models of tuberous sclerosis complex (TSC) and Alzheimer's disease (AD). In agreement, DJ-1-mediated repression of CaV1.2/α2δ2 protein synthesis in dendrites is exaggerated in mouse models of AD and TSC, resulting in deficits in dendritic L-VGCC calcium activity. Finding of DJ-1-regulated L-VGCC activity in dendrites in TSC and AD provides a unique signaling pathway that can be targeted in clinical mTORopathies.

Keywords: Alzheimer’s disease; RNA-binding protein; mammalian target of rapamycin; tuberous sclerosis complex; voltage-gated calcium channels.


Conflict of interest statement

The authors declare no competing interest.

Figures

Fig. 1.
Fig. 1.
DJ-1 associates with Cacna2d2 and Cacna1c in Tsc1 cKO. (A) List of predicted DJ-1 binding mRNA targets coding for Ca2+ channel subunits (coding region, CR) (B) (Top) qRT-PCR analyses of Tsc1Cre/Cre: KO and Tsc1 fl/fl: WT from DJ-1-RNA-immunoprecipitation. Cacna1c: WT = 0.05 ± 0.03, Tsc1 cKO = 0.95 ± 0.3, P = 0.03. Akt1: WT = 0.04 ± 0.02, Tsc1 cKO = 0.44 ± 0.05, P = 0.001. Gapdh: WT = 0.04 ± 0.03, Tsc1 cKO = 0.09 ± 0.06, P = 0.47. (Bottom) qRT-PCR of 5% of the input. Cacna1c: WT = 1 ± 0.09, Tsc1 cKO = 0.83 ± 0.1251, P = 0.29. Akt1: WT = 1 ± 0.05, Tsc1 cKO = 1.22 ± 0.17, P = 0.24. Gapdh: WT = 1 ± 0.01, Tsc1 cKO = 1.15 ± 0.05, P = 0.006. n = 3 technical replicates, 3 independent mice. Student’s t test, two-tailed. (C) (Top) Representative images of Cacna2d2 mRNA. (Bottom) Magnified dendrites (dashed-lines) Cacna2d2 mRNA, indicated by green puncta/yellow arrowheads. (D) (Top) qRT-PCR of mRNA isolated from DJ-1 RNA-IP. Cacna2d2: WT = 0.07 ± 0.04, Tsc1 cKO = 0.4 ± 0.05, P = 0.01. Cacna2d1: WT = 0.002 ± 0.002, Tsc1 cKO = 0.04 ± 0.04, P = 0.4. (Bottom) qRT-PCR of 5% input RNA from DJ-1 RNA-IP. Cacna2d2: WT = 1 ± 0.03, Tsc1 cKO = 0.8 ± 0.09, P = 0.08. Cacna2d1: WT = 1 ± 0.03, Tsc1 cKO = 1.23 ± 0.21, P = 0.26. N = 3 technical replicates, 3 independent mice, t test, two-tailed.
Fig. 2.
Fig. 2.
Tsc1 cKO mouse model exhibits decreased de novo protein synthesis of CaV1.2 and α2δ2, but not α2δ1. De novo protein synthesis, visualized by SUnSET-PLA (green) in hippocampal dendrites (MAP2, red). WT (W) and TSC (T) dendrites are outlined by broken lines. (A) Basal CaV1.2 protein synthesis is detected in dendrites of WT is markedly reduced in TSC, quantified below (WT = 1.00 ± 0.07, 117 total ROIs, 12 to 18 ROIs/slice, 2 to 3 slices/animal, 3 animals; Tsc1 cKO = 0.01 ± 0.01, 106 total ROIs, 12 to 18 ROIs/slice, 2 to 3 slices/animal, 3 animals). (B) α2δ2 basal new protein synthesis is detected in dendrites of WT but is attenuated in TSC as quantified below (WT = 1.00 ± 0.15, n = 77 total ROIs, 12 to 18 ROIs/slice, 2 to 3 slices/animal, 3 animals; Tsc1 cKO = 0.12 ± 0.02, n = 73 total ROIs, 12 to 18 ROIs/slice, 2 to 3 slices/animal, 3 animals). (C) Basal α2δ1 protein synthesis in dendrites of WT is lower than TSC as quantified below (WT = 1.00 ± 0.17, n = 28 total ROIs, 12 to 18 ROIs/slice, 2 to 3 slices/animal, 3 animals; Tsc1 cKO = 3.97 ± 0.90, n = 17 total ROIs, 12 to 18 ROIs/slice, 2 to 3 slices/animal, 3 animals). For representative images in A through C, CaV1.2, α2δ2, and α2δ1 puncta were dilated once using ImageJ. Bar values represent mean ± SEM. ***P < 0.001, ****P < 0.0001.
Fig. 3.
Fig. 3.
Overexpression of DJ-1 represses CaV1.2 and α2δ2 expression in neuronal dendrites and reduces L-VGCC activity in response to BayK. Protein of interest density is denoted by pseudo coloring (fire) and Map2 (grayscale). Representative images of control (CTL, Left) and overexpression (DJ-1 OE, Middle). (A) DJ-1 expression (Left) and quantification (Right); Scale bar, 20 µm, (Right) DJ-1/Map2 intensity ratio (control = 1.00 ± 0.08; OE = 2.99 ± 0.40; n per condition = 5 ROI/slice, 2 slices/animal, 4 animals; P < 0.0001). (B) (Top) CaV1.2. (Top, Right) quantification of CaV1.2/Map2 ratio (control = 1.00 ± 0.09; OE = 0.66 ± 0.06, n per condition = 5 ROI/slice, 2 slices/animal, 4 animals; P < 0.002). (Middle) α2δ2. (Middle, Right) quantification of α2δ2/Map2 ratio (control = 1.00 ± 0.13; OE = 0.67 ± 0.06, n per condition = 5 ROI/slice, 2 slices/animal, 4 animals; P = 0.02). (Bottom) α2δ1. (Bottom, Right) quantification of α2δ1/Map2 ratio (control = 1.00 ± 0.12; OE = 1.06 ± 0.11, n per condition = 5 ROI/slice, 2 slices/animal, 4 animals; P = 0.72). Bar values are shown as mean ± SEM; statistical tests: Student’s t test. (C) L-VGCC activity detected by L-type agonist, BayK-8644 (BayK, 5 μM). (Left) Average traces of Ca2+ fluorescence signal before (baseline; 0 to 60 s) and after (520 to 580 s) the addition of vehicle or BayK at ~90 s. In pcDNA-transfected neurons (control), Ca2+ fluorescence increases with BayK (black) compared to vehicle treatment (gray). In DJ-1 overexpressing neurons, addition of BayK (red) has similar Ca2+ fluorescence as vehicle treatment (pink). (Right) Quantification of change in fluorescence (ΔF) normalized to baseline (F). Significance determined by two-way ANOVA (F1,34 = 12.04, P = 0.0014) and genotype (F1,34 = 7.22, P = 0.0111). pcDNA-Vehicle (gray, 5.80 ± 3.16, n = 4 dendrites, 4 neurons) vs. pcDNA-BayK (black, 57.07 ± 14.81, n = 6 dendrites, 4 neurons), DJ-1-OE-Vehicle (pink, −3.10 ± 6.04, n = 17 dendrites, 11 neurons) vs. DJ-1-OE-BayK (red, 13.44 ± 7.57, n = 11 dendrites, 9 neurons). Statistical tests: A and B by Student’s t test; C by two-way ANOVA. Bar values represent mean ± SEM. *P < 0.05, **P < 0.01.
Fig. 4.
Fig. 4.
Tsc1 cKO neurons have reduced levels of calcium channel-associated proteins and L-VGCC function. (AC) Map2 staining (red) marks dendrites. (A) CaV1.2 (blue). Compared to wild type (WT, Top), TSC1cKO dendrites (Bottom) have less CaV1.2 as quantified (Right). CaV1.2/Map2: (WT = 1.00 ± 0.10, n = 27 neurons; Tsc1 cKO = 0.66 ± 0.09, n = 23 neurons; P = 0.0129). (B) α2δ2 (blue) expression is greater in WT (Top) than Tsc1 cKO as quantified (Right). α2δ2/Map2 (control = 1.00 ± 0.10, n = 15 neurons; Tsc1 cKO = 0.52 ± 0.08, n = 12 neurons; P = 0.0017). (C) Representative WT (Top) and Tsc1 cKO (Bottom) neurons express α2δ1 (blue) in dendrites. α2δ1/Map2 (WT = 1.00 ± 0.12, n = 30 neurons; Tsc1 cKO = 1.69 ± 0.21, n = 34 neurons; P < 0.0085). (D) (Left) Average traces of calcium fluorescence before (baseline; 0 to 60 s) and after (520 to 580 s) the addition of vehicle or BayK at ~90 s. With BayK, dendritic calcium fluorescence increases in WT (black) but not in Tsc1 cKO (red). (Right) Quantification of change in fluorescence (ΔF) normalized to baseline (F). Two-way ANOVA revealed a significant main effect of treatment (F1,76 = 8.15, P = 0.0055), genotype (F1,76 = 9.64, P = 0.0027), and a significant genotype × treatment interaction (F1,76 = 6.591, P = 0.0122). WT-Vehicle (gray, −0.96 ± 1.12, n = 20 dendrites, 15 neurons) vs. WT-BayK (black, 27.92 ± 6.39, n = 14 dendrites, 11 neurons) Tsc1cKO-Vehicle (pink, −3.82 ± 2.98, n = 28 dendrites, 20 neurons) vs. Tsc1cKO-BayK (red, −2.29 ± 2.44, n = 18 dendrites, 14 neurons). Statistical tests: A through C by t test; D by two-way ANOVA, Tukey post hoc test. Bar values represent mean ± SEM. *P < 0.05, ***P < 0.001, ****P < 0.0001.
Fig. 5.
Fig. 5.
The APP/PS1 preclinical model of AD exhibits aberrant DJ-1 expression and CaV1.2 and a2d2 de novo translation. (A) In hippocampal neuronal cultures, expression of DJ-1 (blue) in dendrites (Map2, red), yellow arrows indicate puncta, is low in WT (Top) compared to APP/PS1 (Bottom) as quantified (Right). Quantification: WT = 1.00 ± 0.088, n = 133 dendrites, 48 neurons; APP/PS1 = 1.89 ± 0.10, n = 143 dendrites, 50 neurons, ****P < 0.0001. (B) (Top). qRT-PCR from DJ-1-RIP from APP/PS1 and WT animals, showing Cacna1c and Cacna2d2 bind to DJ-1. Cacna1c: WT = 0.06 ± 0.01, APP/PS1 = 0.87 ± 0.2, P = 0.01. Cacna2d2: WT = 0.02 ± 0.01, APP/PS1 = 0.89 ± 0.3, P = 0.03. Cacna2d1: WT = 0.26 ± 0.1, APP/PS1 = 0.27 ± 0.07, P = 0.99. Akt1: WT = 0.01 ± 0.01, APP/PS1 = 0.61 ± 0.05, P = 0.0004. Gapdh: WT = 0.11 ± 0.06, APP/PS1 = 0.15 ± 0.08, P = 0.71. (Bottom) qRT-PCR of 5% of the input from APP/PS1 or WT. Cacna1c: WT = 1 ± 0.06, APP/PS1 = 0.91 ± 0.14, P = 0.61. Cacna2d2: WT = 1 ± 0.08, APP/PS1 = 0.57 ± 0.10, P = 0.0042. Cacna2d1: WT = 1 ± 0.04, APP/PS1 = 1.3 ± 0.22, P = 0.23. Akt1: WT = 1 ± 0.04, APP/PS1 = 1.2 ± 0.11, P = 0.14. Gapdh: WT = 1 ± 0.05, APP/PS1 = 1.28 ± 0.03, P = 0.0001. n = 3 technical replicates, 3 independent mice. t test, two-tailed. (C) De novo protein synthesis, SUnSET-PLA (green) in dendrites (MAP2, red). (Left) CaV1.2 is basally translated in WT but is repressed in APP/PS1 as quantified in rightmost panel. Quantification (Bottom): WT = 1.00 ± 0.09, n = 110 total ROIs, 15 to 21 ROIs/slice, 3 slices/animal, 3 animals; APP/PS1 = 0.01 ± 0.003, n = 114 total ROIs, 15 to 21 ROIs/slice, 3 slices/animal, 3 animal. (Middle) Basal translation of α2δ2 is robust in WT but is attenuated in APP/PS1 as quantified in rightmost panel. Quantification (Bottom): WT = 1.00 ± 0.13, n = 100 total ROIs, 15 to 21 ROIs/slice, 3 slices/animal, 3 animals; APP/PS1 = 0.03 ± 0.005, n = 100 total ROIs, 15 to 21 ROIs/slice, 3 slices/animal, 3 animals. (Right) New synthesis of α2δ1 protein in WT is lower than APP/PS1 as quantified in rightmost panel. Quantification (Bottom): WT = 1.00 ± 0.14, n = 104 total ROIs, 15 to 21 ROIs/slice, 3 slices/animal, 3 animals; APP/PS1 = 2.00 ± 0.14, n = 112 total ROIs, 15 to 21 ROIs/slice, 3 slices/animal, 3 animals. For representative images, CaV1.2, α2δ2, and α2δ1 puncta were dilated once using ImageJ. Statistical tests: A and C by Student’s t test. Bar values represent mean ± SEM. ****P < 0.0001.
Fig. 6.
Fig. 6.
APP/PS1 neurons express reduced levels of calcium channel-associated proteins and L-type VGCC function. (AC) Map2 staining (red) marks dendrites. (A) CaV1.2 proteins (blue) in dendrites, wild type (WT, Top), APP/PS1 dendrites (Bottom) have less CaV1.2. (Right) Quantification of CaV1.2/Map2: WT = 1.00 ± 0.06, n = 114 dendrites, 39 neurons; APP/PS1 = 0.45 ± 0.05, n = 108 dendrites, 38 neurons. (B) α2δ2 (blue) expression is greater in WT (Top) than APP/PS1 (Bottom). (Right) Quantification of α2δ2/Map2: WT = 1.00 ± 0.10, n = 104 dendrites, 38 neurons; APP/PS1 = 0.79 ± 0.08, n = 98 dendrites, 39 neurons. (C) Representative WT (Top) and APP/PS1 (Bottom) neurons express α2δ1 (blue) in dendrites. APP/PS1 dendrites express more α2δ1. (Right) Quantification of α2δ1/Map2 WT = 1.00 ± 0.11, n = 91 dendrites, 35 neurons; APP/PS1 = 1.30 ± 0.10, n = 85 dendrites, 32 neurons. (D) L-VGCC function as measured by BayK-induced calcium fluorescence is absent in APP/PS1. (Left) Average traces of calcium fluorescence before (baseline; 0 to 60 s) and after (520 to 580 s) the addition of vehicle or BayK at ~90 s. In BayK, dendritic calcium fluorescence increases in WT (black) but not in APP/PS1 (red). (Right) Quantification of change in fluorescence (ΔF) normalized to baseline (F). ΔF/F was determined by normalizing ΔF of each condition/genotype to its respective baseline fluorescence (F). Two-way ANOVA revealed a significant main effect of treatment (F1,60 = 9.962, P = 0.0025) but not genotype (F1,60 = 3.512, P = 0.0658). There was a significant genotype × treatment interaction (F1,60 = 16.72, P = 0.0001). Tukey’s multiple comparisons post hoc test revealed a significant difference between WT-Vehicle (gray, −9.86 ± 3.57, n = 14 dendrites, 11 neurons) vs. WT-BayK (black, 26.90 ± 7.27, n = 16 dendrites, 12 neurons), but no significant difference between APP/PS1-Vehicle (pink, 1.3810 ± 3.87, n = 19 dendrites, 15 neurons) vs. APP/PS1-BayK (red, −4.51 ± 4.51, n = 15 dendrites, 12 neurons). There is a significant difference between WT-BayK vs. APP/PS1-BayK. Statistical tests: A through C by Student’s t test; D by two-way ANOVA. Bar values represent mean ± SEM. *P < 0.05, ***P < 0.001, ****P < 0.0001.
Fig. 7.
Fig. 7.
Synapses isolated from prefrontal cortex of AD individuals express upregulation of mTORC1 signaling and DJ-1 levels, and downregulation of CaV1.2 and α2δ2 levels. (A) Western blot of phosphorylated S6 ribosomal protein (Ser240/244) (control = 1.00 ± 0.07, n = 3; AD = 1.94 ± 0.34, n = 3) (B) DJ-1 protein (control = 1.00 ± 0.15, n = 5; AD = 1.56 ± 0.18, n = 5;). (C) AD patient synapses have decreased CaV1.2 (control = 1.00 ± 0.20, n = 5; AD = 0.42 ± 0.21, n = 5) and (D) decreased α2δ2 levels (control = 1.00 ± 0.15, n = 4; AD = 0.45 ± 0.20, n = 3). Statistical tests: Student’s t test. Bar values represent mean ± SEM. *P < 0.05. For pathological details, see SI Appendix, Fig. S6.

References

    1. Modi M. E., Sahin M., Tau: A novel entry point for mTOR-based treatments in autism spectrum disorder? Neuron 106, 359–361 (2020). - PubMed
    1. Davis P. E., Peters J. M., Krueger D. A., Sahin M., Tuberous sclerosis: A new frontier in targeted treatment of autism. Neurotherapeutics 12, 572–583 (2015). - PMC - PubMed
    1. Habib S. L., et al. , Role of tuberin in neuronal degeneration. Neurochem. Res. 33, 1113–1116 (2008). - PMC - PubMed
    1. Saxton R. A., Sabatini D. M., mTOR signaling in growth, metabolism, and disease. Cell 168, 960–976 (2017). - PMC - PubMed
    1. Tsukumo Y., Sonenberg N., Alain T., Transcriptional induction of 4E-BP3 prolongs translation repression. Cell Cycle 15, 3325–3326 (2016). - PMC - PubMed

Publication types