

The exploration of mitochondrial-related features helps to reveal the prognosis and immunotherapy methods of colorectal cancer
- PMID: 37903487
- PMCID: PMC10809275
- DOI: 10.1002/cnr2.1914
The exploration of mitochondrial-related features helps to reveal the prognosis and immunotherapy methods of colorectal cancer
Abstract
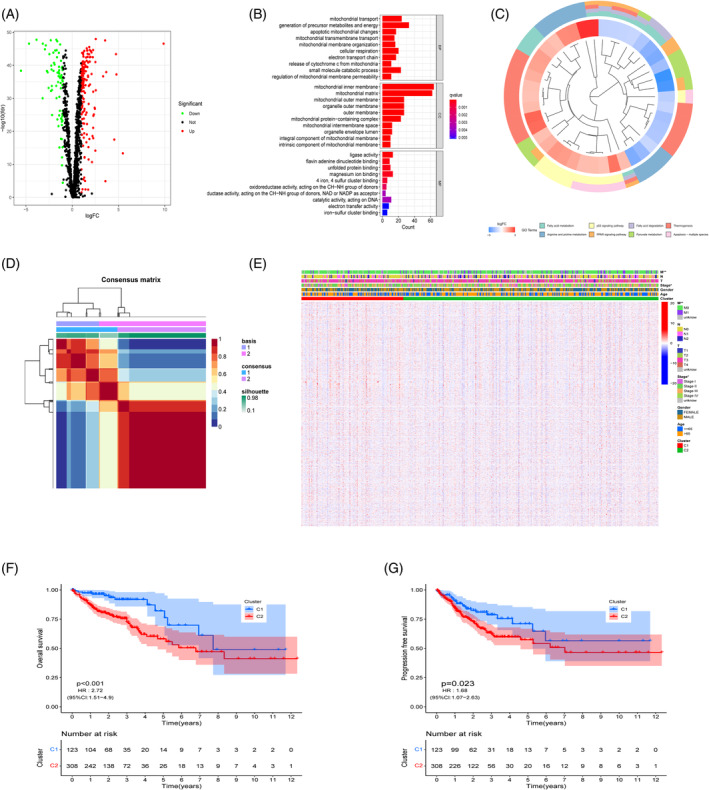
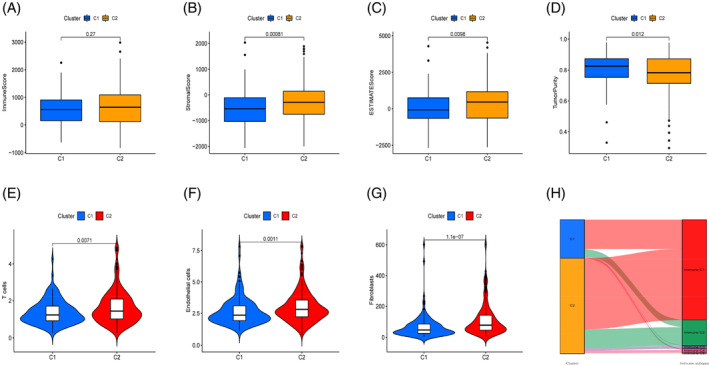
Background: Cancer cell survival, proliferation, and metabolism are all intertwined with mitochondria. However, a complete description of how the features of mitochondria relate to the tumor microenvironment (TME) and immunological landscape of colorectal cancer (CRC) has yet to be made. We performed subgroup analysis on CRC patient data obtained from the databases using non-negative matrix factorization (NMF) clustering. Construct a prognostic model using the mitochondrial-related gene (MRG) risk score, and then compare it to other models for accuracy. Comprehensive analyses of the risk score, in conjunction with the TME and immune landscape, were performed, and the relationship between the model and different types of cell death, radiation and chemotherapy, and drug resistance was investigated. Results from immunohistochemistry and single-cell sequencing were utilized to verify the model genes, and a drug sensitivity analysis was conducted to evaluate possible therapeutic medicines. The pan-cancer analysis is utilized to further investigate the role of genes in a wider range of malignancies.
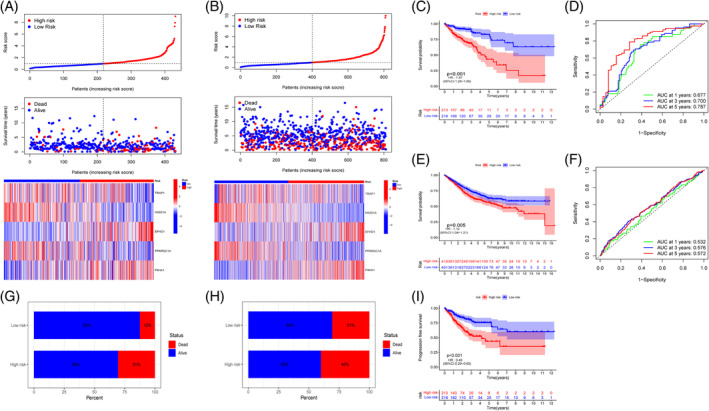
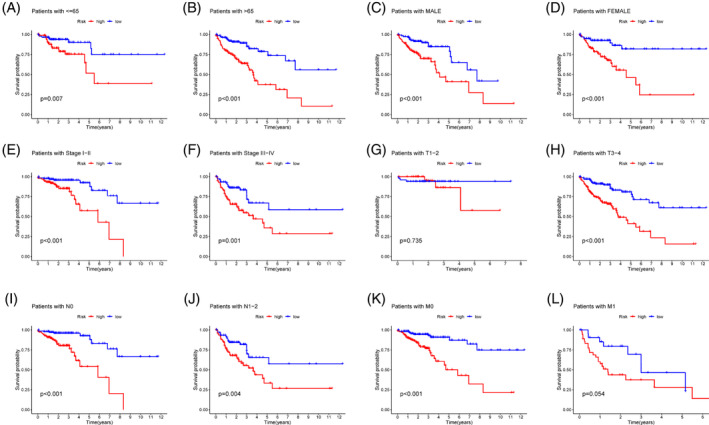
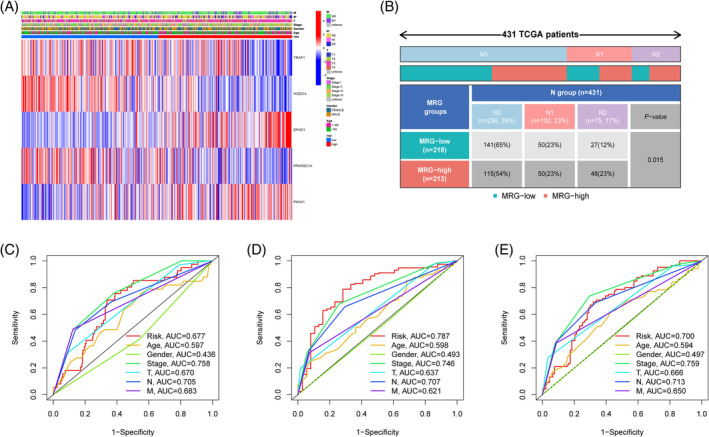
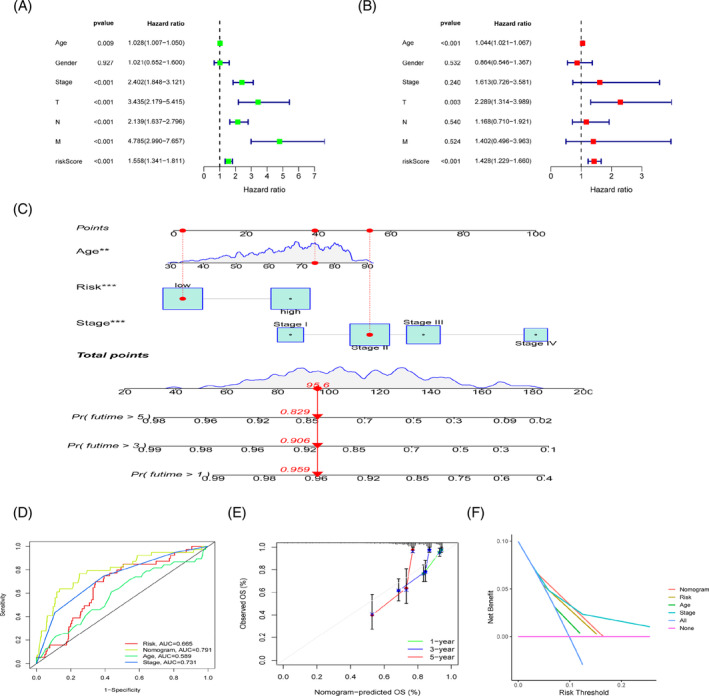
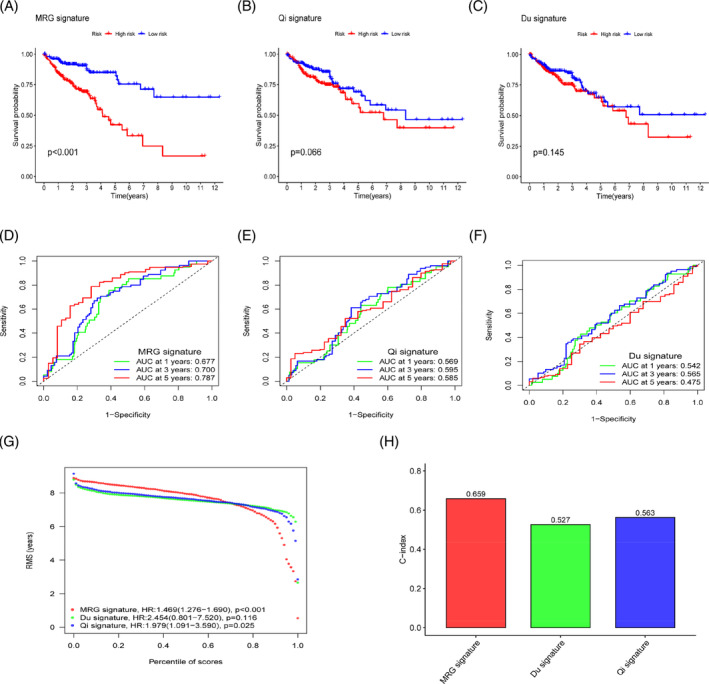
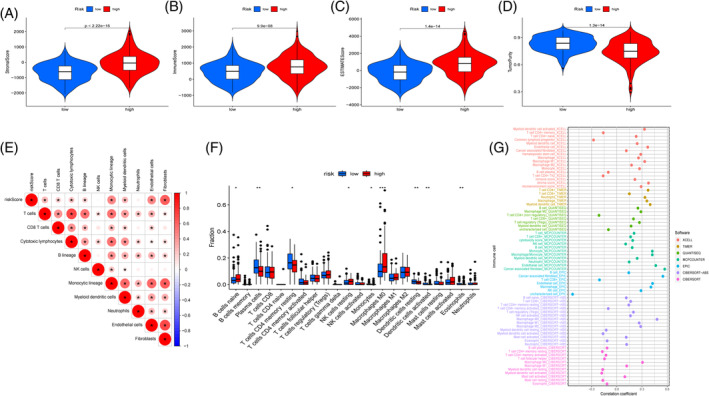
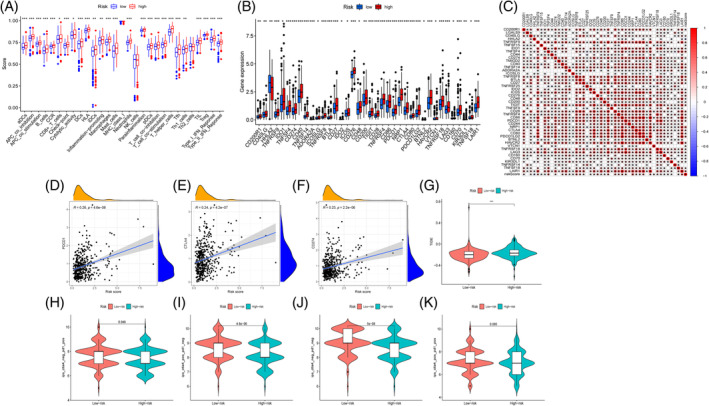
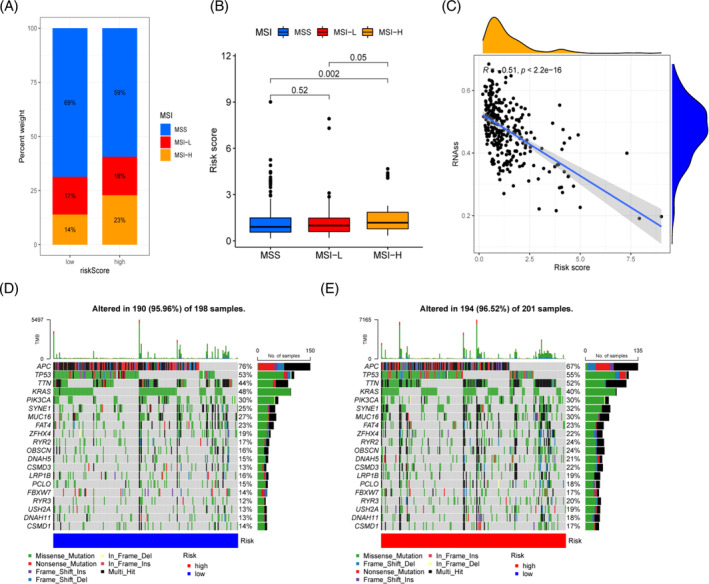
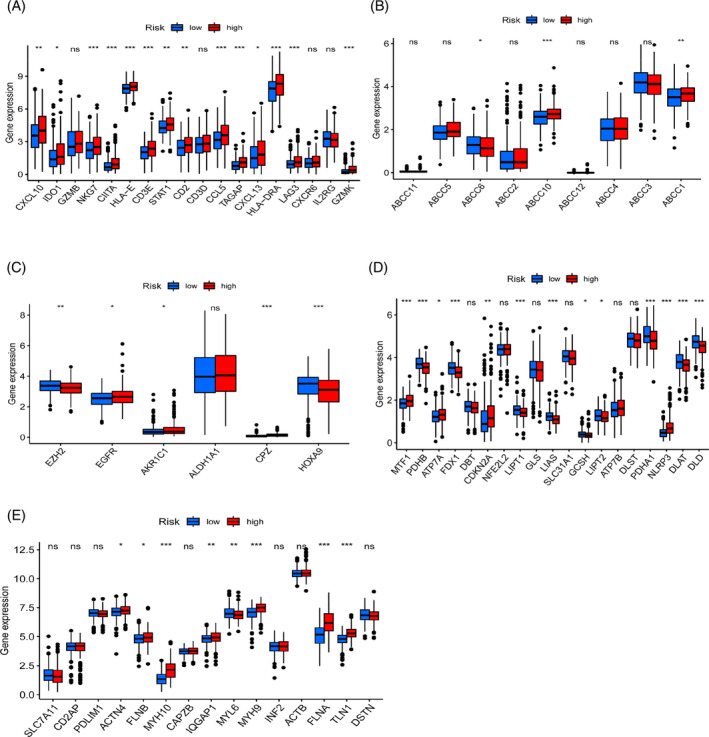
Methods and results: We found that CRC patients based on MRG were divided into two groups with significant differences in survival outcomes and TME between groups. The predictive power of the risk score was further shown by building a prognostic model and testing it extensively in both internal and external cohorts. Multiple immune therapeutic responses and the expression of immunological checkpoints demonstrate that the risk score is connected to immunotherapy success. The correlation analysis of the risk score provide more ideas and guidance for prognostic models in clinical treatment.
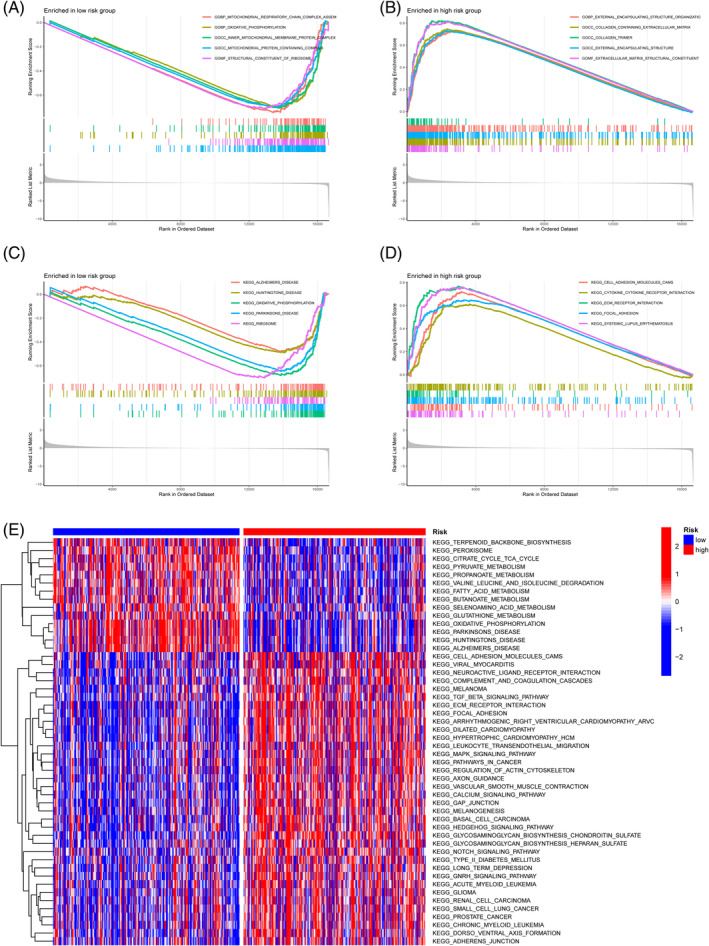
Conclusion: The TME, immune cell infiltration, and responsiveness to immunotherapy in CRC were all thoroughly evaluated on the basis of MRG features. The comparative validation of multiple queues and models combined with clinical data ensures the effectiveness and clinical practicality of MRG features. Our studies help clinicians create individualized treatment programs for individuals with cancer.
Keywords: colorectal cancer; immune landscape; mitochondrial; prognosis.
© 2023 The Authors. Cancer Reports published by Wiley Periodicals LLC.
Conflict of interest statement
The authors have stated explicitly that there are no conflicts of interest in connection with this article.
Figures
Similar articles
-
Tumor microenvironment characterization in colorectal cancer to identify prognostic and immunotherapy genes signature.BMC Cancer. 2023 Aug 18;23(1):773. doi: 10.1186/s12885-023-11277-4. BMC Cancer. 2023. PMID: 37596528 Free PMC article.
-
Computational identification and clinical validation of a novel risk signature based on coagulation-related lncRNAs for predicting prognosis, immunotherapy response, and chemosensitivity in colorectal cancer patients.Front Immunol. 2023 Oct 19;14:1279789. doi: 10.3389/fimmu.2023.1279789. eCollection 2023. Front Immunol. 2023. PMID: 37928532 Free PMC article.
-
Prognosis of colorectal cancer, prognostic index of immunogenic cell death associated genes in response to immunotherapy, and potential therapeutic effects of ferroptosis inducers.Front Immunol. 2024 Sep 20;15:1458270. doi: 10.3389/fimmu.2024.1458270. eCollection 2024. Front Immunol. 2024. PMID: 39372411 Free PMC article.
-
Developing a machine learning-based prognosis and immunotherapeutic response signature in colorectal cancer: insights from ferroptosis, fatty acid dynamics, and the tumor microenvironment.Front Immunol. 2024 Jul 15;15:1416443. doi: 10.3389/fimmu.2024.1416443. eCollection 2024. Front Immunol. 2024. PMID: 39076986 Free PMC article.
-
Is There a Role for Programmed Death Ligand-1 Testing and Immunotherapy in Colorectal Cancer With Microsatellite Instability? Part I-Colorectal Cancer: Microsatellite Instability, Testing, and Clinical Implications.Arch Pathol Lab Med. 2018 Jan;142(1):17-25. doi: 10.5858/arpa.2017-0040-RA. Epub 2017 Nov 16. Arch Pathol Lab Med. 2018. PMID: 29144791 Review.
Cited by
-
A mitochondria-related genes associated neuroblastoma signature - based on bulk and single-cell transcriptome sequencing data analysis, and experimental validation.Front Immunol. 2024 Jun 19;15:1415736. doi: 10.3389/fimmu.2024.1415736. eCollection 2024. Front Immunol. 2024. PMID: 38962012 Free PMC article.
References
-
- Sung H, Ferlay J, Siegel RL, et al. Global cancer statistics 2020: GLOBOCAN estimates of incidence and mortality worldwide for 36 cancers in 185 countries. CA Cancer J Clin. 2021;71(3):209‐249. - PubMed
-
- Dekker E, Tanis PJ, Vleugels JLA, Kasi PM, Wallaceet M. Colorectal cancer. Lancet. 2019;394:1467‐1480. - PubMed
-
- Snaebjornsson P, Jonasson L, Olafsdottir EJ, et al. Why is colon cancer survival improving by time? A nationwide survival analysis spanning 35 years. Int J Cancer. 2017;141(3):531‐539. - PubMed
-
- Siegel RL, Miller KD, Goding Sauer A, et al. Colorectal cancer statistics, 2020. Canc J Clinic. 2020;70(3):145‐164. - PubMed
Publication types
MeSH terms
Grants and funding
LinkOut - more resources
Full Text Sources
Medical
