. 2023 Nov 15;14(22):3993-4012.
doi: 10.1021/acschemneuro.3c00442. Epub 2023 Oct 30.

Patient Brain Organoids Identify a Link between the 16p11.2 Copy Number Variant and the RBFOX1 Gene

Affiliations

Patient Brain Organoids Identify a Link between the 16p11.2 Copy Number Variant and the RBFOX1 Gene

Milos Kostic et al. ACS Chem Neurosci. .

Abstract

Copy number variants (CNVs) that delete or duplicate 30 genes within the 16p11.2 genomic region give rise to a range of neurodevelopmental phenotypes with high penetrance in humans. Despite the identification of this small region, the mechanisms by which 16p11.2 CNVs lead to disease are unclear. Relevant models, such as human cortical organoids (hCOs), are needed to understand the human-specific mechanisms of neurodevelopmental disease. We generated hCOs from 17 patients and controls, profiling 167,958 cells with single-cell RNA-sequencing analysis, which revealed neuronal-specific differential expression of genes outside the 16p11.2 region that are related to cell-cell adhesion, neuronal projection growth, and neurodevelopmental disorders. Furthermore, 16p11.2 deletion syndrome organoids exhibited reduced mRNA and protein levels of RBFOX1, a gene that can also harbor CNVs linked to neurodevelopmental phenotypes. We found that the genes previously shown to be regulated by RBFOX1 are also perturbed in organoids from patients with the 16p11.2 deletion syndrome and thus identified a novel link between independent CNVs associated with neuronal development and autism. Overall, this work suggests convergent signaling, which indicates the possibility of a common therapeutic mechanism across multiple rare neuronal diseases.

Keywords: 16p11.2; CNV; RBFOX1; autism; brain organoids; scRNA-seq.


Conflict of interest statement

The authors declare the following competing financial interest(s): During the time of this research, all scientists were employed by the Novartis Institutes for BioMedical Research.

Figures
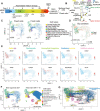
Figure 1
Figure 1
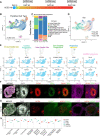
Semi-automated generation of hCOs yields crucial aspects of human neurogenesis. (A) Schematic of hCO differentiation and methanol fixation protocols for the cell line hESC-H1. (B) Schematic of neocortical development and its main cell types. (C) Uniform manifold approximation and projection (UMAP) embedding plot of 4939 methanol-fixed cells and 4570 fresh cells, 37 day old hCOs, with all identified cell types; sample of 20 hCOs (10 fresh and 10 fixed) and the cell line hESC-H1. (D) UMAP plot showing the overlap of methanol fixed and fresh cortical organoid cells, Pearson’s correlation r = 0.968. (E) UMAP plots showing expression of canonical gene markers for main cell types, which were identified in fresh and fixed cells combined at day 37. (F) UMAP plot integration of hCOs (day 37, 9509 fixed and fresh cells) with fetal brain atlas (GW17–18, ∼40,000 cells,), a majority of hCO cells were allocated to the neuronal progenitor and immature identities; GW—gestational week. (G) RNA velocity is projected onto a predefined UMAP plot, hCOs (day 37) fixed and fresh cells combined. The length of the arrow annotates the transcriptional dynamics, and the direction of the arrow points to the future state of cells. Inset: potential indirect neurogenesis in hCOs. EBM, embryoid body medium; TPM, telencephalon patterning medium; NIM, neural induction medium; NM, neuronal medium; vRG, ventral radial glia; oRG, outer radial glia; IP, intermediate progenitors; EN, excitatory neurons; ventricular zone, VZ; subventricular zone, SVZ; intermediate zone, IZ; cortical plate, CP.
Figure 2
Figure 2
Longitudinal scRNA-seq profiling of hCO maturation. (A) Timeline of hCO differentiation, cell line hESC-H9. (B) scRNA-seq data set generated from three different ages of hCOs (day 30, day 90, and day 166; total = 24,662 cells), cell line hESC-H9. (C) Stacked bar plot showing relative distribution of cell types in hCOs measured by scRNA-seq split by age (day 30, day 90, and day 166), each column representing 10 randomly sampled organoids pooled and analyzed, cell line hESC-H9. (D) UMAP plot of hCO scRNA-seq data set split by age (day 30 [green] = 8955 cells, day 90 [orange] = 5969 cells, and day 166 [blue] = 10,011 UMAP plots showing expression of markers for main types of cells identified in hCOs, vRG (SOX2 and VIM), cycling progenitors (MKI67 and TOP2A), oRG (PTPRZ1 and HOPX), IP (EOMES and PPP1R17), projection neurons (NFIB and SATB2), and INs (DLX5 and GAD2). (F) Triple immunofluorescence for SOX2 (red), TBR2 (green), and MAP2 (magenta), combined with DAPI staining (white) of hCOs at day 90. Box indicates a representative neural rosette that is shown at a higher magnification; scale bars: 1000 and 100 μm, cell line hESC-H9. (G) Triple immunofluorescence for HOPX (red), GAD67 (green), and CTIP2 (magenta) combined with DAPI staining (white) of hCOs at day 90. Box indicates a representative neural rosette that is shown at a higher magnification; scale bars: 1000 and 100 μm, cell line hESC-H9. (H) Box plot showing prediction score for the identified cell type in scRNA-seq analysis of different data sets, split by protocol (guided and unguided protocols), (see Table S1).
Figure 3
Figure 3
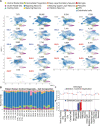
hCOs derived from control and 16p11.2 patient iPSC lines show similar cell composition. (A) scRNA-seq data UMAP embedding of individual iPSC lines from 90 day old hCOs after batch correction, control n = 4, hemideletions n = 6, and hemiduplication n = 8; total number of cells, 167,958. Note that CTRL_H9 and CTRL_8402 control lines contain higher numbers of cells as they were profiled throughout the multiple 10× single-cell runs (see also Figure S3D). (B) Stacked bar plots showing a relative distribution of cell types measured by scRNA-seq for 90 day old hCOs; each column represents an iPSC line, 10 randomly sampled organoids were pooled for each line. Note that CTRL_H9 and CTRL_8402 were profiled 5 and 2 times, respectively, in different experiments. (C) Box plot showing prediction score for the identified cell type in scRNA-seq analysis in hCOs, split by genotype, control n = 4, hemideletions (DEL) n = 6, and hemiduplications (DUP) n = 8. (D) Bar plot showing the average fraction of individual cell types per genotype in hCOs, control n = 4, hemideletions (DEL) n = 6, and hemiduplications (DUP) n = 8. Error bars represent the standard deviation.
Figure 4
Figure 4
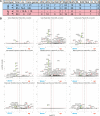
16p11.2 hemideletion alters gene expression within and outside of locus in patient-derived cortical organoids. (A) Expression of 16p11.2 genes in hCOs (day 90), pseudobulk analyses in deletion (DEL, blue), control (gray), and duplication (DUP, red); blue and red lanes below the graph represent the most common CNV (hemideletion [534 kbp] or hemiduplication [740 kbp]) of the donors analyzed. Each dot presents a cell line. The Y-axis represents normalized counts *p < 0.05, **p < 0.01, ***p < 0.001 (ANOVA test). (B) Volcano plot showing DE genes in patient hemideletions vs control lines, all cell types collectively; 16p11.2 genes are colored green; cutoff-adjusted p-value <0.1. (C) Selected DEGs that are downregulated and upregulated in patient hemideletion (DEL) vs control hCOs. *p < 0.05, **p < 0.01, ***p < 0.001 (ANOVA test).
Figure 5
Figure 5
Hemideletion of 16p11.2 patient hCOs exhibiting cell-type-specific alterations of gene expression. (A) Table showing number of genes that are downregulated and upregulated in patient hemideletions vs control (blue rows), and patient hemiduplication vs control (red rows), split by the cell type (columns). Cis = genes within 16p locus. Trans = genes outside of the 16p locus. (B) Volcano plots showing DE genes in patient hemideletions (DEL) vs control lines, split by the cell types; 16p11.2 genes are colored green, and selected DEGs are colored red; cutoff-adjusted p-value <0.1. vRG, ventral radial glia; oRG, outer radial glia; CycCell, cycling cells; IP, intermediate progenitors; MigN, migrating neurons; MatN, maturing neurons; Dl_ExN, deep-layer excitatory neurons; May_Ul_N, maturing upper-layer neurons; IN, inhibitory neurons.
Figure 6
Figure 6
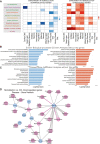
Functional categories, GO, and disease–gene enrichment analysis of 90 day old cortical organoids in control and 16p11.2 patient hemideletion lines. (A) Enrichment of functional categories derived from GO clustering of genes that are downregulated and upregulated in hemideletions, split by cell types (NES, normalized enrichment score); (see Table S4). (B) Top 10 GO: biological processes for downregulated (blue) and upregulated (red) genes in hemideletions (cutoff-adjusted p-value < 0.1), ordered by their enrichment p-value; the x-axis is converted–log 10(p-value) (see Table S4). (C) Top 10 gene–disease associations for downregulated (blue) and upregulated (red) genes in hemideletions (cutoff-adjusted p-value <0.1), ordered by their enrichment p-value; the x-axis is converted–log 10(p-value) (see Table S5). (D) Graphical representation of the gene–disease network for downregulated genes in patient hemideletion hCOs (see Table S5).
Figure 7
Figure 7
16p11.2 hemideletion of hCOs exhibits reduced expression of RBFOX1. (A) High-content imaging of hCO cryosections and strategy to detect live cells, RBFOX1-positive cells, and SOX2-positive cells. (B) Double immunofluorescence for RBFOX1 (green) and SOX2 (red), combined with DAPI staining (white), of hCOs at day 90; selected cell lines CTRL_8402_B1, CTRL_H9_B2, DEL8_B1, and DEL5_B2; scale bars: 100 μm. (C) Quantification of the percentage of RBFOX1-positive nuclei over total number of nuclei determined by DAPI on cryosections (20 μm) in control (CTRL, n = 6) and hemideletion (DEL, n = 6) 90 day old hCOs. Each data point presents an independent cell line, with CTRL_H9 and CTRL_8402 differentiated in two different batches. The mean ± SD is shown; *p < 0.05 (t-test) (see Table S6). (D) Quantification of the nuclear intensity of the RBFOX1 fluorescent signal in all live cells (determined by DAPI, see Methodssection) on cryosections (20 μm) in control (CTRL, n = 6) and hemideletions (DEL, n = 6) 90 day old hCOs. Average intensity of the fluorescent signal value of all controls was used to normalize data. Each data point presents an independent cell line, with CTRL_H9 and CTRL_8402 differentiated in two different batches. The mean ± SD is shown; *p < 0.05 (t-test), (see Table S6).

References

    1. Bill B. R.; Lowe J. K.; DyBuncio C. T.; Fogel B. L. Orchestration of Neurodevelopmental Programs by RBFOX1. Int. Rev. Neurobiol. 2013, 113, 251–267. 10.1016/B978-0-12-418700-9.00008-3. - DOI - PMC - PubMed
    1. Fogel B. L.; Wexler E.; Wahnich A.; Friedrich T.; Vijayendran C.; Gao F.; Parikshak N.; Konopka G.; Geschwind D. H. RBFOX1 Regulates Both Splicing and Transcriptional Networks in Human Neuronal Development. Hum. Mol. Genet. 2012, 21 (19), 4171–4186. 10.1093/hmg/dds240. - DOI - PMC - PubMed
    1. Lal D.; Reinthaler E. M.; Altmüller J.; Toliat M. R.; Thiele H.; Nürnberg P.; Lerche H.; Hahn A.; Møller R. S.; Muhle H.; Sander T.; Zimprich F.; Neubauer B. A. RBFOX1 and RBFOX3Mutations in Rolandic Epilepsy. PLoS One 2013, 8 (9), e7332310.1371/journal.pone.0073323. - DOI - PMC - PubMed
    1. Noor A.; Lionel A. C.; Cohen-Woods S.; Moghimi N.; Rucker J.; Fennell A.; Thiruvahindrapuram B.; Kaufman L.; Degagne B.; Wei J.; Parikh S. V.; Muglia P.; Forte J.; Scherer S. W.; Kennedy J. L.; Xu W.; McGuffin P.; Farmer A.; Strauss J.; Vincent J. B. Copy Number Variant Study of Bipolar Disorder in Canadian and UK Populations Implicates Synaptic Genes. Am. J. Med. Genet. 2014, 165 (4), 303–313. 10.1002/ajmg.b.32232. - DOI - PubMed
    1. Zarrei M.; Burton C. L.; Engchuan W.; Young E. J.; Higginbotham E. J.; MacDonald J. R.; Trost B.; Chan A. J. S.; Walker S.; Lamoureux S.; Heung T.; Mojarad B. A.; Kellam B.; Paton T.; Faheem M.; Miron K.; Lu C.; Wang T.; Samler K.; Wang X.; Costain G.; Hoang N.; Pellecchia G.; Wei J.; Patel R. V.; Thiruvahindrapuram B.; Roifman M.; Merico D.; Goodale T.; Drmic I.; Speevak M.; Howe J. L.; Yuen R. K. C.; Buchanan J. A.; Vorstman J. A. S.; Marshall C. R.; Wintle R. F.; Rosenberg D. R.; Hanna G. L.; Woodbury-Smith M.; Cytrynbaum C.; Zwaigenbaum L.; Elsabbagh M.; Flanagan J.; Fernandez B. A.; Carter M. T.; Szatmari P.; Roberts W.; Lerch J.; Liu X.; Nicolson R.; Georgiades S.; Weksberg R.; Arnold P. D.; Bassett A. S.; Crosbie J.; Schachar R.; Stavropoulos D. J.; Anagnostou E.; Scherer S. W. A Large Data Resource of Genomic Copy Number Variation across Neurodevelopmental Disorders. npj Genom. Med. 2019, 4 (1), 26.10.1038/s41525-019-0098-3. - DOI - PMC - PubMed

Publication types

Supplementary concepts

LinkOut - more resources