

Risk of hospital admission and death from first-ever SARS-CoV-2 infection by age group during the Delta and Omicron periods in British Columbia, Canada
- PMID: 37903524
- PMCID: PMC10615343
- DOI: 10.1503/cmaj.230721
Risk of hospital admission and death from first-ever SARS-CoV-2 infection by age group during the Delta and Omicron periods in British Columbia, Canada
Abstract
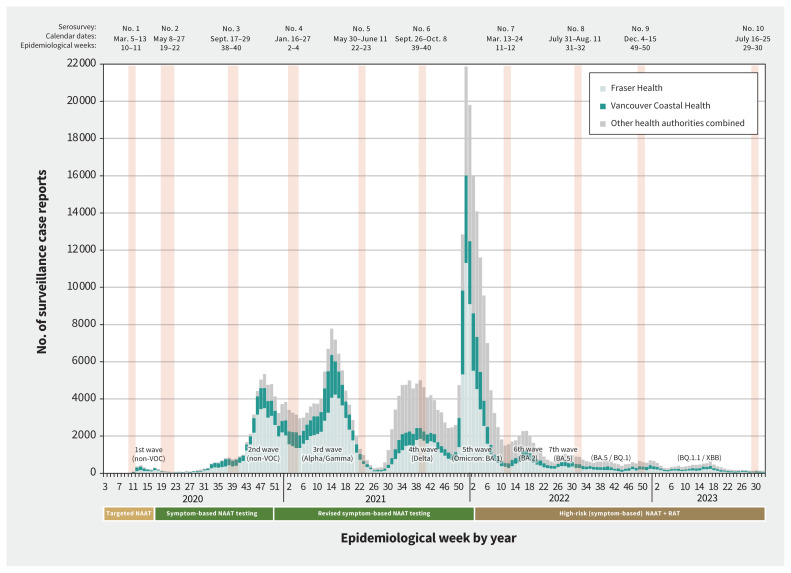
Background: Population-based cross-sectional serosurveys within the Lower Mainland, British Columbia, Canada, showed about 10%, 40% and 60% of residents were infected with SARS-CoV-2 by the sixth (September 2021), seventh (March 2022) and eighth (July 2022) serosurveys. We conducted the ninth (December 2022) and tenth (July 2023) serosurveys and sought to assess risk of severe outcomes from a first-ever SARS-CoV-2 infection during intersurvey periods.
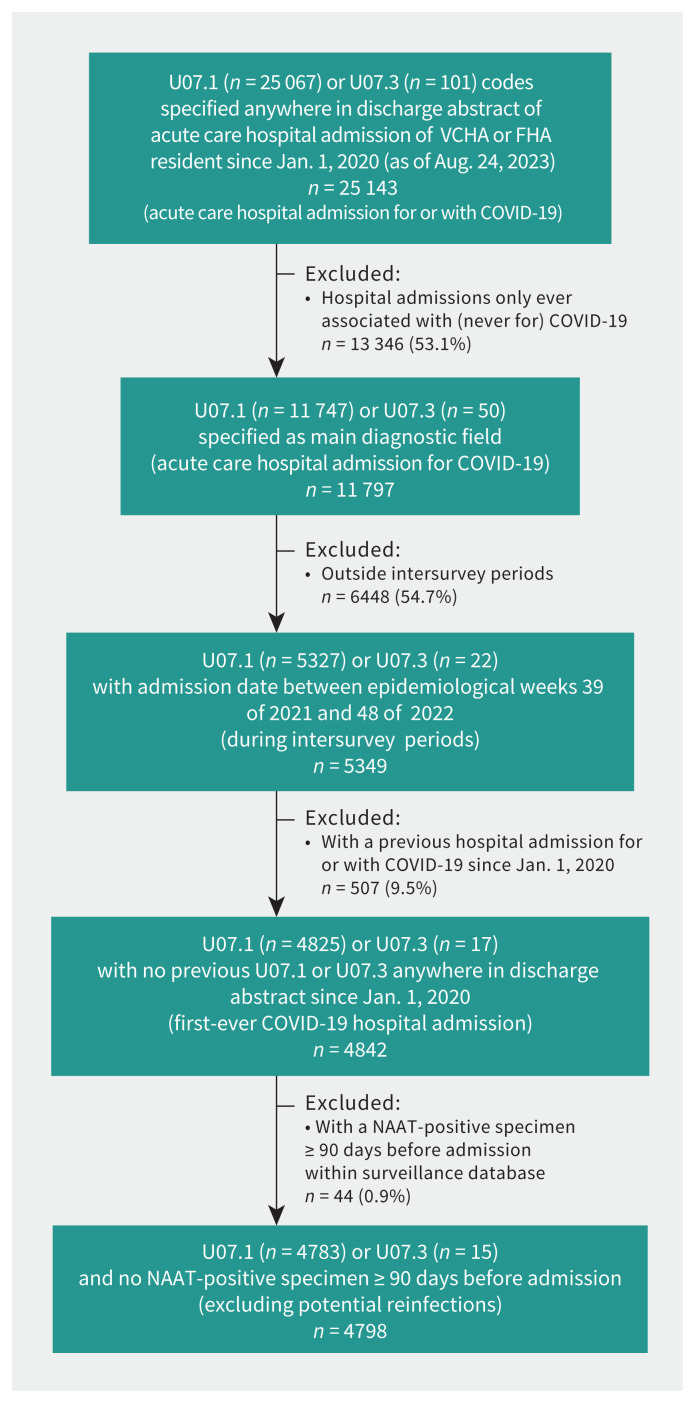
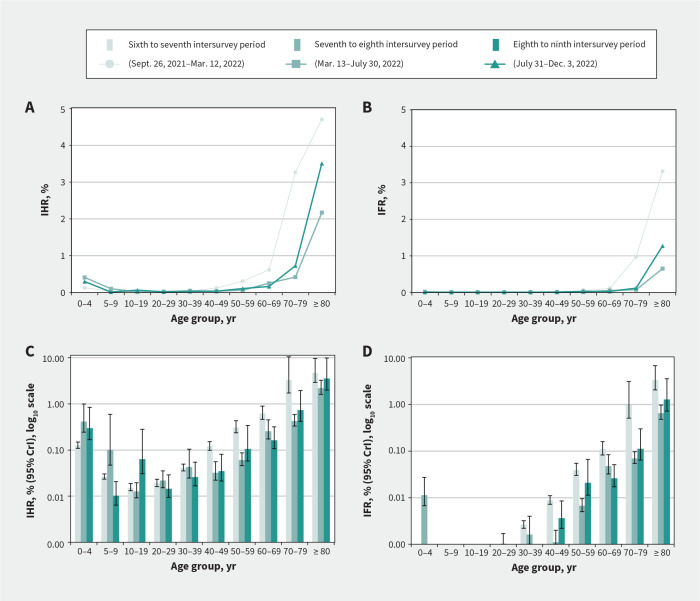
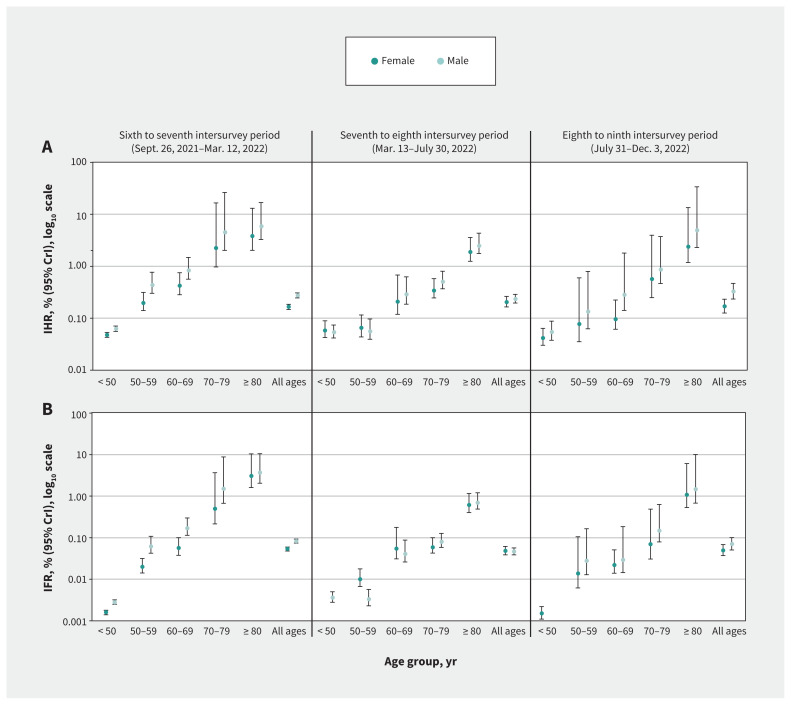
Methods: Using increments in cumulative infection-induced seroprevalence, population census, discharge abstract and vital statistics data sets, we estimated infection hospitalization and fatality ratios (IHRs and IFRs) by age and sex for the sixth to seventh (Delta/Omicron-BA.1), seventh to eighth (Omicron-BA.2/BA.5) and eighth to ninth (Omicron-BA.5/BQ.1) intersurvey periods. As derived, IHR and IFR estimates represent the risk of severe outcome from a first-ever SARS-CoV-2 infection acquired during the specified intersurvey period.
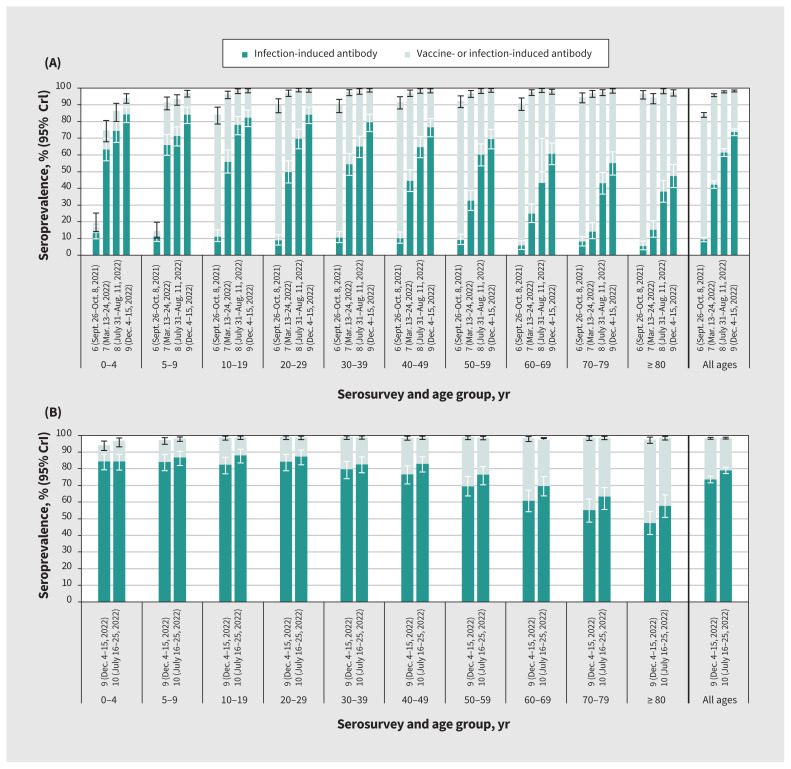
Results: The cumulative infection-induced seroprevalence was 74% by December 2022 and 79% by July 2023, exceeding 80% among adults younger than 50 years but remaining less than 60% among those aged 80 years and older. Period-specific IHR and IFR estimates were consistently less than 0.3% and 0.1% overall. By age group, IHR and IFR estimates were less than 1.0% and up to 0.1%, respectively, except among adults aged 70-79 years during the sixth to seventh intersurvey period (IHR 3.3% and IFR 1.0%) and among those aged 80 years and older during all periods (IHR 4.7%, 2.2% and 3.5%; IFR 3.3%, 0.6% and 1.3% during the sixth to seventh, seventh to eighth and eighth to ninth periods, respectively). The risk of severe outcome followed a J-shaped age pattern. During the eighth to ninth period, we estimated about 1 hospital admission for COVID-19 per 300 newly infected children younger than 5 years versus about 1 per 30 newly infected adults aged 80 years and older, with no deaths from COVID-19 among children but about 1 death per 80 newly infected adults aged 80 years and older during that period.
Interpretation: By July 2023, we estimated about 80% of residents in the Lower Mainland, BC, had been infected with SARS-CoV-2 overall, with low risk of hospital admission or death; about 40% of the oldest adults, however, remained uninfected and at highest risk of a severe outcome. First infections among older adults may still contribute substantial burden from COVID-19, reinforcing the need to continue to prioritize this age group for vaccination and to consider them in health care system planning.
© 2023 CMA Impact Inc. or its licensors.
Conflict of interest statement
Competing interests: Danuta Skowronski reports grants from the Canadian Institutes of Health Research and the BCCDC Foundation for Public Health, paid to her institution, for other SARS-CoV-2 work. Romina Reyes is chair of the British Columbia Diagnostic Accreditation Program committee. As the Provincial Health Officer with authority under the emergency provisions of the Public Health Act, Bonnie Henry authorized the provision and analysis of the anonymized sera used in this study; the study was separately reviewed and approved by the University of British Columbia Clinical Research Ethics Board. No other competing interests were declared.
Figures
Similar articles
-
Serial cross-sectional estimation of vaccine-and infection-induced SARS-CoV-2 seroprevalence in British Columbia, Canada.CMAJ. 2022 Dec 5;194(47):E1599-E1609. doi: 10.1503/cmaj.221335. CMAJ. 2022. PMID: 36507788 Free PMC article.
-
Estimating global, regional, and national daily and cumulative infections with SARS-CoV-2 through Nov 14, 2021: a statistical analysis.Lancet. 2022 Jun 25;399(10344):2351-2380. doi: 10.1016/S0140-6736(22)00484-6. Epub 2022 Apr 8. Lancet. 2022. PMID: 35405084 Free PMC article.
-
Dynamics of SARS-CoV-2 infection hospitalisation and infection fatality ratios over 23 months in England.PLoS Biol. 2023 May 25;21(5):e3002118. doi: 10.1371/journal.pbio.3002118. eCollection 2023 May. PLoS Biol. 2023. PMID: 37228015 Free PMC article.
-
SARS-CoV-2 infection and mortality during the first epidemic wave in Madurai, south India: a prospective, active surveillance study.Lancet Infect Dis. 2021 Dec;21(12):1665-1676. doi: 10.1016/S1473-3099(21)00393-5. Epub 2021 Aug 13. Lancet Infect Dis. 2021. PMID: 34399090 Free PMC article.
-
Age-stratified infection fatality rate of COVID-19 in the non-elderly population.Environ Res. 2023 Jan 1;216(Pt 3):114655. doi: 10.1016/j.envres.2022.114655. Epub 2022 Oct 28. Environ Res. 2023. PMID: 36341800 Free PMC article.
Cited by
-
Cost-Utility Analysis of COVID-19 Vaccination Strategies for Endemic SARS-CoV-2.JAMA Netw Open. 2025 Jun 2;8(6):e2515534. doi: 10.1001/jamanetworkopen.2025.15534. JAMA Netw Open. 2025. PMID: 40512495 Free PMC article.
-
Ratio of Infections to COVID-19 Cases and Hospitalizations in the United States based on SARS-CoV-2 Seroprevalence Data, September 2021-February 2022.Open Forum Infect Dis. 2025 Jan 16;12(1):ofae719. doi: 10.1093/ofid/ofae719. eCollection 2025 Jan. Open Forum Infect Dis. 2025. PMID: 39822271 Free PMC article.
-
2023/24 mid-season influenza and Omicron XBB.1.5 vaccine effectiveness estimates from the Canadian Sentinel Practitioner Surveillance Network (SPSN).Euro Surveill. 2024 Feb;29(7):2400076. doi: 10.2807/1560-7917.ES.2024.29.7.2400076. Euro Surveill. 2024. PMID: 38362622 Free PMC article.
-
Kinetics of pro- and anti-inflammatory spike-specific cellular immune responses in long-term care facility residents after COVID-19 mRNA primary and booster vaccination: a prospective longitudinal study in Japan.Immun Ageing. 2024 Jun 22;21(1):41. doi: 10.1186/s12979-024-00444-1. Immun Ageing. 2024. PMID: 38909235 Free PMC article.
References
-
- Carazo S, Skowronski DM, Brisson M, et al. . Effectiveness of previous infection-induced and vaccine-induced protection against hospitalisation due to omicron BA subvariants in older adults: a test-negative, case-control study in Quebec, Canada. Lancet Healthy Longev 2023;4:e409–20. - PubMed
-
- Carazo S, Skowronski DM, Brisson M, et al. . Estimated protection of prior SARS-CoV-2 infection against reinfection with the Omicron variant among messenger RNA-vaccinated and nonvaccinated individuals in Quebec, Canada. JAMA Netw Open 2022;5:e2236670. doi:10.1001/jamanetworkopen.2022.36670. - DOI - PMC - PubMed
MeSH terms
LinkOut - more resources
Full Text Sources
Medical
Research Materials
Miscellaneous