. 2023 Oct 30;9(1):54.
doi: 10.1038/s41540-023-00314-4.

PhysiBoSS 2.0: a sustainable integration of stochastic Boolean and agent-based modelling frameworks

Affiliations

PhysiBoSS 2.0: a sustainable integration of stochastic Boolean and agent-based modelling frameworks

Miguel Ponce-de-Leon et al. NPJ Syst Biol Appl. .

Abstract

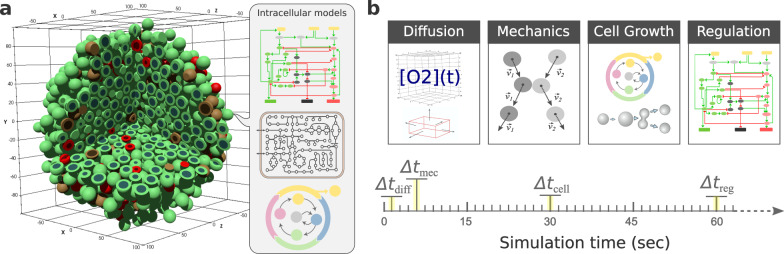
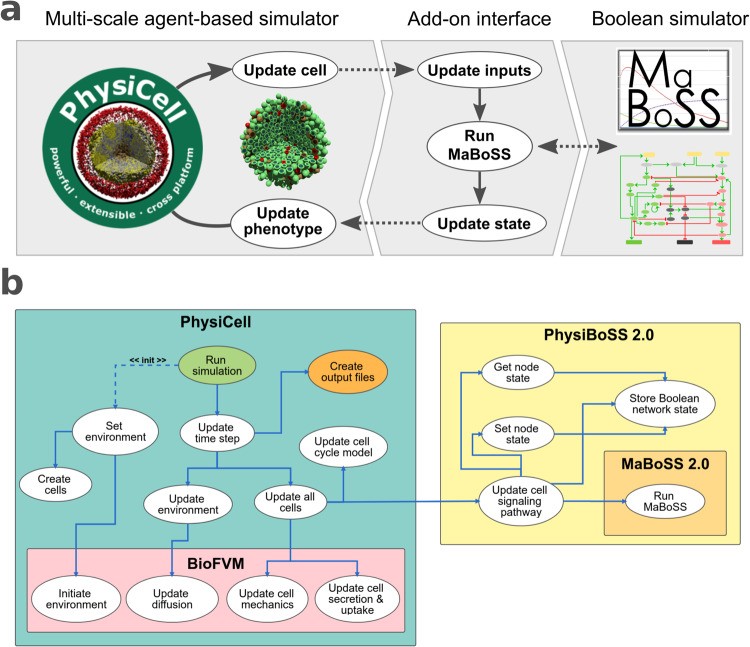
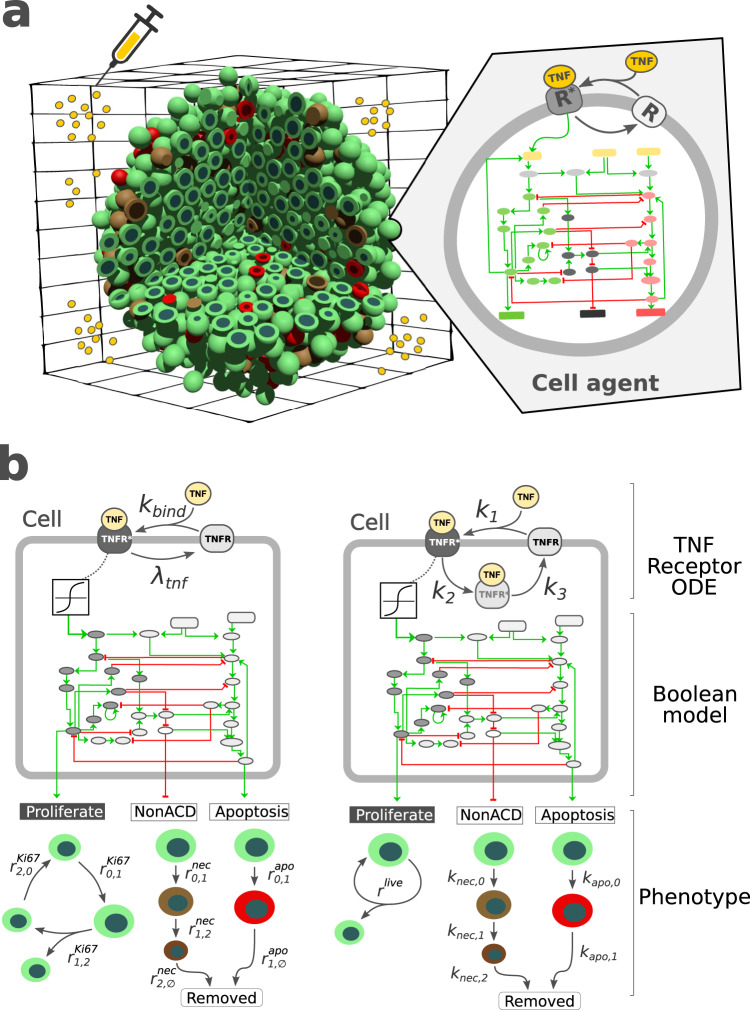
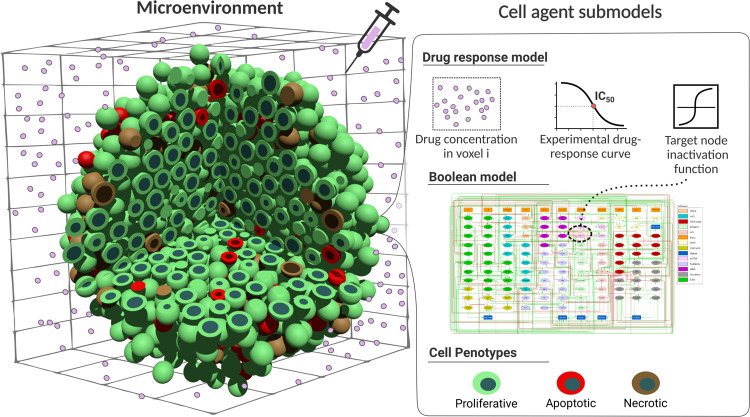
In systems biology, mathematical models and simulations play a crucial role in understanding complex biological systems. Different modelling frameworks are employed depending on the nature and scales of the system under study. For instance, signalling and regulatory networks can be simulated using Boolean modelling, whereas multicellular systems can be studied using agent-based modelling. Herein, we present PhysiBoSS 2.0, a hybrid agent-based modelling framework that allows simulating signalling and regulatory networks within individual cell agents. PhysiBoSS 2.0 is a redesign and reimplementation of PhysiBoSS 1.0 and was conceived as an add-on that expands the PhysiCell functionalities by enabling the simulation of intracellular cell signalling using MaBoSS while keeping a decoupled, maintainable and model-agnostic design. PhysiBoSS 2.0 also expands the set of functionalities offered to the users, including custom models and cell specifications, mechanistic submodels of substrate internalisation and detailed control over simulation parameters. Together with PhysiBoSS 2.0, we introduce PCTK, a Python package developed for handling and processing simulation outputs, and generating summary plots and 3D renders. PhysiBoSS 2.0 allows studying the interplay between the microenvironment, the signalling pathways that control cellular processes and population dynamics, suitable for modelling cancer. We show different approaches for integrating Boolean networks into multi-scale simulations using strategies to study the drug effects and synergies in models of cancer cell lines and validate them using experimental data. PhysiBoSS 2.0 is open-source and publicly available on GitHub with several repositories of accompanying interoperable tools.


Conflict of interest statement

The authors declare no competing interests.

Figures

Fig. 1
Fig. 1. Multi-scale simulations in systems biology.
a shows a schematic representation of an agent-based model of a 3D multicellular system in a microenvironment defined by the domain divided into fixed volumes together with examples of different intracellular models including signalling network, metabolism and cell cycle. b depicts examples of the different simulators and time scales for a multi-scale model including, the Δtdiff time scale where diffusion, uptake and secretion processes are updated; Δtmec where the mechanics (movement and physical interactions) are updated; Δtcell in which cell processes such as volume, cell cycle and death models are updated; and Δtreg the regulatory time scale in which Boolean models are updated.
Fig. 2
Fig. 2. PhysiBoSS 2.0 add-on-based design.
a shows a diagram of the add-on-based design of PhysiBoSS 2.0 that decouples PhysiCell and MaBoSS providing Boolean simulation functionality to individual cell agents in a maintainable manner. b depicts a high-level view of the PhysiCell and PhysiBoSS 2.0 and the communication between the different components.
Fig. 3
Fig. 3. Different implementations of the multi-scale TNF models.
a schematically represents the multi-scale model used to explore the 3T3 fibroblast spheroids growth dynamics under different TNF exposure regimes. b shows the intracellular models used in the PhysiBoSS original publication (left) and the extended version implemented in PhysiBoSS 2.0 (right).
Fig. 4
Fig. 4. Pair comparison between results obtained using PhysiBoSS 1.0 and PhysiBoSS 2.0.
The plots represent population growth curves for the same TNF pulse in silico experiments reported in the PhysiBoSS 1.0 (left column) and 2.0 (right column). Each panel corresponds to a different in silico experiment. a No TNF added; b single pulse of 0.5 ng/mL for 10 h (600 min); c single pulse of 0.5 mg/mL for 10 h followed by a second pulse of 5 mg/mL for 14 h; d continuous pulse of 0.5 ng/mL throughout the 24 h the experiment last (1440 min); e TNF pulses of 0.5 ng/mL and duration of 10 min at intervals of 150 min; and f TNF pulses of 0.5 ng/mL and duration of 10 min at intervals of 600 min. Vertical grey patches represent the TNF pulses.
Fig. 5
Fig. 5. Multi-scale simulation of LNCaP prostate cancer cell line and combinations of drugs.
Overview of PhysiBoSS 2.0 simulation framework. Drugs in the microenvironment affect the cells' behaviours according to an experimental drug-response curve. Depending on how a specific drug affects a specific cell line, the node targeted by the drug is inhibited at a given rate affecting the cell’s phenotype probabilities, allowing for a tailored simulation of drugs and cell lines.
Fig. 6
Fig. 6. Growth index of the multi-scale simulations with different drug combinations with respect to the untreated LNCaP.
a Pictilisib and Ipatasertib drug combination; b Pictilisib and Luminespib drug combination. Each simulation was replicated 10 times. For each combination, the growth index was obtained by taking the log2 of the ratio between the median AUC upon drug administration and the median AUC of the untreated simulations. “None” row and column means the cells were not treated with the drug. White colour means no growth behaviour change upon drug administration, blue means the drug increased the growth and red means that the drug diminished the growth of the cells. For a complete figure of all the combinations, refer to Supplementary Fig. 9.
Fig. 7
Fig. 7. Bliss independence Combination Index (CI) of the multi-scale simulations of LNCaP with different drug combinations.
a Pictilisib and Ipatasertib drug combination; b Pictilisib and Luminespib drug combination. White colour indicates an additive effect, green colour a synergistic effect and yellow an antagonistic effect. For a complete figure of all the combinations, refer to Supplementary Fig. 11.
Fig. 8
Fig. 8. Heterogeneity of drug screening simulations.
a shows the growth curves for the no-drug simulation and the drug simulation with Ipatasertib (IC50) and Pictilisib (IC90) separated into sphere layers. By taking the distance to the tumour centre, we define five 50 μm-thick spherical layers: layer one is the innermost layer and layer five corresponds to a distance from 200 to 250 μm from the tumour centre. From these growth curves, the AUC values and growth indices are calculated for each layer separately. b shows a 3D representation of the cell population growth indices of the five 50 μm-thick spherical layers at the end of the simulation. Layer 1 is the innermost layer from the centre of the tumour to a distance of 50 μm from the centre. Blue cells are living cells and Red cells are apoptotic.

References

    1. Kitano, H. Foundations of Systems Biology (The MIT Press, 2001).
    1. Albert I, Thakar J, Li S, Zhang R, Albert R. Boolean network simulations for life scientists. Source Code Biol. Med. 2008;3:16. doi: 10.1186/1751-0473-3-16. - DOI - PMC - PubMed
    1. Calzone L, et al. Mathematical modelling of cell-fate decision in response to death receptor engagement. PLoS Comput. Biol. 2010;6:e1000702. doi: 10.1371/journal.pcbi.1000702. - DOI - PMC - PubMed
    1. Heirendt L, et al. Creation and analysis of biochemical constraint-based models using the COBRA Toolbox v.3.0. Nat. Protoc. 2019;14:639–702. doi: 10.1038/s41596-018-0098-2. - DOI - PMC - PubMed
    1. Folger O, et al. Predicting selective drug targets in cancer through metabolic networks. Mol. Syst. Biol. 2014;7:501–501. doi: 10.1038/msb.2011.35. - DOI - PMC - PubMed

Publication types